Liquidity on Edge

insights.glassnodeXuất bản vào 2025-11-25Cập nhật gần nhất vào 2025-11-26

Executive Summary

  • Bitcoin trades in a fragile $81K–$89K range after losing key cost-basis support, mirroring Q1 2022 weakness.
  • Realized losses are elevated, with STH loss ratios collapsing to 0.07x, signaling fading liquidity and demand.
  • Long-term holders still realize profit, but their momentum is weakening and could shift if liquidity deteriorates further.
  • Futures markets show orderly deleveraging, neutral funding, and reduced leverage across BTC and altcoins.
  • Options positioning remains defensive, with heavy puts near 84K and upside still being faded around 100K.
  • Implied volatility stays elevated, and the December expiry is shaping up as a key volatility event.
  • Overall sentiment is cautious, and recovery requires reclaiming major cost-basis models and renewed inflows.

On-chain Insights

Drifting Into Void

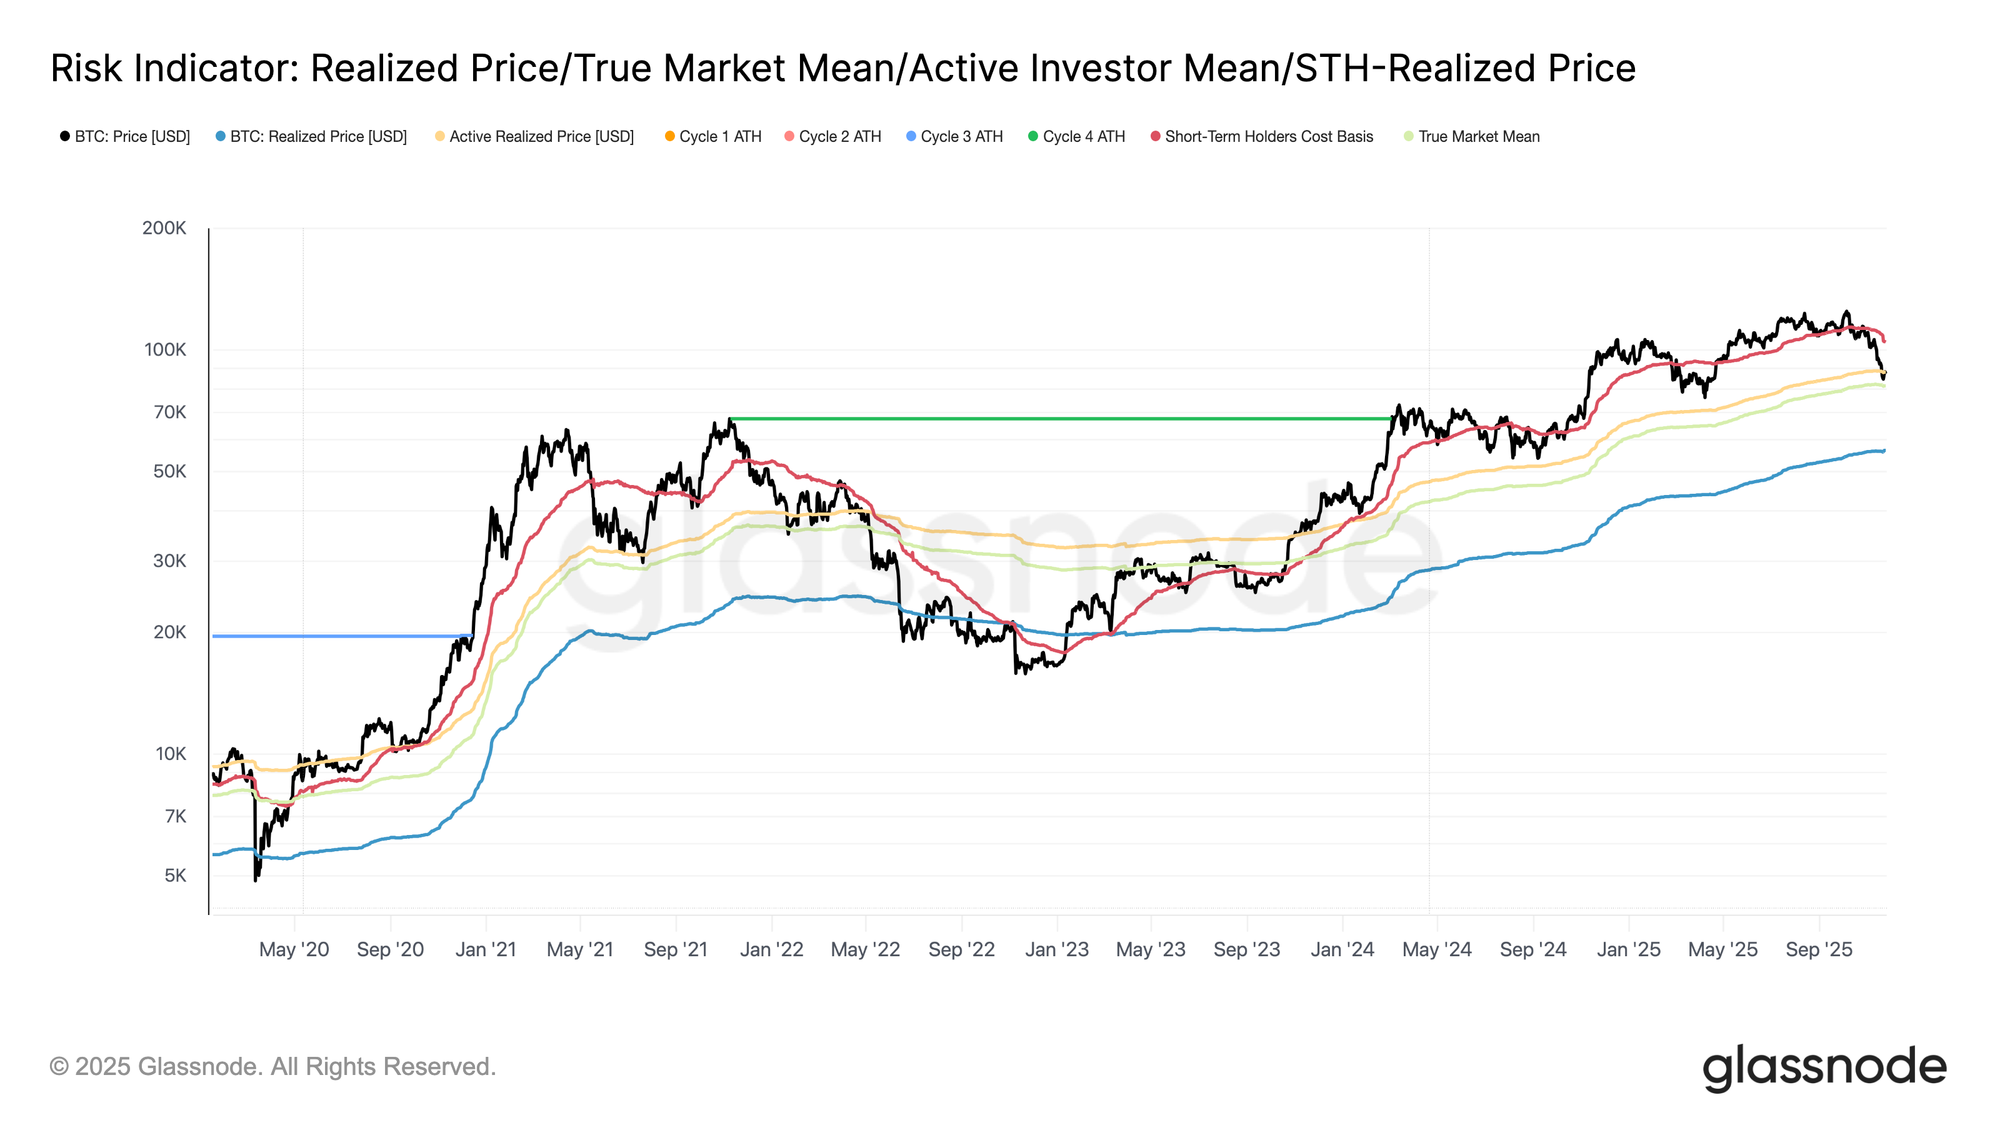
Trading below the short-term holder cost basis (~$104.6K) since early October has pushed Bitcoin into a zone that highlights the market’s lack of liquidity and demand. Price is now retesting a major structural range typically defined by the Active Realized Cap Price—the cost basis of all non-dormant coins—and the True Market Mean, which reflects coins acquired on the secondary market.

Over the past weeks, Bitcoin has compressed into the $81K–$89K band, a structure closely resembling the Q1 2022 post-ATH interval, where the market weakened under fading demand. This current range echoes the same dynamic with market drifting lower, constrained by limited inflows and fragile liquidity.
Live Chart

Losses Stack Up

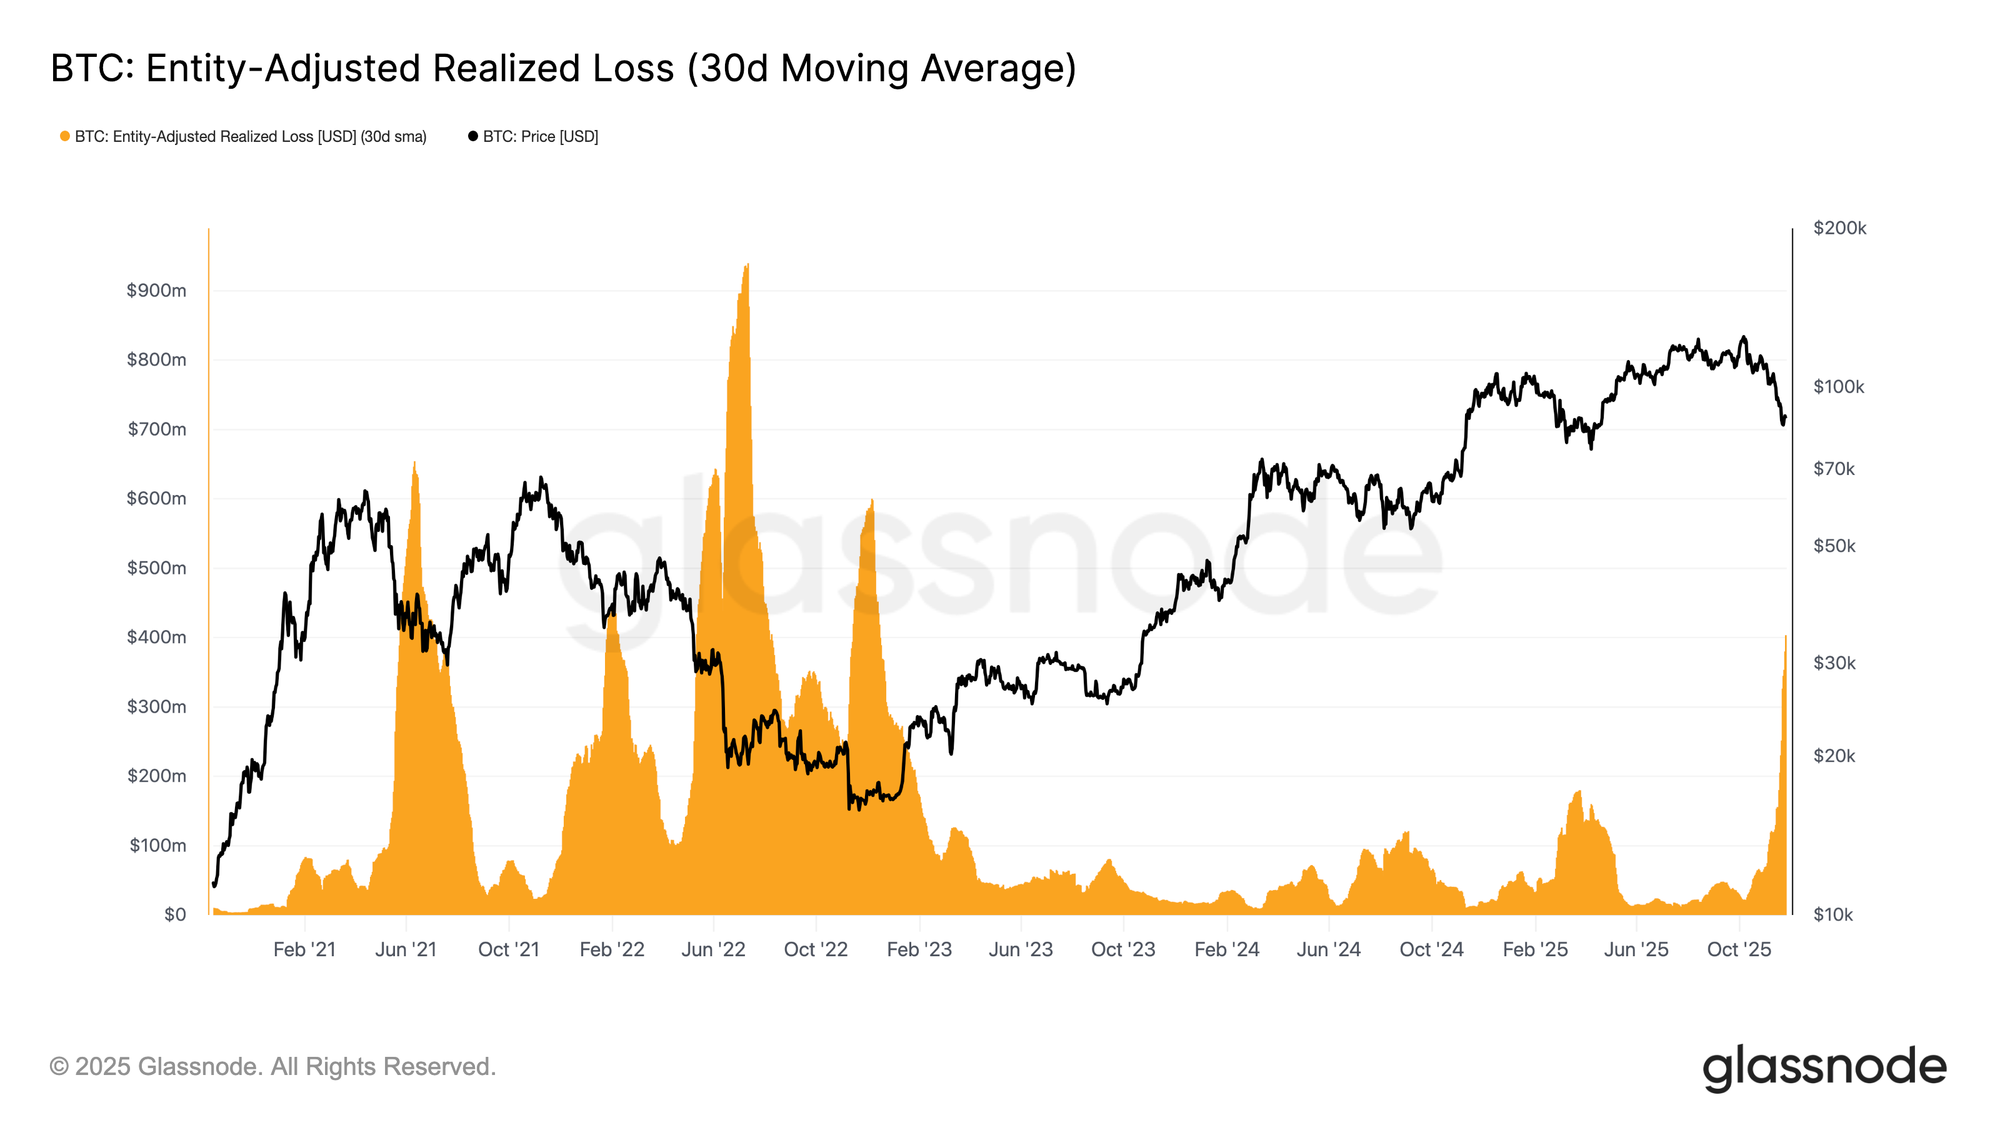
Transitioning deeper into this comparison, another angle that mirrors Q1 2022 is the sharp rise in Entity-Adjusted Realized Loss (30D-SMA), now climbing to $403.4M per day.

This level exceeds the waves of realized losses seen at both major lows earlier in this cycle, signalling a clear erosion of confidence in the uptrend. Such elevated loss realization is typical of a weakened, liquidity-seeking market, where investors increasingly exit at a loss as momentum fades.
Live Chart

Liquidity Stress Signals

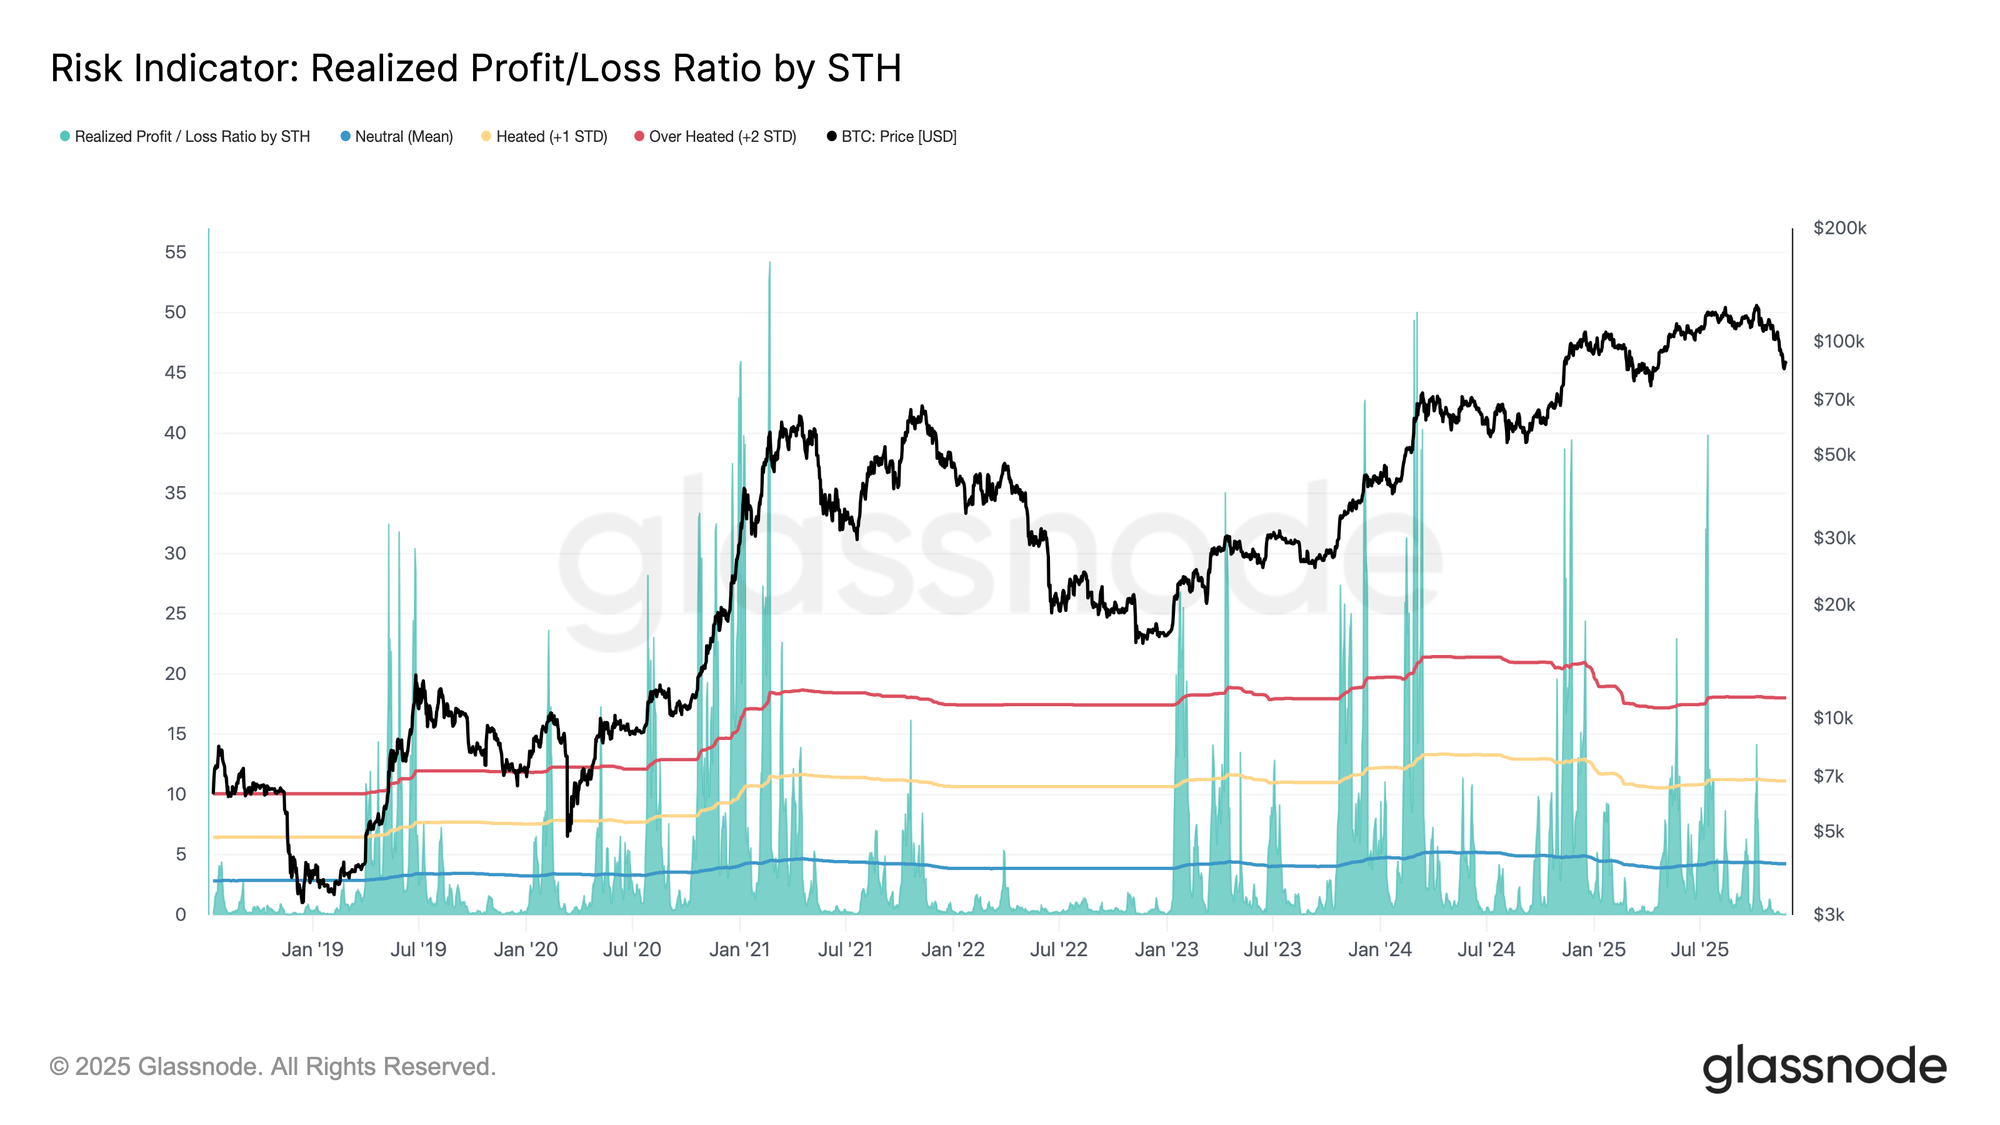
With market structure weakening, liquidity becomes the key lens for understanding what comes next. A prolonged low-liquidity regime increases the risk of further contraction, and the STH Realized Profit/Loss Ratio offers one of the clearest windows into current demand momentum.

This ratio, which compares realized profits to realized losses among recent investors, slipped below its neutral Mean (4.3x) in early October and has now collapsed to 0.07x. Such overwhelming loss dominance confirms that liquidity has evaporated, especially after the heavy demand absorption seen in Q2–Q3 2025 as long-term holders increased their spending.

If this ratio remains depressed, market conditions could begin to mirror the weakness of Q1 2022, raising the risk of a breakdown below the True Market Mean (~$81K).
Live Chart

Long-Term Liquidity at Risk

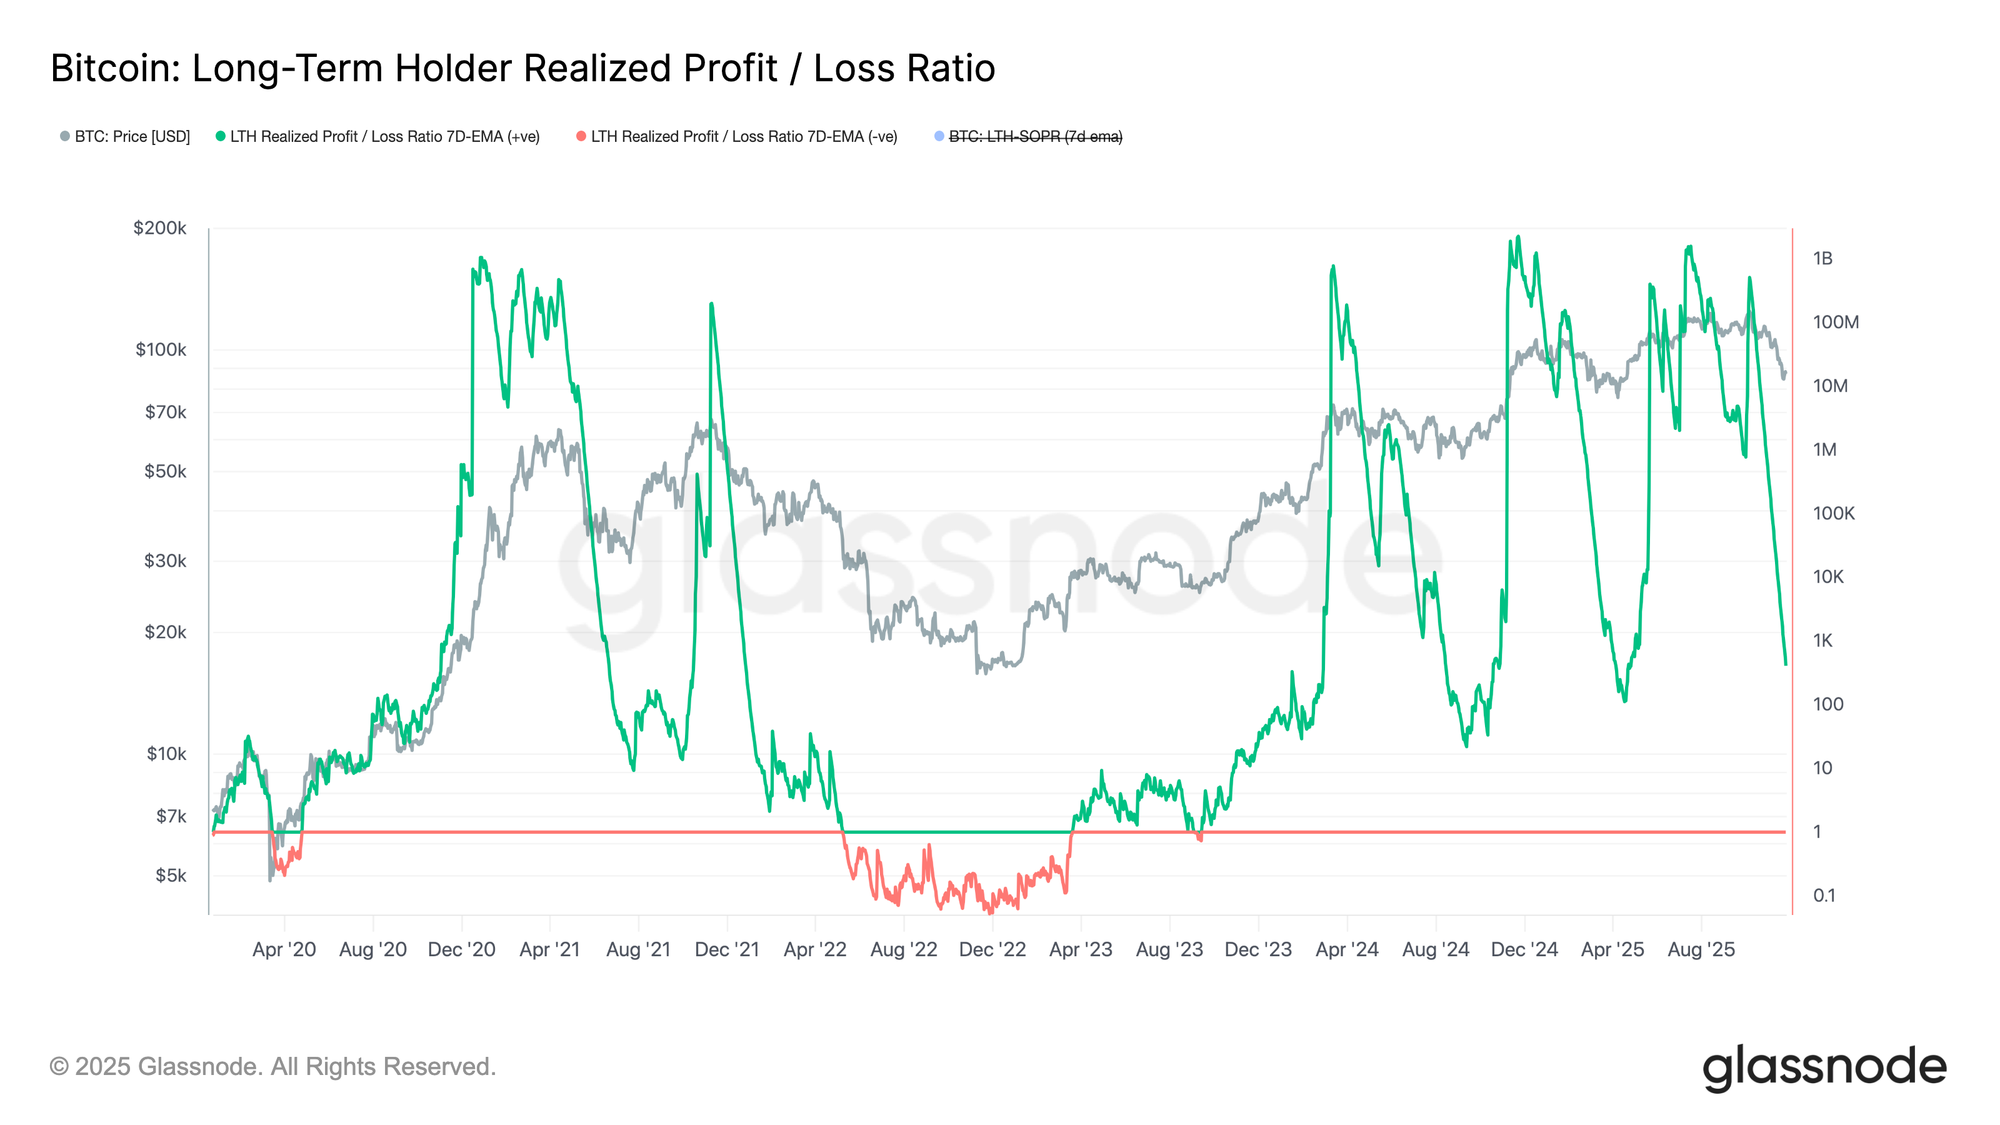
Liquidity traced through the realized profit/loss lens can also be extended to long-term momentum by examining the LTH Realized Profit/Loss Ratio. The 7D-SMA of this metric has followed the spot price lower, sharply dropping to 408x. Trading above ~100x still indicates healthier liquidity conditions compared to Q1 2022 or the major bottom-formation phases of this cycle, meaning long-term holders are still realizing profit, not loss.

However, if liquidity continues to fade and this ratio compresses toward 10x or lower, the probability of transitioning into a deeper bear market becomes difficult to ignore. This threshold has historically marked severe stress across long-term cohorts.
Live Chart

Off-Chain Insights

Leverage Bleeds Out

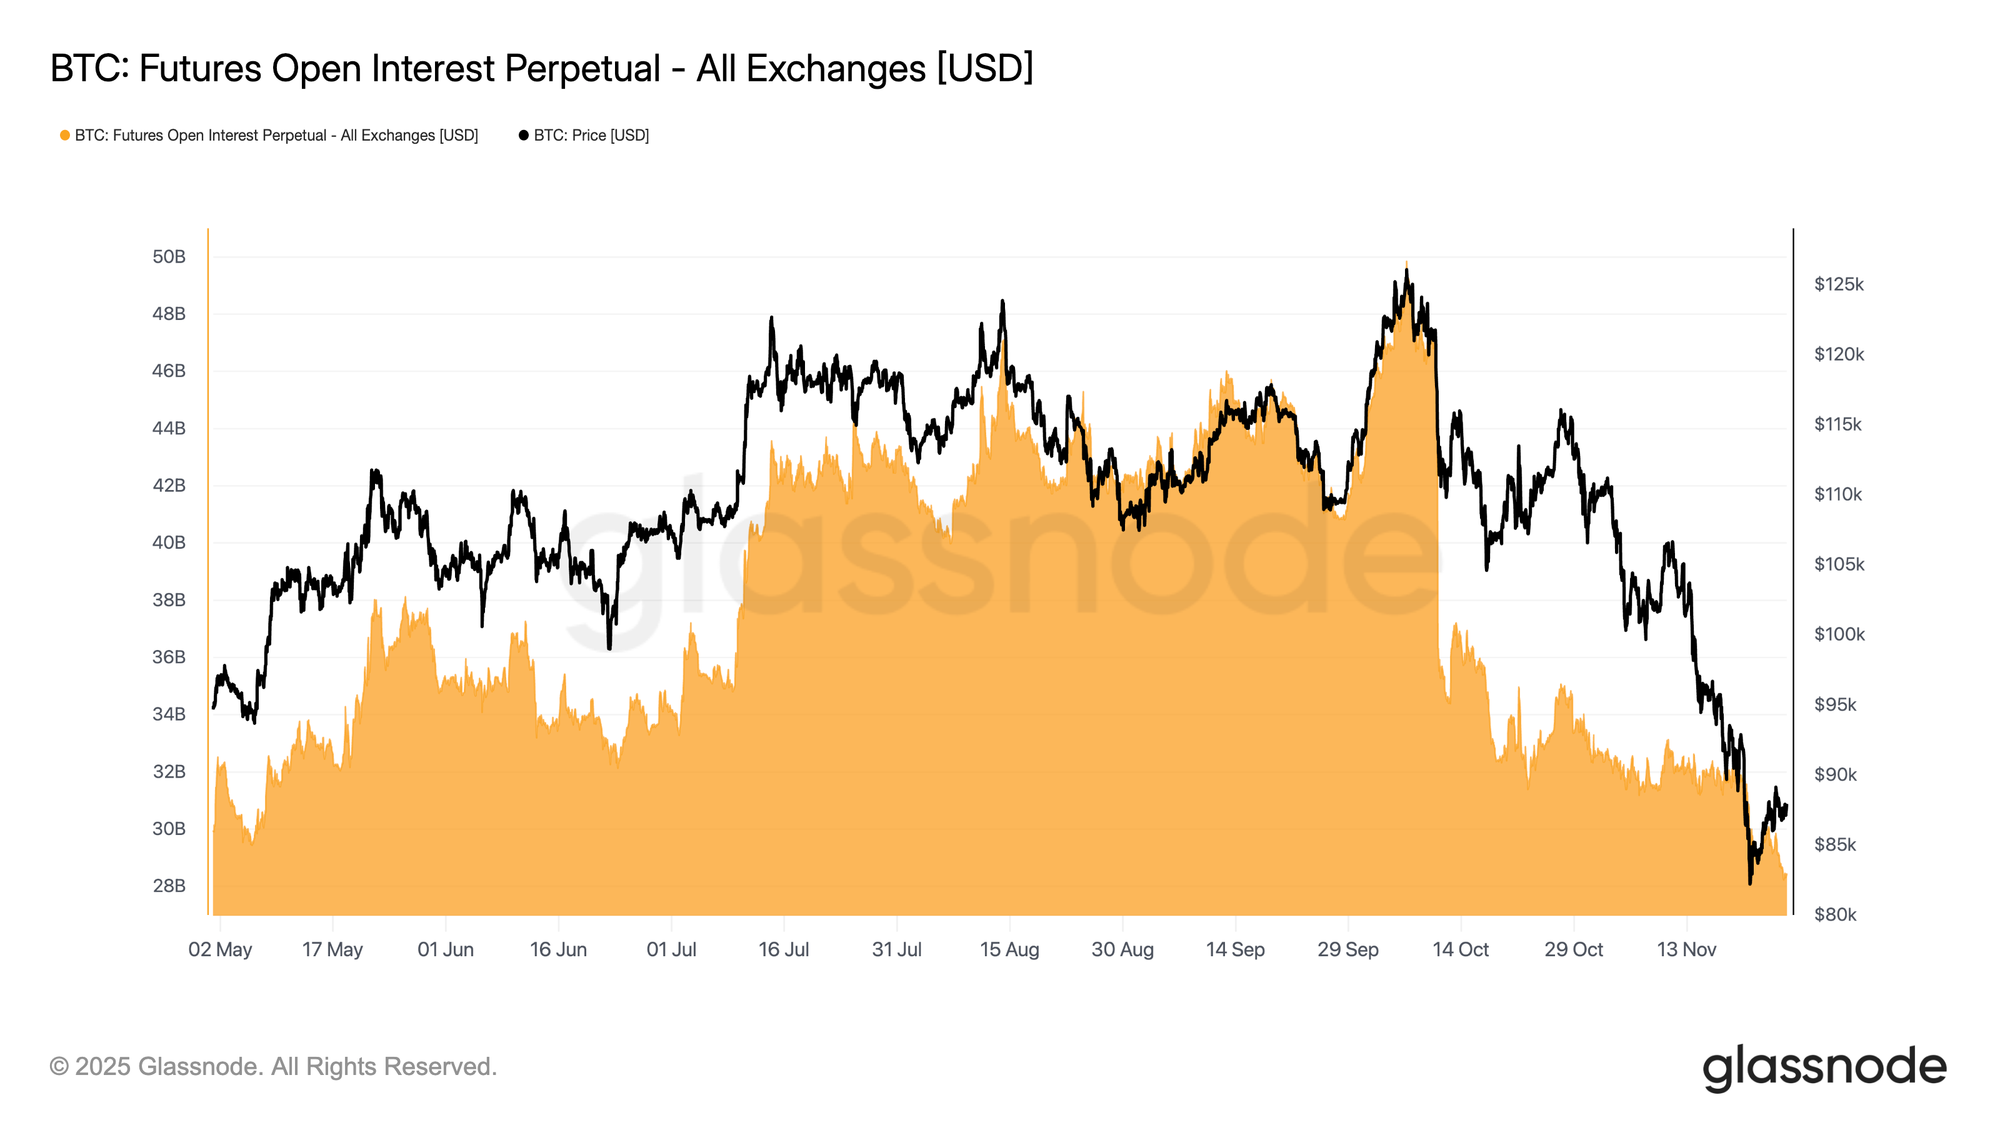
Shifting to off-chain dynamics, futures open interest continues to fall alongside price, steadily unwinding the leverage accumulated during earlier rallies. This deleveraging has remained orderly, with little evidence of forced liquidations, suggesting derivatives traders are adopting a controlled, risk-off posture rather than panic unwinding.

The market now rests on a leaner leverage base, which lowers the odds of sharp, liquidation-driven volatility and reflects a more cautious, defensive positioning across futures markets.
Live Chart

Funding Turns Cautious

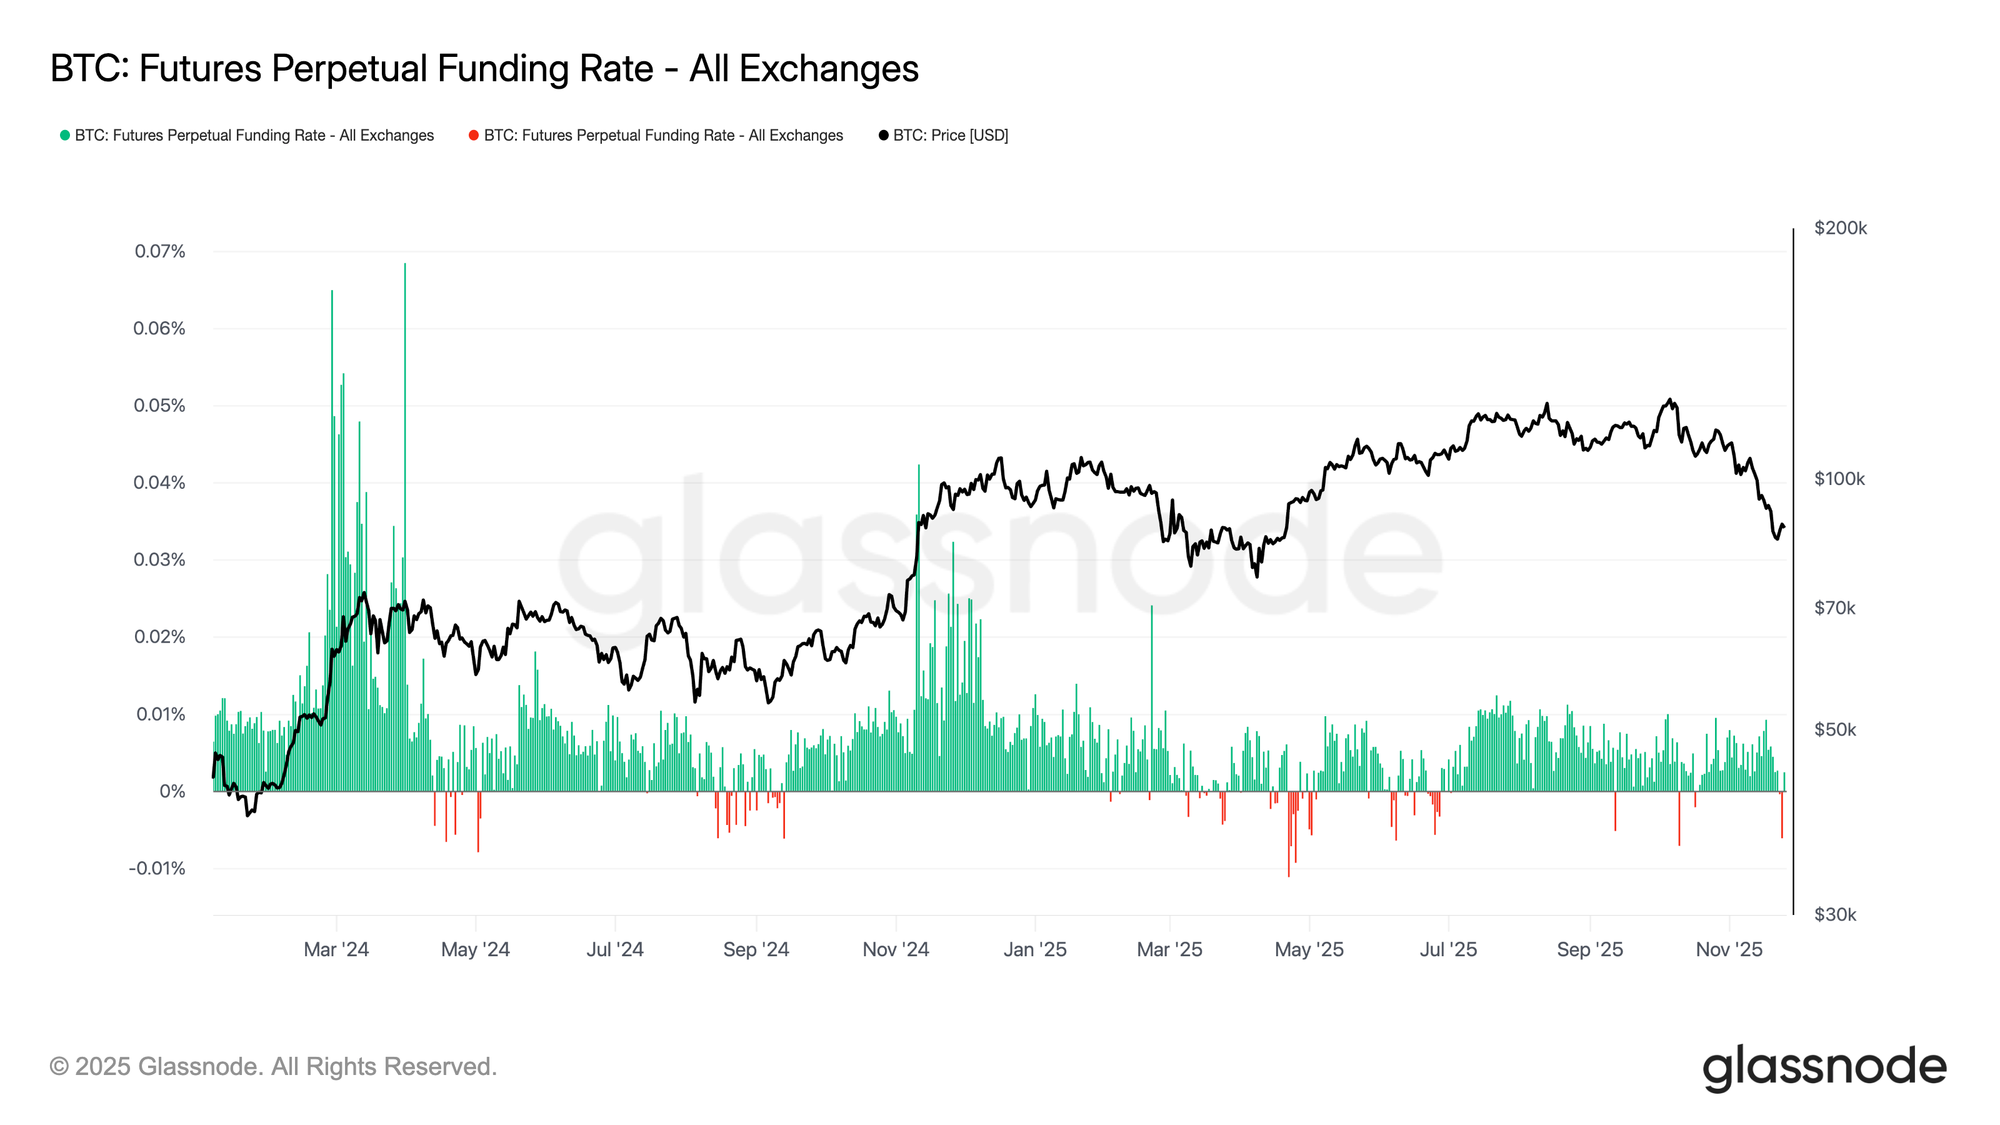
In parallel to the drop in open interest, perpetual funding rates have hovered near neutral, with occasional dips into negative territory. This marks a clear shift from the consistently positive funding typical of more speculative phases, signalling a more balanced and cautious derivatives environment.

Neither aggressive short exposure nor strong long interest is taking control, leaving the market in a tentative state of fragile equilibrium as traders wait for clearer signals before committing to direction.
Live Chart

A New High in Options OI

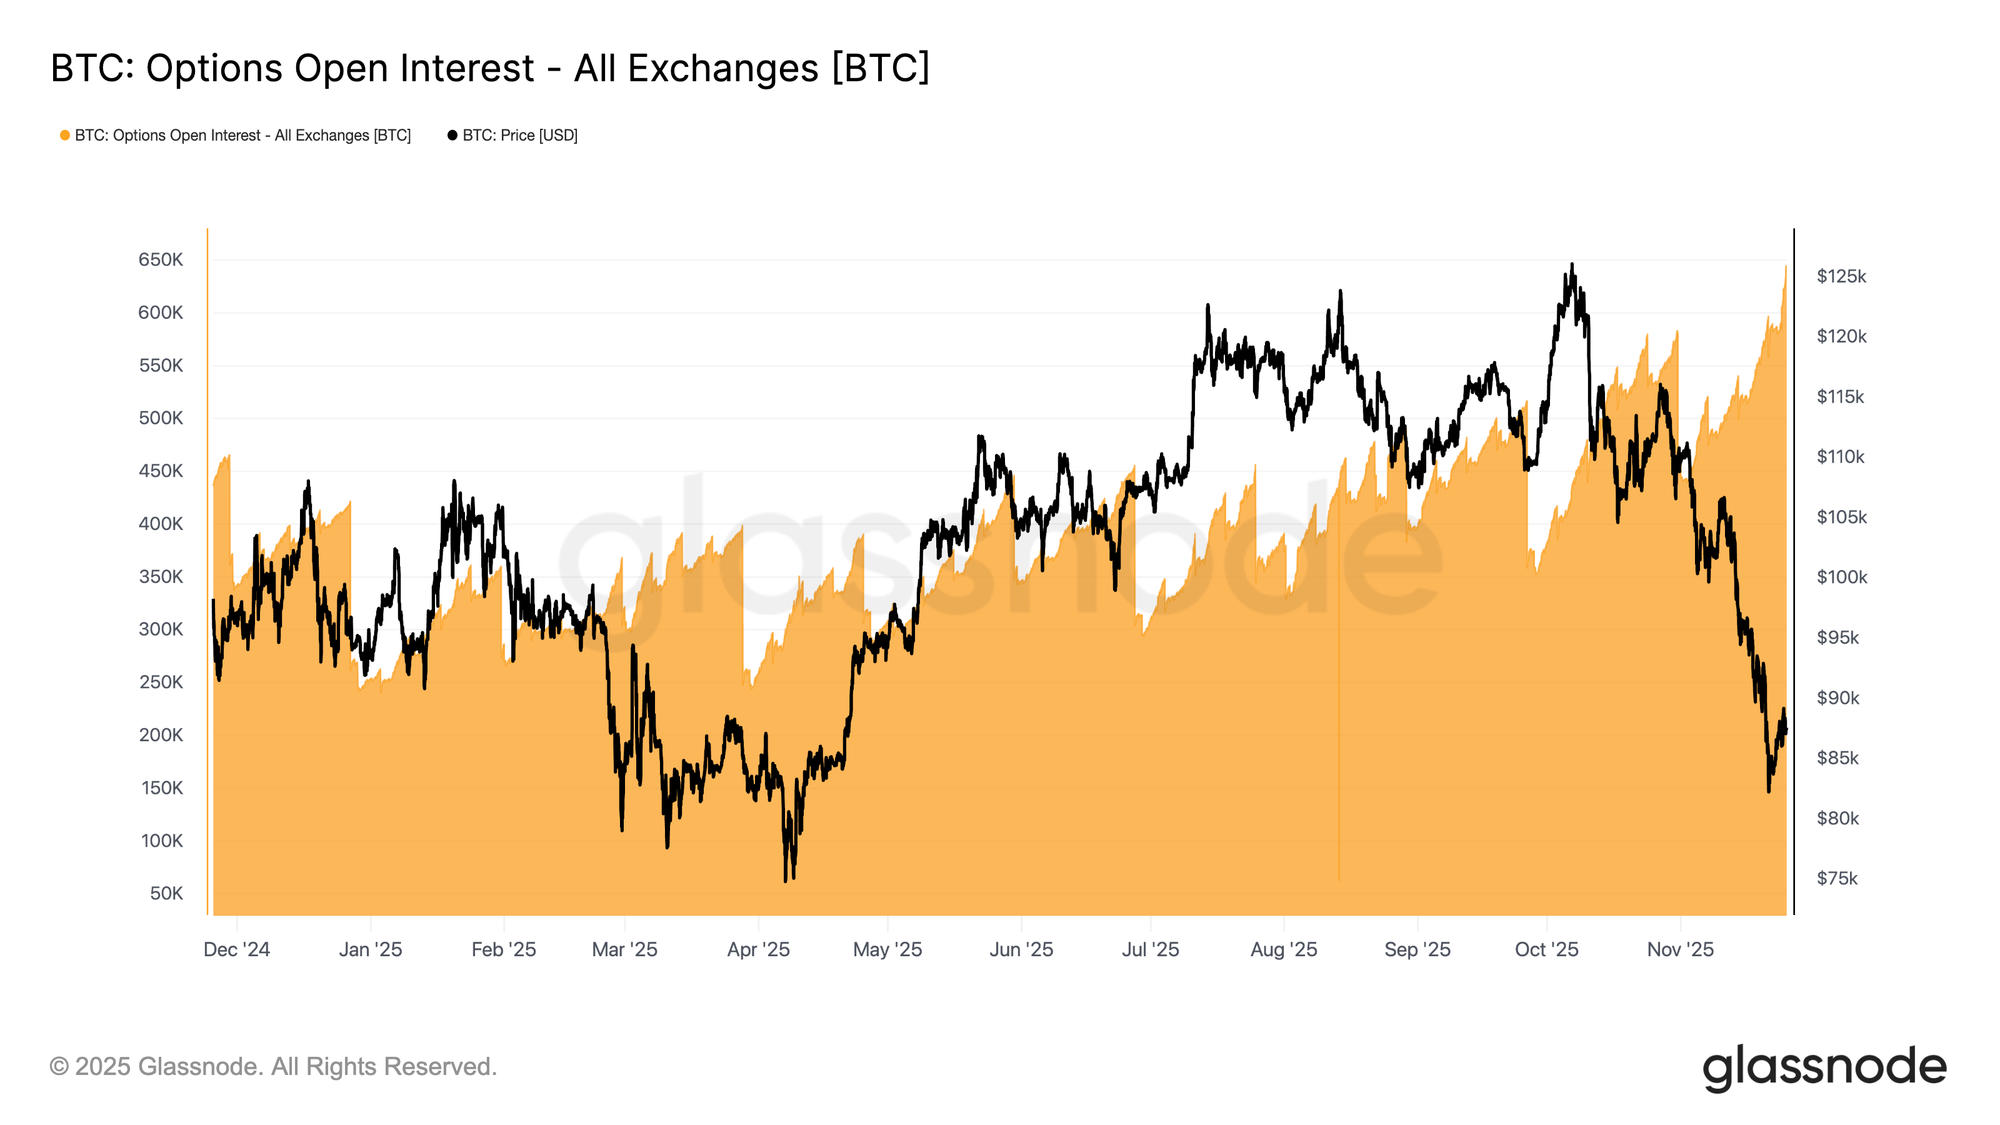
The recent surge in volatility has increased activity across the options market. A combination of volatility-arbitrage strategies and renewed demand for risk management has pushed BTC-denominated options open interest to its highest level ever. It’s important to emphasize that this applies only to BTC terms. In USD terms, open interest remains well below the late-October peak, when Bitcoin was trading near $110k.

Even so, the current build-up highlights how engaged the market has become as participants reposition around the latest price swing. This sets the stage for the upcoming key expiry, which is shaping up to be one of the most significant in the near term.
Live Chart

Upside Capped & Downside Risk Not Washed Out

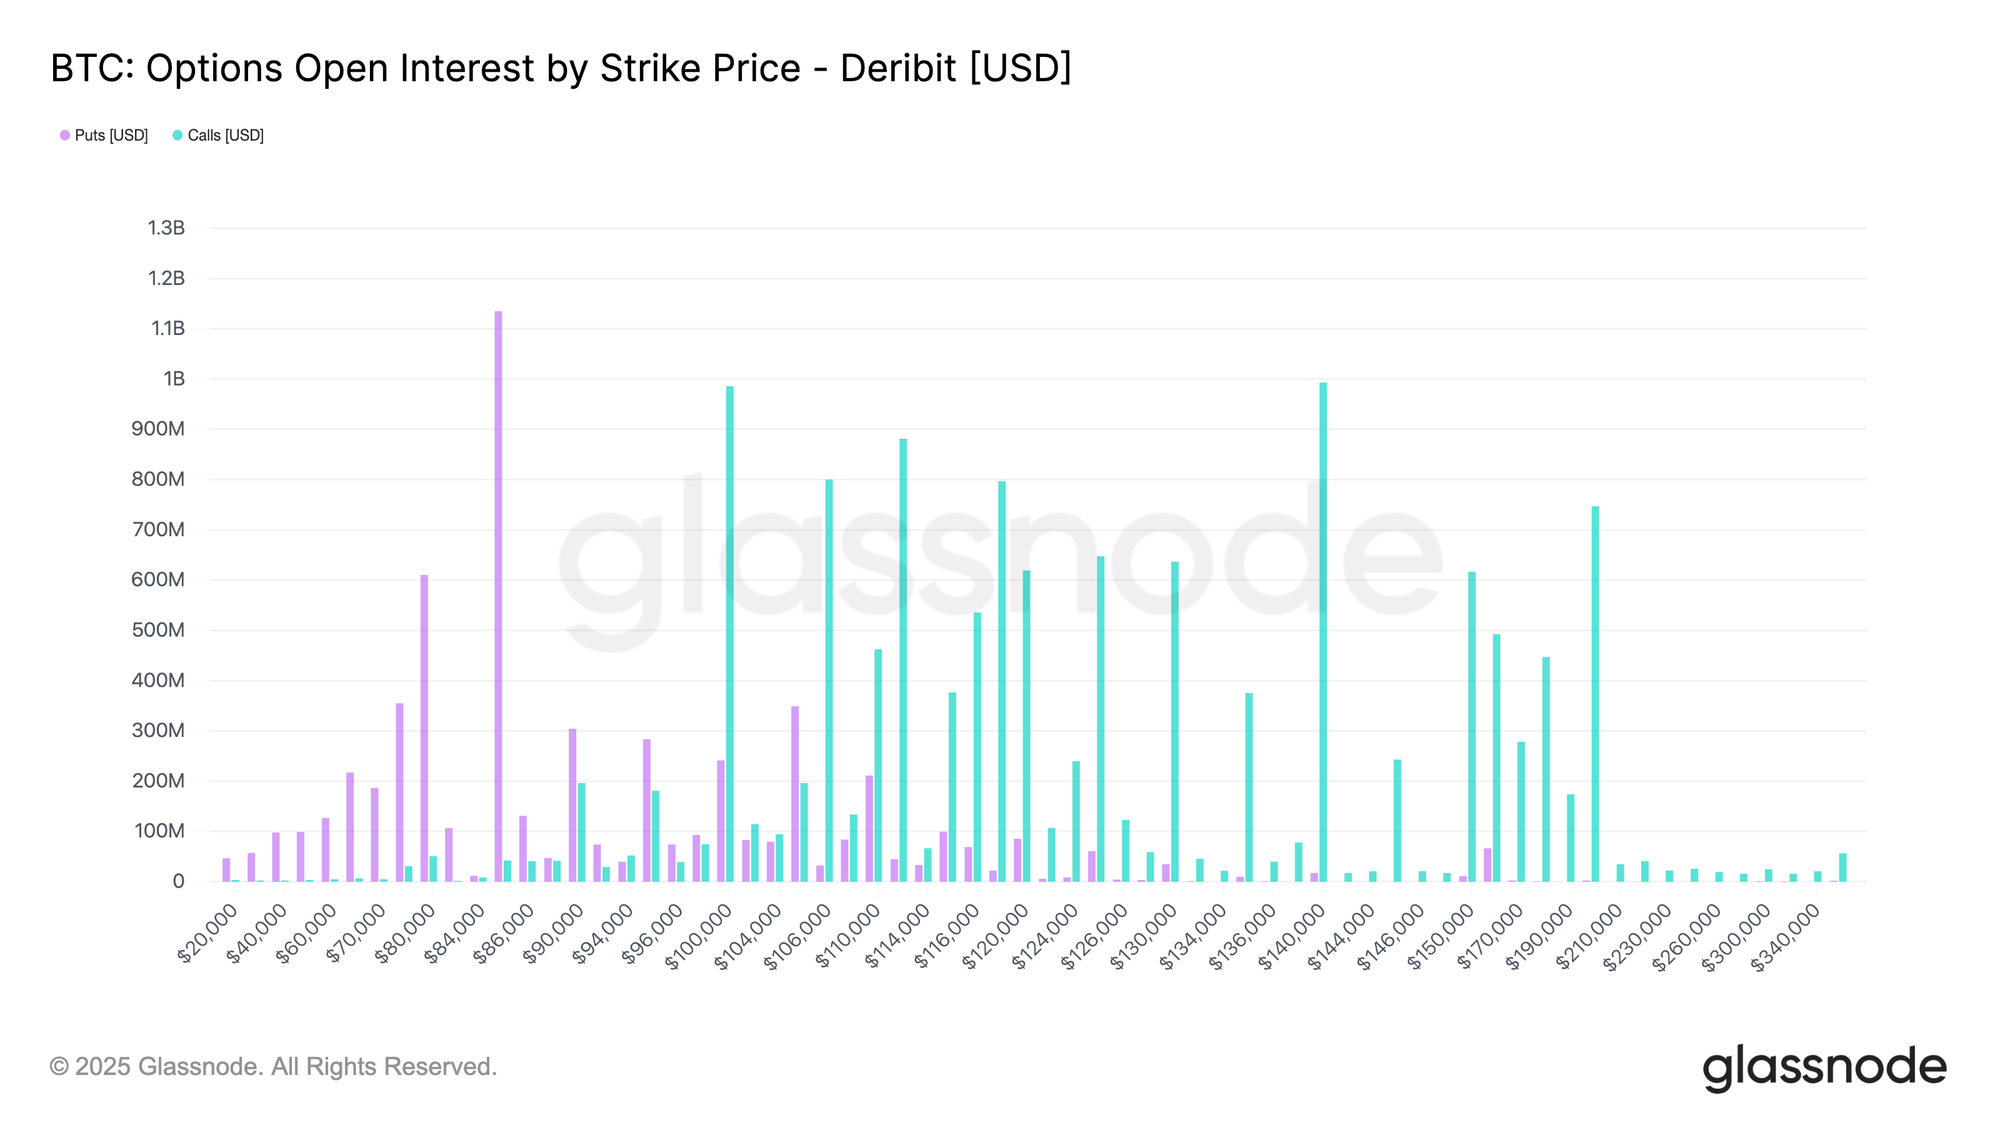
The most important expiry of the year is approaching, and its influence has grown alongside the expansion of the options market. Large clusters of open interest, and the hedging flows around them, help shape which price levels attract liquidity. Hedging needs rise as gamma increases, and gamma is typically highest as we near expiry and when spot trades close to the at-the-money strike. This makes late December a period where volatility can meaningfully pick up.

The strike distribution shows a heavy put concentration near $84k and growing call interest around $100k. The zone between these strikes is relatively thin, creating room for sharper movement within that range. Dealers are short gamma on puts and long gamma on calls, implying that upside may remain capped over the coming weeks, while downside risk has not been fully cleared. In short, the recent rebound may continue to struggle below key resistance.
Live Chart

A Short-Term Skew Less Bearish

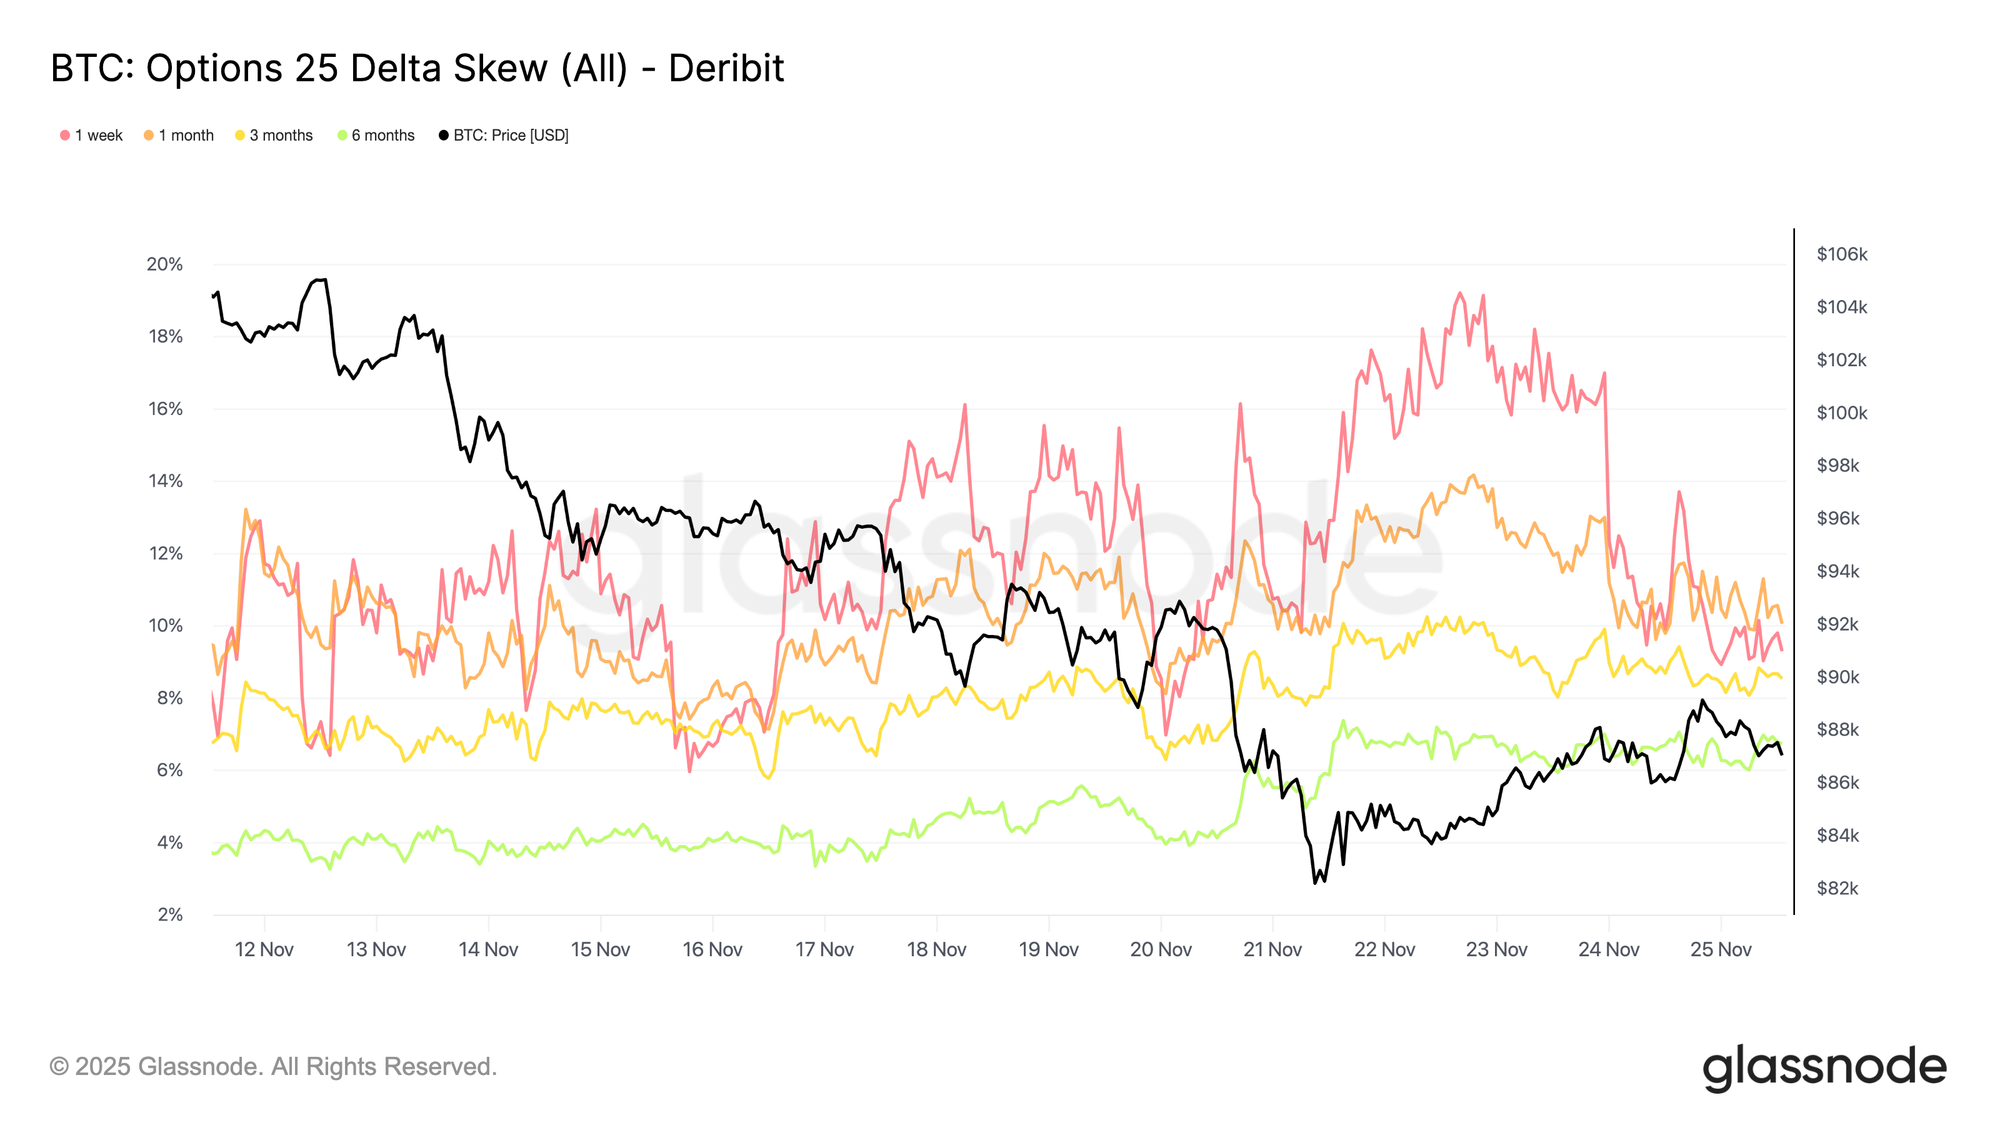
Moving from strike positioning to sentiment indicators, the 25-delta skew shows a clear shift in short-term expectations. The one-week skew dropped sharply from an 18.5% put premium on Sunday to 9.3% by Tuesday morning, now sitting below the one-month skew. This reset suggests the market has, for now, priced out the most immediate crash risk. Short-dated demand for protection has eased noticeably following the recent rebound.

The picture further out of the curve is different. Over the past two weeks, the six-month skew in favor of puts has nearly doubled, reflecting rising concern about a prolonged bearish path into 2026. Longer-dated skew remains elevated relative to short-term maturities, pointing to persistent demand for tail-risk protection even as near-term fear moderates.
Live Chart

Volatility Reverting

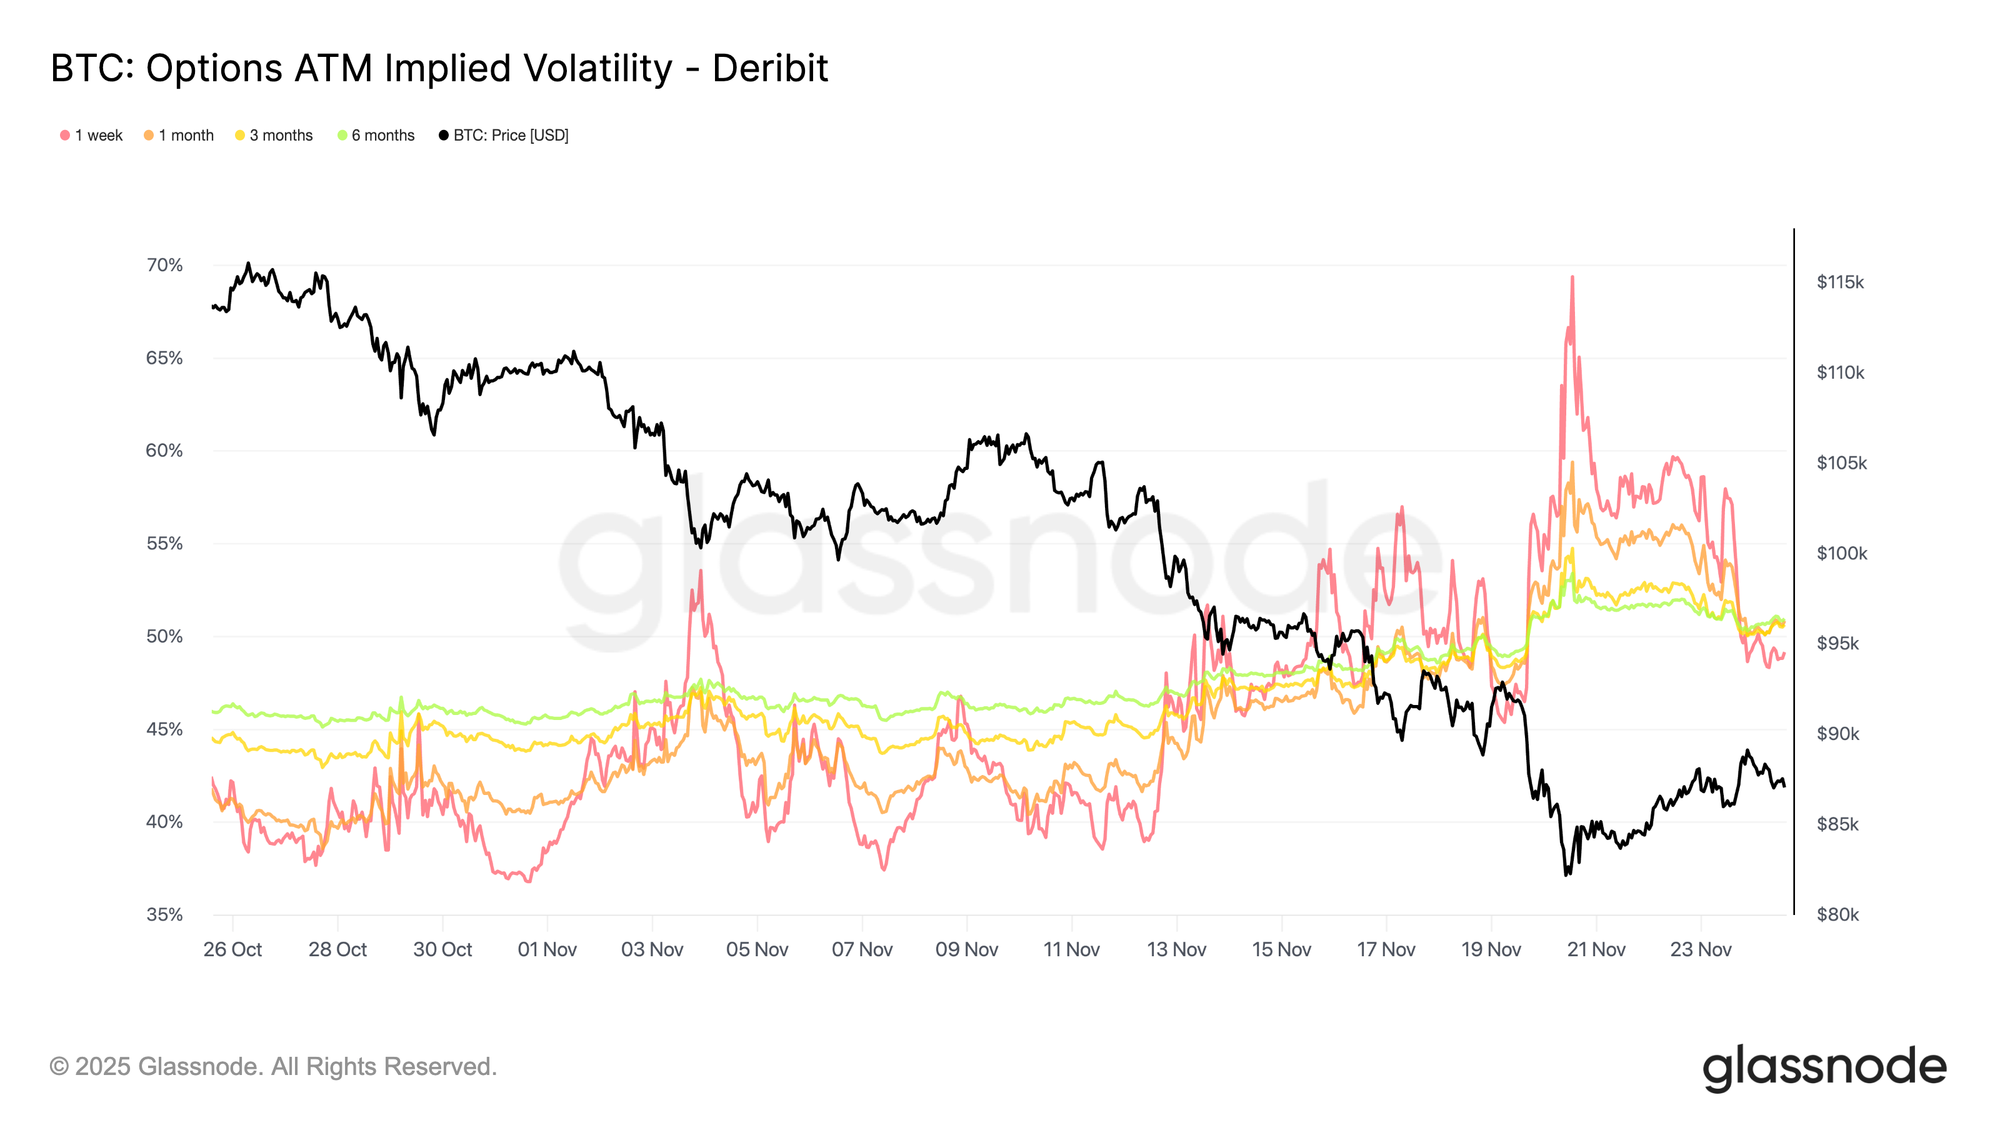
Following the shift in skew, volatility itself is beginning to move back toward more typical levels. Recent patterns show a clear mean reversion, suggesting that volatility sellers are stepping back in — though implied volatility still sits above what the market has delivered in recent sessions. One-month implied volatility remains elevated, even after the short end dropped roughly 20 vol points from its peak earlier in the week and about 10 vol points from levels seen in recent days. This retracement indicates that part of the stress premium is being unwound.

Taken together, the decline in implied volatility and the easing of put skew point to softer demand for immediate downside protection. Short-term fear has cooled, even if the broader environment remains prone to sudden shifts.
Live Chart

In Positive Carry Territory

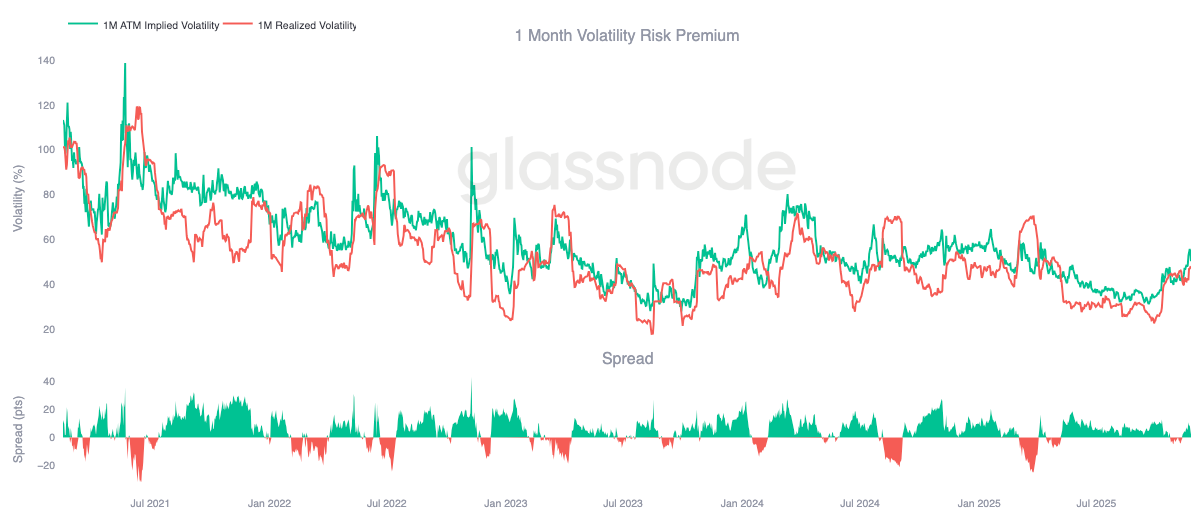
Shifting from volatility levels to carry dynamics, the current market environment has moved into positive carry territory. In options terms, positive carry means short positions earn theta because realized volatility is running below implied volatility. Put simply, the market is not moving as much as the options market is pricing in, allowing sellers to collect time decay without giving it back through hedging losses.

One-month implied volatility remains elevated, and far-out-of-the-money options expiring in late December still command high premiums. This setup makes selling volatility appear attractive from a carry perspective, since implied volatility sits above what the market has recently delivered. However, conditions can shift quickly, and the upcoming Federal Reserve meeting introduces potential event risk that could change realized volatility and the carry landscape.
Live Dashboard

Downside Flow

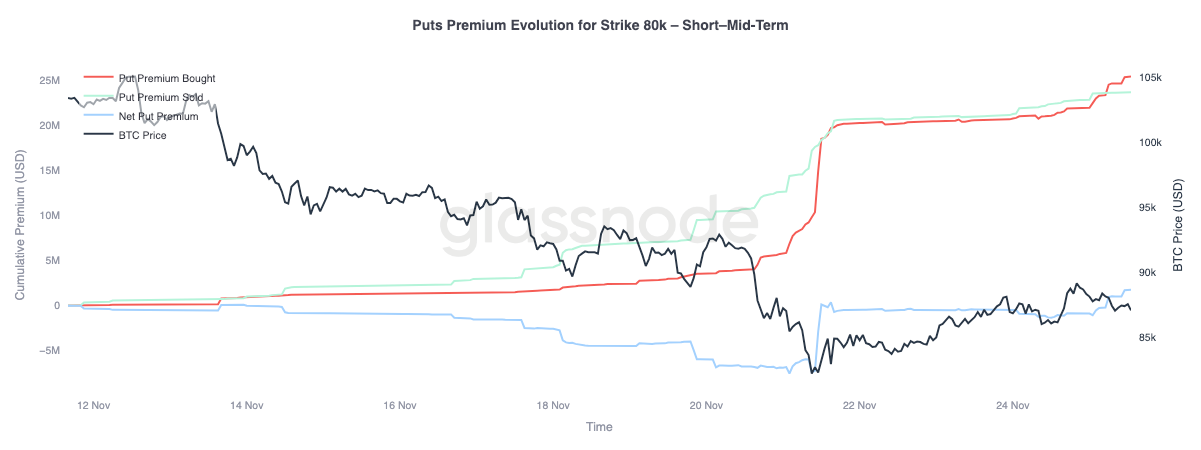
Turning to flows, the activity around the $80k put offers a clear view of how downside protection has evolved across short- and mid-term expiries. Put demand has flattened over the past four days, aligning with the rebound that began near $80.5k. This plateau indicates that the immediate need for short-dated hedges has eased. The sharp pickup in downside protection observed during the selloff has not continued since the recovery started.

With short-dated downside flows fading, the market is signaling that the probability of an extended move lower is now viewed as smaller than during the recent decline. Sentiment has shifted from urgent protection to a more measured, cautious stance.
Live Dashboard

Upside Flow

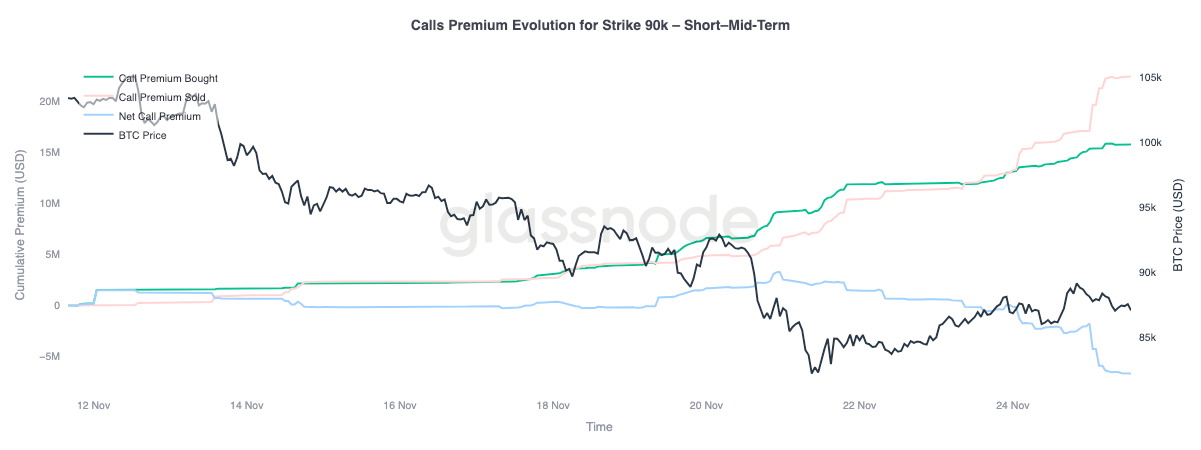
Looking at flows on the upside provides a contrasting message. Even though the market now sees a reduced risk of an immediate crash, it does not yet believe in a sustained recovery. The preference has been to fade attempts to reclaim the 90,000 level rather than position for a breakout, highlighting that confidence in the rebound remains limited.

The flow data supports this view. Call premium sold has exceeded call premium bought, while price has been grinding higher. Participants are using the bounce to sell premium and collect carry, rather than commit to upside continuation. The recent move up may have removed short-term panic, but it has not resolved the deeper structural fragility still present in the market.
Live Dashboard

Conclusion

Bitcoin remains in a structurally fragile state, trading within the $81K–$89K range after breaking below key cost-basis levels. On-chain data shows rising stress: STH loss ratios collapsing to 0.07x, long-term holders reducing profit margins, and realized losses reaching levels comparable to early-cycle lows. Liquidity continues to thin, and unless demand strengthens, the risk of retesting the True Market Mean (~$81K) remains elevated.

Off-chain signals echo this caution. Futures open interest is unwinding steadily, funding rates are neutral, and leverage across major assets has faded. In the options market, heavy put interest near 84K, capped call appetite near 100K, and elevated implied volatility all point to a market bracing for volatility into the December expiry. Upside flows are still being faded, while downside protection is stabilizing rather than disappearing.

In sum, Bitcoin is not in full capitulation but remains firmly in a low-liquidity, low-conviction environment. Until price reclaims major cost-basis levels and fresh demand returns, the market is likely to stay in a defensive consolidation phase.


Disclaimer: This report does not provide any investment advice. All data is provided for informational and educational purposes only. No investment decision shall be based on the information provided here, and you are solely responsible for your own investment decisions.

Exchange balances presented are derived from Glassnode’s comprehensive database of address labels, which are amassed through both officially published exchange information and proprietary clustering algorithms. While we strive to ensure the utmost accuracy in representing exchange balances, it is important to note that these figures might not always encapsulate the entirety of an exchange’s reserves, particularly when exchanges refrain from disclosing their official addresses. We urge users to exercise caution and discretion when utilizing these metrics. Glassnode shall not be held responsible for any discrepancies or potential inaccuracies. 

Please read our Transparency Notice when using exchange data.

Tiền kỹ thuật số thịnh hành

Nội dung Liên quan

Lập trình viên toàn cầu đang 'tặng tiền' cho Anthropic! Phía chính thức cuối cùng cũng không thể tiếp tục im lặng.

Vừa qua, Anthropic đã xuất bản một bài blog chính thức với thông điệp rõ ràng: các lập trình viên đang lãng phí rất nhiều token khi sử dụng Claude Code và cần sử dụng hợp lý hơn để tiết kiệm chi phí. Dưới đây là những phương pháp chính được đề xuất: 1. **/clear sau mỗi nhiệm vụ:** Kết thúc một task (như sửa lỗi), hãy xóa lịch sử hội thoại hiện tại để tránh các file và kết quả lệnh không liên quan làm đầy ngữ cảnh cho task tiếp theo. 2. **Cố định mô hình và cường độ suy luận (effort level) ngay từ đầu:** Việc chuyển đổi giữa các mô hình (như từ Sonnet sang Opus) hoặc thay đổi effort level sẽ khiến bộ nhớ đệm (cache) bị mất hiệu lực, buộc toàn bộ lịch sử hội thoại phải được tính toán lại với mức giá đầy đủ. 3. **Sử dụng @ để tham chiếu file:** Thay vì nhập đường dẫn thủ công, hãy đính kèm trực tiếp file vào tin nhắn bằng ký hiệu @. Điều này giúp Claude đọc file trực tiếp, tránh các thao tác tìm kiếm thử nghiệm tốn token. 4. **Thêm tham số "yên lặng" (quiet flag) cho các lệnh có đầu ra dài:** Cấu hình trong CLAUDE.md để các lệnh như chạy test chỉ xuất ra bản tóm tắt ngắn, giảm đáng kể độ dài văn bản được thêm vào ngữ cảnh. 5. **Sử dụng /compact khi bộ nhớ cache còn "nóng":** Nén hội thoại khi dữ liệu vẫn còn trong cache sẽ chỉ tốn ~1/10 chi phí so với việc thực hiện sau khi cache đã hết hạn. 6. **Giao nhiệm vụ đầu ra lớn cho Subagent:** Subagent chạy trong một cửa sổ ngữ cảnh độc lập, chỉ trả về kết luận cuối cùng, giữ cho quá trình trung gian (đọc file, chạy lệnh) không làm nặng hội thoại chính. **Giải thích về chi phí Token:** - **Token đầu vào (prefill)** được xử lý song song, rẻ hơn. - **Token đầu ra (decode)** được tạo tuần tự, đắt hơn gấp **5 lần** token đầu ra. - **Bộ nhớ đệm (Cache)** là công cụ tiết kiệm mạnh mẽ nhất: nếu phần đầu của yêu cầu hiện tại giống hệt lần trước, chi phí đọc lại chỉ bằng **10%** giá gốc. Tuy nhiên, cache dễ mất do thay đổi mô hình, effort level, hoặc hết thời gian timeout. **Quản lý sự "phình to" của hội thoại:** Mỗi file được đọc hay kết quả lệnh được thực thi đều được thêm vào lịch sử, khiến các lượt hội thoại sau phải gửi lại toàn bộ nội dung tích lũy trước đó, làm chi phí tăng theo cấp số nhân. Ngoài các mẹo trên, có thể dùng **/rewind** để cắt bỏ các lượt hội thoại đi lệch mà không làm hỏng cache. **Kết luận:** Việc quản lý hiệu quả token - từ chọn mô hình, bảo toàn cache đến kiểm soát độ dài ngữ cảnh - đang trở thành một kỹ năng thiết yếu của lập trình viên trong thời đại AI. Nó không chỉ giúp tiết kiệm chi phí (chênh lệch có thể lên tới 10 lần cho cùng một task), mà còn tối đa hóa giá trị làm việc với ngân sách có sẵn.

marsbit27 phút trước

Lập trình viên toàn cầu đang 'tặng tiền' cho Anthropic! Phía chính thức cuối cùng cũng không thể tiếp tục im lặng.

marsbit27 phút trước

Pax Silica đối đầu WAICO: Mỹ muốn cấm châu Âu sử dụng trí tuệ nhân tạo của Trung Quốc

Hoa Kỳ dự kiến yêu cầu các đối tác châu Âu và các nước khác từ bỏ các sáng kiến trí tuệ nhân tạo (AI) của Trung Quốc, nếu không sẽ bị loại khỏi liên minh công nghệ Pax Silica do Mỹ dẫn đầu. Thông tin này dựa trên một dự thảo tài liệu nội bộ của Bộ Ngoại giao Mỹ, được Reuters công bố. Văn bản nhắm tới 35 quốc gia đã ký Tuyên bố Cơ hội AI vào tháng 6/2026, trong đó có nhiều nước châu Âu. Lập trường của Mỹ rõ ràng: thành viên Pax Silica không thể đồng thời tham gia các dự án trùng lặp có mục tiêu trái ngược. Pax Silica, được Mỹ khởi xướng từ cuối năm 2025, là chiến lược nhằm duy trì vị thế thống lĩnh trong lĩnh vực AI và bán dẫn. Sự mở rộng thành viên của khối này, đặc biệt là khi EU và một số nước châu Âu gia nhập vào giữa năm 2026, đã củng cố khối phương Tây. Tuy nhiên, tối hậu thư từ Washington đặt các quốc gia này trước một lựa chọn khó khăn: gắn kết với hệ sinh thái công nghệ phương Tây hay theo đuổi hợp tác đa dạng, bao gồm cả với Trung Quốc. Song song đó, vào tháng 7/2026, Trung Quốc, Nga và 27 nước khác đã thành lập Tổ chức Hợp tác Trí tuệ Nhân tạo Thế giới (WAICO) với trụ sở tại Thượng Hải. WAICO được định vị là một nền tảng liên chính phủ độc lập, thúc đẩy hợp tác toàn cầu về AI. Sự tồn tại của hai cấu trúc song song này làm dấy lên nguy cơ phân mảnh không gian công nghệ toàn cầu, buộc các công ty và quốc gia phải đối mặt với các bộ tiêu chuẩn và yêu cầu khác nhau. Tình hình này đánh dấu sự chuyển dịch từ cạnh tranh thị trường sang đối đầu địa chính trị, nơi công nghệ trở thành công cụ ảnh hưởng chính. Việc các nước châu Âu và các đối tác khác lựa chọn đứng về phía Pax Silica hay WAICO sẽ định hình cấu trúc nền kinh tế số toàn cầu trong nhiều thập kỷ tới. Sự phân cực này có thể dẫn đến việc nghiên cứu và phát triển bị khép kín trong từng khối, làm tăng chi phí và cản trở đổi mới sáng tạo toàn cầu.

cryptonews.ru2 giờ trước

Pax Silica đối đầu WAICO: Mỹ muốn cấm châu Âu sử dụng trí tuệ nhân tạo của Trung Quốc

cryptonews.ru2 giờ trước

Khoản đầu tư của Paul Tudor Jones vào ETF Bitcoin của Blackrock đạt 22,9 triệu USD

Tudor Investment Corp, một quỹ phòng hộ vĩ mô ở Connecticut do Paul Tudor Jones thành lập, đã công bố sở hữu 688.529 cổ phiếu của Quỹ Blackrock iShares Bitcoin Trust (IBIT) trong báo cáo 13F mới nhất. Giá trị của vị thế này tính đến ngày 30/6 là 22,9 triệu USD, tăng 18,9% so với quý trước. Điều này cho thấy xu hướng tăng dần trong việc nắm giữ Bitcoin thông qua ETF của các nhà quản lý tài sản truyền thống, thay vì nắm giữ trực tiếp. Paul Tudor Jones từ lâu đã là người ủng hộ Bitcoin, coi đây là công cụ phòng ngừa lạm phát. Ông công khai nắm giữ Bitcoin và vàng như một phần chiến lược đầu tư, trong khi tránh các tài sản có thu nhập cố định. Từ một vị thế tương lai nhỏ vào năm 2020, khoản đầu tư của ông đã phát triển thành việc nắm giữ trực tiếp và ngày càng tăng thông qua ETF hợp pháp. IBIT của Blackrock vẫn là công cụ ưa thích của các nhà đầu tư tổ chức, chiếm khoảng 49% tổng tài sản của các ETF Bitcoin tại Mỹ. Mặc dù khoản đầu tư 22,9 triệu USD chỉ chiếm phần nhỏ trong danh mục 106 tỷ USD của Tudor, nó đánh dấu sự chuyển hướng rõ ràng của thị trường. Việc tăng dần vị thế qua các quý cho thấy Bitcoin đã trở thành một phần cố định trong danh mục của Jones. Thị trường sẽ tiếp tục theo dõi động thái này qua báo cáo 13F của quý III vào giữa tháng 11.

cryptonews.ru4 giờ trước

Khoản đầu tư của Paul Tudor Jones vào ETF Bitcoin của Blackrock đạt 22,9 triệu USD

cryptonews.ru4 giờ trước

Robert Kiyosaki tiết lộ dự báo của người cố vấn về sự xuất hiện của Bitcoin và AI

Doanh nhân và tác giả người Mỹ Robert Kiyosaki, nổi tiếng với cuốn sách "Rich Dad Poor Dad", đã chia sẻ về ảnh hưởng lớn của nhà tương lai học Richard Buckminster Fuller đối với thế giới quan của ông. Ông liên kết những dự đoán công nghệ từ sớm của Fuller với sự xuất hiện của Bitcoin và sự phát triển của trí tuệ nhân tạo (AI). Kiyosaki mô tả Fuller là một "thiên tài thân thiện", người đã dự đoán nhiều thay đổi mang tính bước ngoặt, trong đó ông đặc biệt nhấn mạnh đến Bitcoin và AI. Bên cạnh những dự báo công nghệ, Kiyosaki còn nhấn mạnh triết lý về mục đích sống mà ông học được từ Fuller: con người thuộc về vũ trụ và mục đích thực sự là cống hiến cuộc đời mình cho lợi ích của người khác. Về lĩnh vực đầu tư, Kiyosaki tiếp tục thể hiện sự ủng hộ mạnh mẽ đối với tiền mã hóa. Ông thường xuyên đề cập đến Bitcoin như một công cụ bảo vệ tài sản trước những bất ổn của hệ thống tài chính truyền thống và cũng coi Ethereum là một tài sản đầu tư hàng đầu. Ông dự đoán một đợt sụp đổ thị trường quy mô lớn vào khoảng năm 2026, xem đây là cơ hội cho các nhà đầu tư am hiểu, và đưa ra dự báo giá lạc quan cho Bitcoin, Ethereum, vàng và bạc sau đó.

cryptonews.ru4 giờ trước

Robert Kiyosaki tiết lộ dự báo của người cố vấn về sự xuất hiện của Bitcoin và AI

cryptonews.ru4 giờ trước

Người sáng lập DeFiLlama rút cạn ví cá nhân để buộc Apple gỡ ứng dụng giả mạo

Người sáng lập ẩn danh của trang phân tích DeFiLlama, 0xngmi, đã phải tự mình tải xuống một ứng dụng giả mạo DeFiLlama từ App Store, nạp một lượng nhỏ tiền điện tử vào ví và để ứng dụng này đánh cắp số tiền đó nhằm cung cấp bằng chứng lừa đảo cho Apple. Chỉ sau vài ngày khi ông báo cáo sự việc, Apple mới gỡ bỏ ứng dụng giả mạo, dù nhóm DeFiLlama đã khiếu nại về vi phạm thương hiệu và mạo danh trong nhiều tháng trước đó mà không nhận được phản hồi. 0xngmi chia sẻ rằng ứng dụng giả chỉ là một bản sao đơn giản, được tạo ra để đánh cắp cụm từ khôi phục ví (seed phrase) của người dùng. Những kẻ lừa đảo này đã vượt qua quy trình xác minh của Apple bằng cách sử dụng thông tin của một doanh nghiệp nhỏ đã ngừng hoạt động. Do lo ngại về an toàn cho người dùng, nhóm DeFiLlama đã quyết định hoãn việc ra mắt ứng dụng chính thức cho đến khi tất cả các phiên bản giả mạo bị loại bỏ. Sự việc này nêu bật vấn đề phổ biến trên các cửa hàng ứng dụng và nền tảng quảng cáo, khi nhiều dự án tiền điện tử khác như Hyperliquid và Uniswap cũng từng là nạn nhân của các chiến dịch lừa đảo tương tự, gây thiệt hại tài chính đáng kể.

cryptonews.ru4 giờ trước

Người sáng lập DeFiLlama rút cạn ví cá nhân để buộc Apple gỡ ứng dụng giả mạo

cryptonews.ru4 giờ trước

Giao dịch

Giao ngay

Bài viết Nổi bật

Làm thế nào để Mua SAMSUNGEM

Chào mừng bạn đến với HTX.com! Chúng tôi đã làm cho mua Samsung Electro-Mechanics (SAMSUNGEM) trở nên đơn giản và thuận tiện. Làm theo hướng dẫn từng bước của chúng tôi để bắt đầu hành trình tiền kỹ thuật số của bạn.Bước 1: Tạo Tài khoản HTX của BạnSử dụng email hoặc số điện thoại của bạn để đăng ký tài khoản miễn phí trên HTX. Trải nghiệm hành trình đăng ký không rắc rối và mở khóa tất cả tính năng. Nhận Tài khoản của tôiBước 2: Truy cập Mua Crypto và Chọn Phương thức Thanh toán của BạnThẻ Tín dụng/Ghi nợ: Sử dụng Visa hoặc Mastercard của bạn để mua Samsung Electro-Mechanics (SAMSUNGEM) ngay lập tức.Số dư: Sử dụng tiền từ số dư tài khoản HTX của bạn để giao dịch liền mạch.Bên thứ ba: Chúng tôi đã thêm những phương thức thanh toán phổ biến như Google Pay và Apple Pay để nâng cao sự tiện lợi.P2P: Giao dịch trực tiếp với người dùng khác trên HTX.Thị trường mua bán phi tập trung (OTC): Chúng tôi cung cấp những dịch vụ được thiết kế riêng và tỷ giá hối đoái cạnh tranh cho nhà giao dịch.Bước 3: Lưu trữ Samsung Electro-Mechanics (SAMSUNGEM) của BạnSau khi mua Samsung Electro-Mechanics (SAMSUNGEM), lưu trữ trong tài khoản HTX của bạn. Ngoài ra, bạn có thể gửi đi nơi khác qua chuyển khoản blockchain hoặc sử dụng để giao dịch những tiền kỹ thuật số khác.Bước 4: Giao dịch Samsung Electro-Mechanics (SAMSUNGEM)Giao dịch Samsung Electro-Mechanics (SAMSUNGEM) dễ dàng trên thị trường giao ngay của HTX. Chỉ cần truy cập vào tài khoản của bạn, chọn cặp giao dịch, thực hiện giao dịch và theo dõi trong thời gian thực. Chúng tôi cung cấp trải nghiệm thân thiện với người dùng cho cả người mới bắt đầu và người giao dịch dày dạn kinh nghiệm.

Tổng lượt xem 61Xuất bản vào 2026.08.14Cập nhật vào 2026.08.14

Làm thế nào để Mua SAMSUNGEM

LGELECTRONICS là gì

Tài sản cơ sở của hợp đồng là LG Electronics Inc. LG Electronics Inc là một công ty điện tử toàn cầu có trụ sở tại Hàn Quốc, hoạt động trong lĩnh vực điện tử tiêu dùng, thiết bị gia dụng và linh kiện xe hơi.

Tổng lượt xem 54Xuất bản vào 2026.08.14Cập nhật vào 2026.08.14

LGELECTRONICS là gì

Làm thế nào để Mua LGELECTRONICS

Chào mừng bạn đến với HTX.com! Chúng tôi đã làm cho mua LG Electronics (LGELECTRONICS) trở nên đơn giản và thuận tiện. Làm theo hướng dẫn từng bước của chúng tôi để bắt đầu hành trình tiền kỹ thuật số của bạn.Bước 1: Tạo Tài khoản HTX của BạnSử dụng email hoặc số điện thoại của bạn để đăng ký tài khoản miễn phí trên HTX. Trải nghiệm hành trình đăng ký không rắc rối và mở khóa tất cả tính năng. Nhận Tài khoản của tôiBước 2: Truy cập Mua Crypto và Chọn Phương thức Thanh toán của BạnThẻ Tín dụng/Ghi nợ: Sử dụng Visa hoặc Mastercard của bạn để mua LG Electronics (LGELECTRONICS) ngay lập tức.Số dư: Sử dụng tiền từ số dư tài khoản HTX của bạn để giao dịch liền mạch.Bên thứ ba: Chúng tôi đã thêm những phương thức thanh toán phổ biến như Google Pay và Apple Pay để nâng cao sự tiện lợi.P2P: Giao dịch trực tiếp với người dùng khác trên HTX.Thị trường mua bán phi tập trung (OTC): Chúng tôi cung cấp những dịch vụ được thiết kế riêng và tỷ giá hối đoái cạnh tranh cho nhà giao dịch.Bước 3: Lưu trữ LG Electronics (LGELECTRONICS) của BạnSau khi mua LG Electronics (LGELECTRONICS), lưu trữ trong tài khoản HTX của bạn. Ngoài ra, bạn có thể gửi đi nơi khác qua chuyển khoản blockchain hoặc sử dụng để giao dịch những tiền kỹ thuật số khác.Bước 4: Giao dịch LG Electronics (LGELECTRONICS)Giao dịch LG Electronics (LGELECTRONICS) dễ dàng trên thị trường giao ngay của HTX. Chỉ cần truy cập vào tài khoản của bạn, chọn cặp giao dịch, thực hiện giao dịch và theo dõi trong thời gian thực. Chúng tôi cung cấp trải nghiệm thân thiện với người dùng cho cả người mới bắt đầu và người giao dịch dày dạn kinh nghiệm.

Tổng lượt xem 57Xuất bản vào 2026.08.14Cập nhật vào 2026.08.14

Làm thế nào để Mua LGELECTRONICS

Thảo luận

Chào mừng đến với Cộng đồng HTX. Tại đây, bạn có thể được thông báo về những phát triển nền tảng mới nhất và có quyền truy cập vào thông tin chuyên sâu về thị trường. Ý kiến ​​của người dùng về giá của A (A) được trình bày dưới đây.

活动图片