At Glassnode, we monitor blockchain activity through hundreds of on-chain metrics, many of which are employed as features in machine learning models for trading. A key challenge arises from the vast feature space: each metric can be transformed via countless indicators and combined in virtually infinite ways. In this case study, we introduce a bottom-up feature discovery framework designed to systematically navigate this complexity and identify potentially non-trivial, high-value indicator combinations.
Executive Summary
- We present a structured bottom-up methodology for exploring the combinatorial space of on-chain trading indicators, demonstrating an alternative to manual top-down feature engineering.
- Applied to a specific case study of Bitcoin uptrend detection using only 2-feature models, the exploration revealed unexpected patterns: optimal context windows of 800-1,200 days rather than conventional shorter periods.
- The top-performing metric combinations included realized market cap and user retention metrics, though these represent just the surface of potential indicators.
- This analysis serves as a starting point for practitioners, demonstrating how structured exploration can complement traditional approaches.
The Combinatorial Challenge
To understand why structured exploration matters, consider the scale of the challenge facing analysts today. Modern financial markets generate data at an enormous scale. The cryptocurrency ecosystem presents a particularly rich example: Blockchains settle billions of transactions every day with an unprecedented transparency. Glassnode tracks hundreds of fundamental indicators across different assets, timeframes, and network segments. Each metric can be transformed using dozens of technical indicators, each with their own parameter ranges. When combined into multi-feature models, the number of possible configurations quickly explodes into an intractable search space, known as the "curse of dimensionality." This makes exhaustive exploration impossible.
Top-down vs. Bottom-up Feature Engineering
Traditional top-down feature engineering relies on domain experts who select metrics based on economic theory, market understanding, and historical precedent. Features are chosen for interpretability and theoretical soundness, efficiently leveraging expertise but naturally focusing on theoretically motivated combinations.
In contrast, bottom-up exploration samples the feature space without predetermined preferences, potentially uncovering patterns intuition might miss. Rather than starting with hypotheses about which metrics should work, this approach lets the data reveal unexpected combinations.
Systematic Discovery Methodology
Given this computational impossibility, we need a structured approach that can sample a representative subset of the feature space while maintaining statistical rigor. Our approach probes this universe through rigorous exploration and evaluation.
We generate feature combinations by sampling from the full space of available metrics, transformations, and parameter ranges, ensuring broad coverage and preventing bias from limiting the search to familiar patterns. Each combination is evaluated using simple, low-complexity machine learning models (decision trees with limited depth) to identify genuine patterns rather than overfitted noise, keeping the focus on discovering robust indicators more likely to generalize beyond the training data.
Every feature combination undergoes testing across multiple time-based folds, with performance consistency across folds being as important as overall performance, helping identify features that work reliably across different market conditions. The generated dataset of features and their respective performances enables post-hoc analysis to understand not just which combinations perform well, but under what circumstances.
Case Study Setup: Bitcoin Trend Detection
To demonstrate this methodology in practice, we apply it to a specific and market-relevant objective: Bitcoin uptrend detection. Our implementation employs a three-phase sampling strategy to methodically explore the feature space for uptrend identification. This way, we balance computational feasibility with comprehensive coverage of potential indicator combinations.
Investment Objective and Labels
The focus lies on identifying optimal periods for Bitcoin long exposure during uptrending market phases. Our labeling employs hierarchical trend segmentation that recursively identifies trend cycles by detecting local peaks and preceding troughs. This captures what practitioners might call "mini bull runs" - periods of sustained upward momentum within larger market cycles.
The algorithm applies minimum duration thresholds to filter noise, resulting in binary classification where Label 1 indicates uptrending periods and Label 0 marks downtrending or sideways markets. That means, in periods of "Label 1" we want to be in the market, whereas during "Label 0" time ranges the model should predict to be "out of the market." Note that this specific labeling choice fundamentally shapes all downstream results, different objectives would yield different findings.
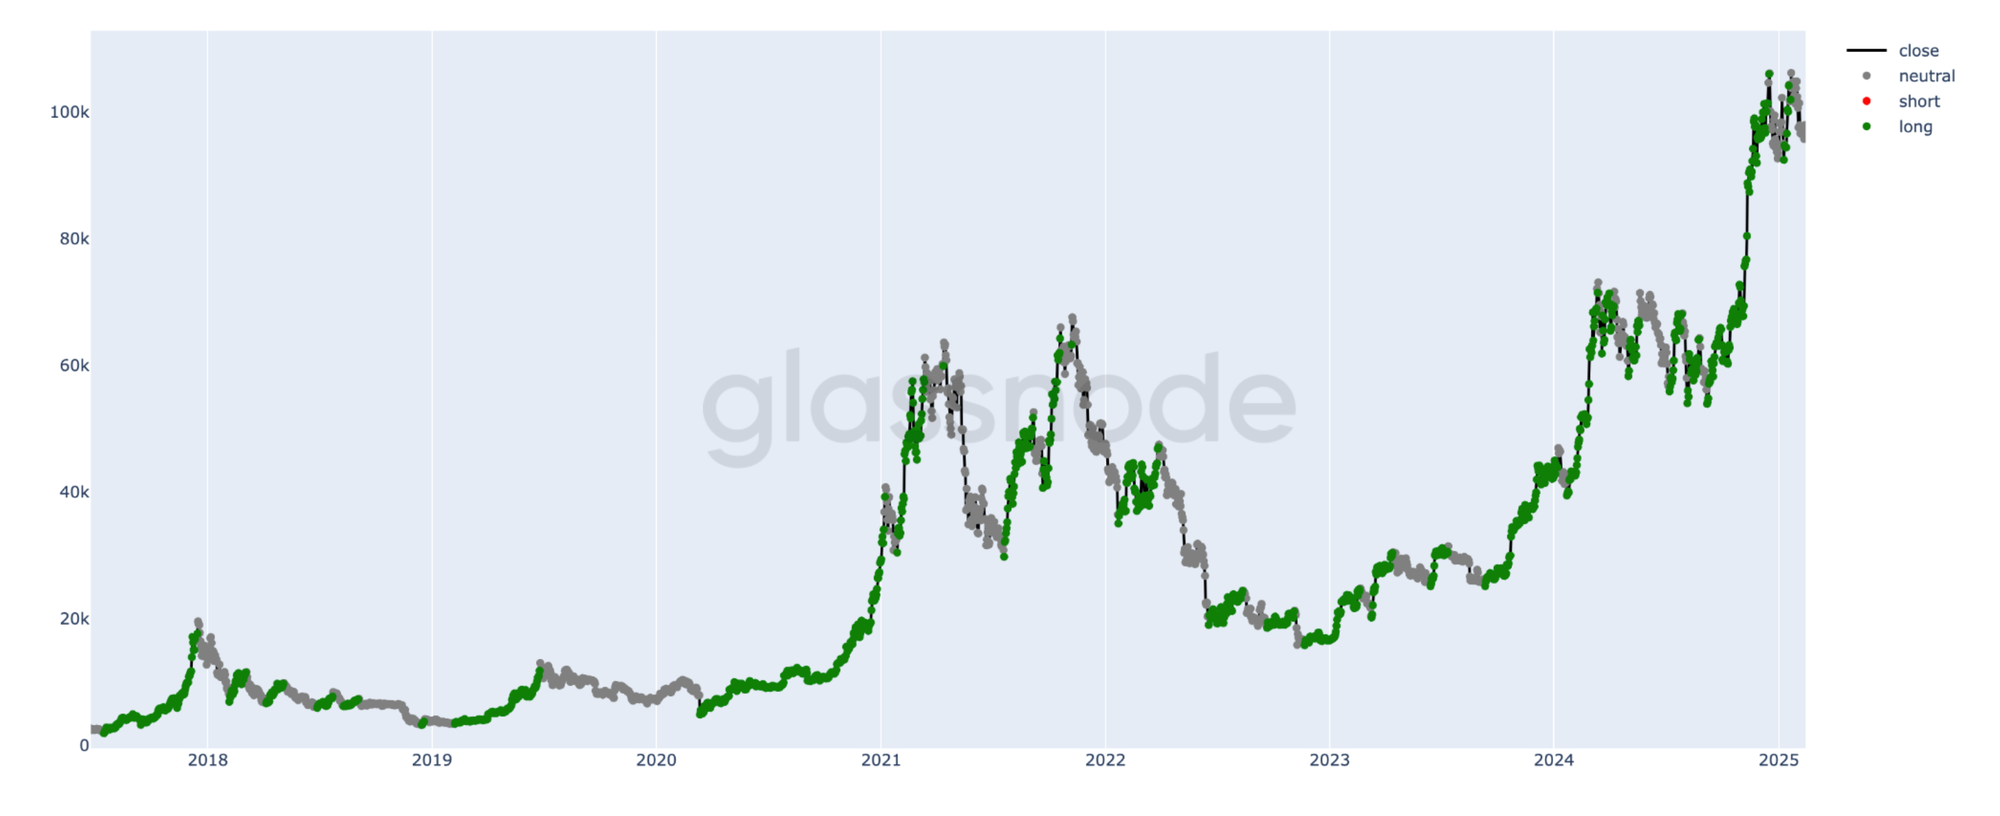
Figure 1: Hierarchical trend segmentation applied to Bitcoin. Green indicates uptrending periods (Label 1), gray shows downtrending/sideways markets (Label 0).
Evaluation Framework
Having established our trend definition framework, we need an evaluation approach that increases the chance of findings that generalize. We employ time-based cross-validation simulating different market structures by training on all data up to each test year, with individual years (2017-2025) serving as test folds. Feature selection is based on the 2017-2023 period, while 2024-2025 is reserved for out-of-sample validation.
Performance is measured using net returns after transaction costs, relative to a buy-and-hold strategy. This metric is chosen for illustration purposes - the algorithmic approach can equally optimize for risk-adjusted measures like Sharpe or Sortino ratios, classical ML metrics such as accuracy or F-beta scores, or implementation-focused criteria like signal frequency and drawdown characteristics. Alternative optimization targets will surface different optimal feature combinations, and the choice of the performance indicator fundamentally shapes which relationships the exploration discovers.
Feature Space Configuration
With our evaluation framework defined, we face the practical challenge of making our vast search space computationally tractable. For interpretability, we configure a constrained search space using 1,600 Bitcoin metrics (including sub-traces), limiting transformations to Z-Score and RSI only, allowing context windows up to 1,536 days, and restricting models to exactly 2 features. Even with these constraints, the theoretical search space reaches:
(1,600 metrics × 2 transformations × 1,536 context windows)² = 24 trillion combinations
This computational challenge necessitates methodical dimensionality reduction. We achieve this using a three-phase approach, as described below.
Three-Phase Exploration Process
Phase 1: Single-Feature Screening
We evaluate 153,600 single-feature combinations, sampling across metrics, transformations, and context windows. Rather than seeking definitive winners, we look for metrics that show potential.
Top 10 Individual Metrics:
- MVRV by Age: 1 month to 3 months
- MoM Activity Retention Supply: churned supply
- Market Cap by Profit and Loss: -10% to 0%
- Realized Cap by Profit and Loss: -10% to 0%
- SOPR by Age: 1 month to 3 months
- Realized Cap by Wallet Size: above 100k
- Spent Volume in Loss by Age: 1 month to 3 months
- Cost Basis Distribution Quantiles: 91%
- Supply Held by Entities with Balance: above 100k
- Short Term Holder NUPL: less than 155 days
These metrics span valuation ratios, holder behavior, and profit/loss distributions - a diverse and reasonable set that evaluation identified without any preselection.
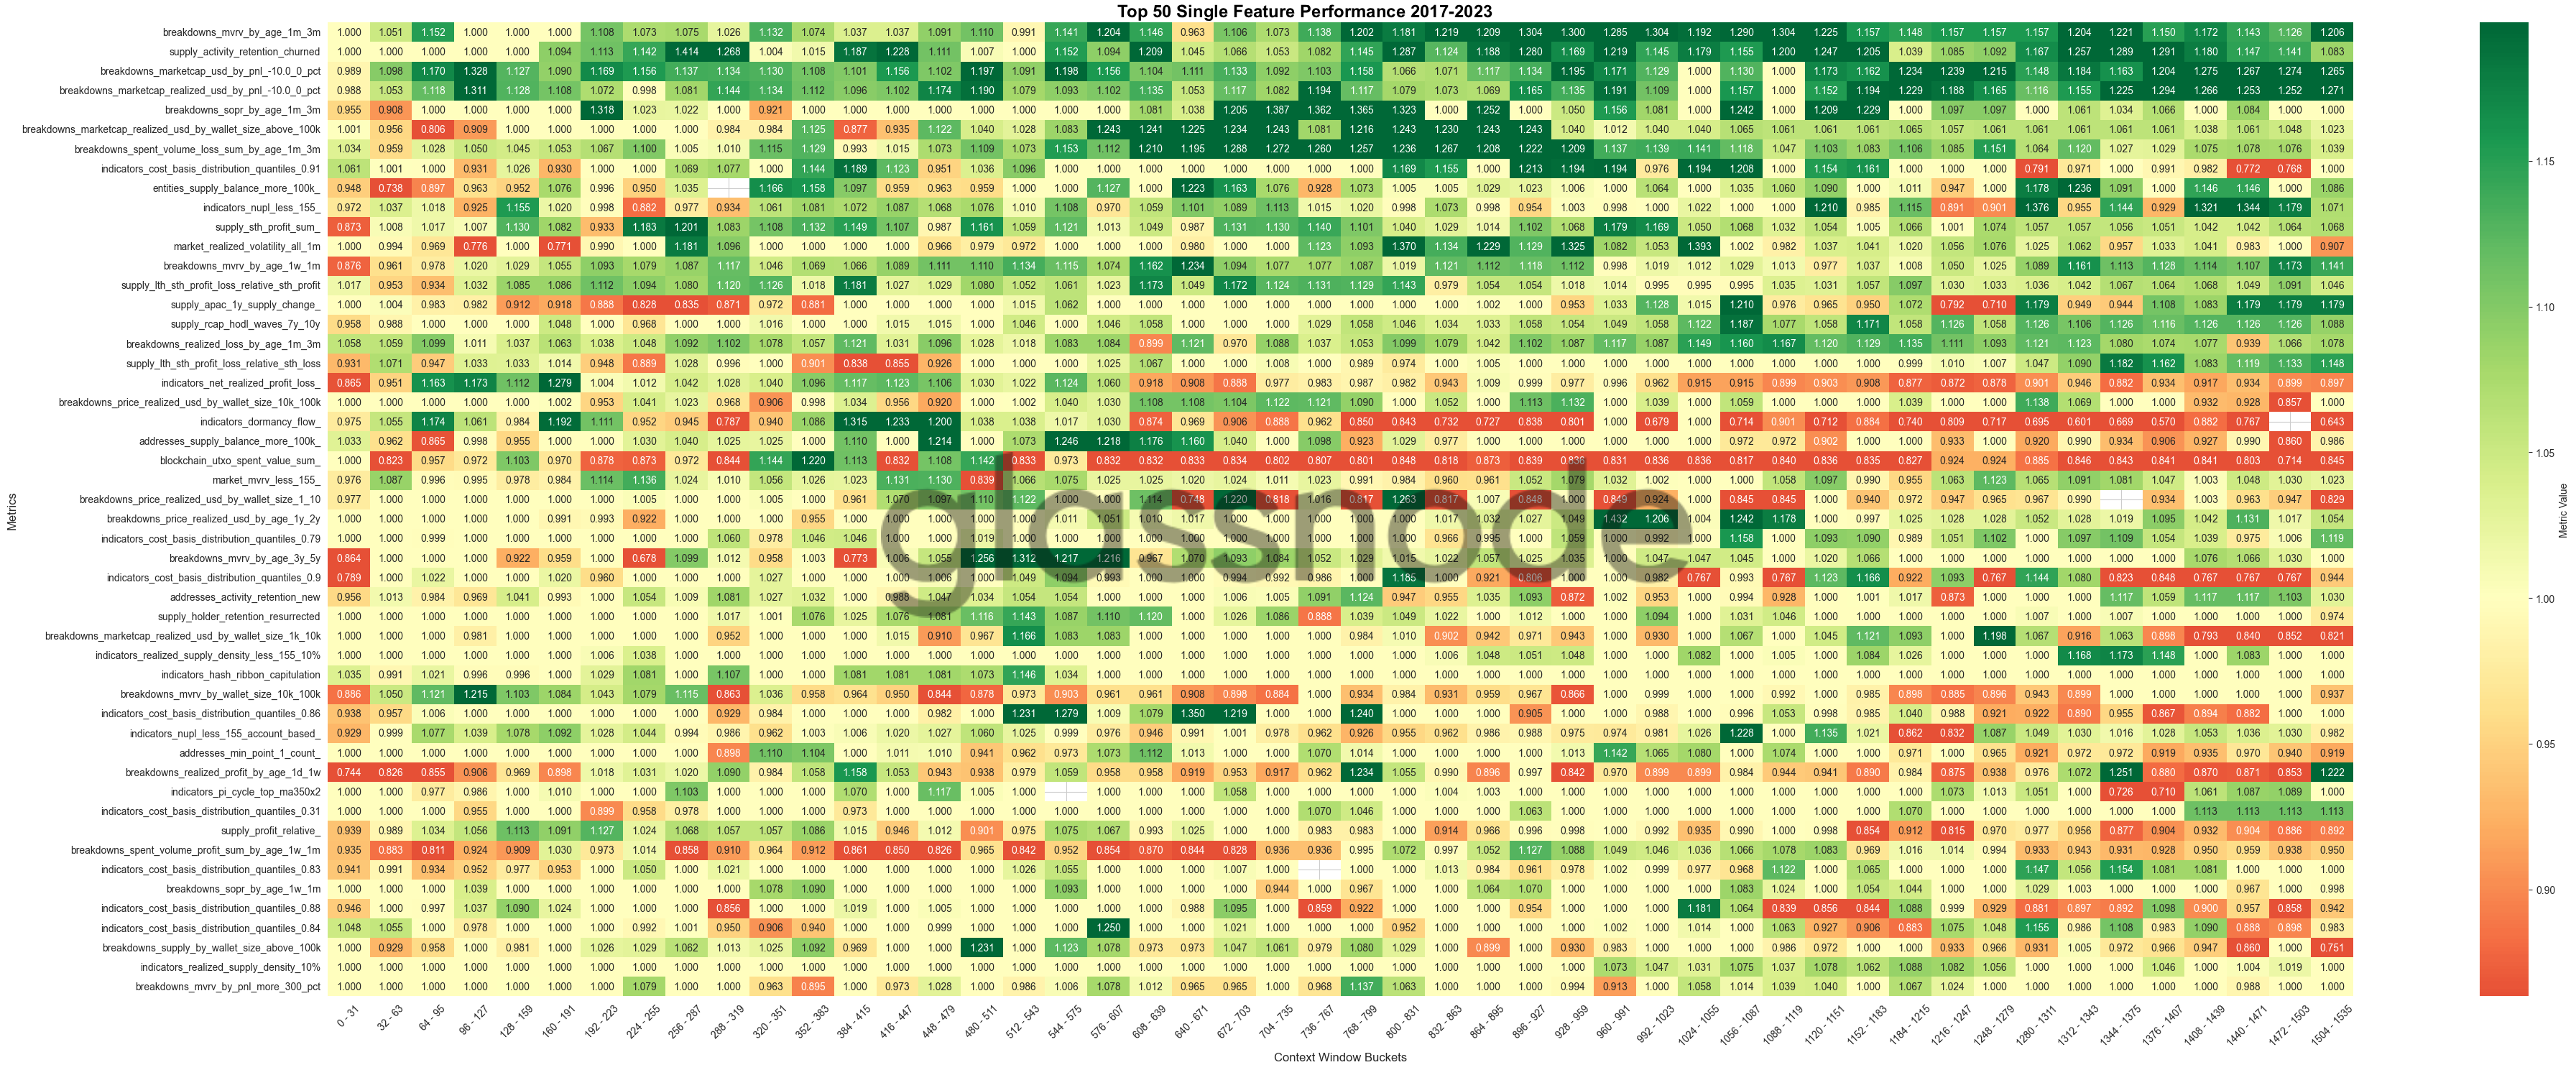
Figure 2: Performance heatmap of top 50 single features. Rows show metrics, columns represent context window buckets (0-1,535 days). Color intensity indicates median annual performance for 2017-2023.
Results for this first phase are shown in Fig. 2. For example, the metric "MVRV by Age: 1 month to 3 months" in combination with a context window of 64-95 days resulted in an average performance of 1.152 relative to a simple Buy-and-Hold strategy. Note though, that these findings constitute only the first step in our process and by themselves are most likely not related to any robust trading signals.
Phase 2: Metric Pair Discovery
Extending this analysis, we use the top 50 metrics from Phase 1 to sample 100,000 evaluations from approximately 23 million possible combinations. The goal is identifying potentially synergistic pairs, not definitive optimization.
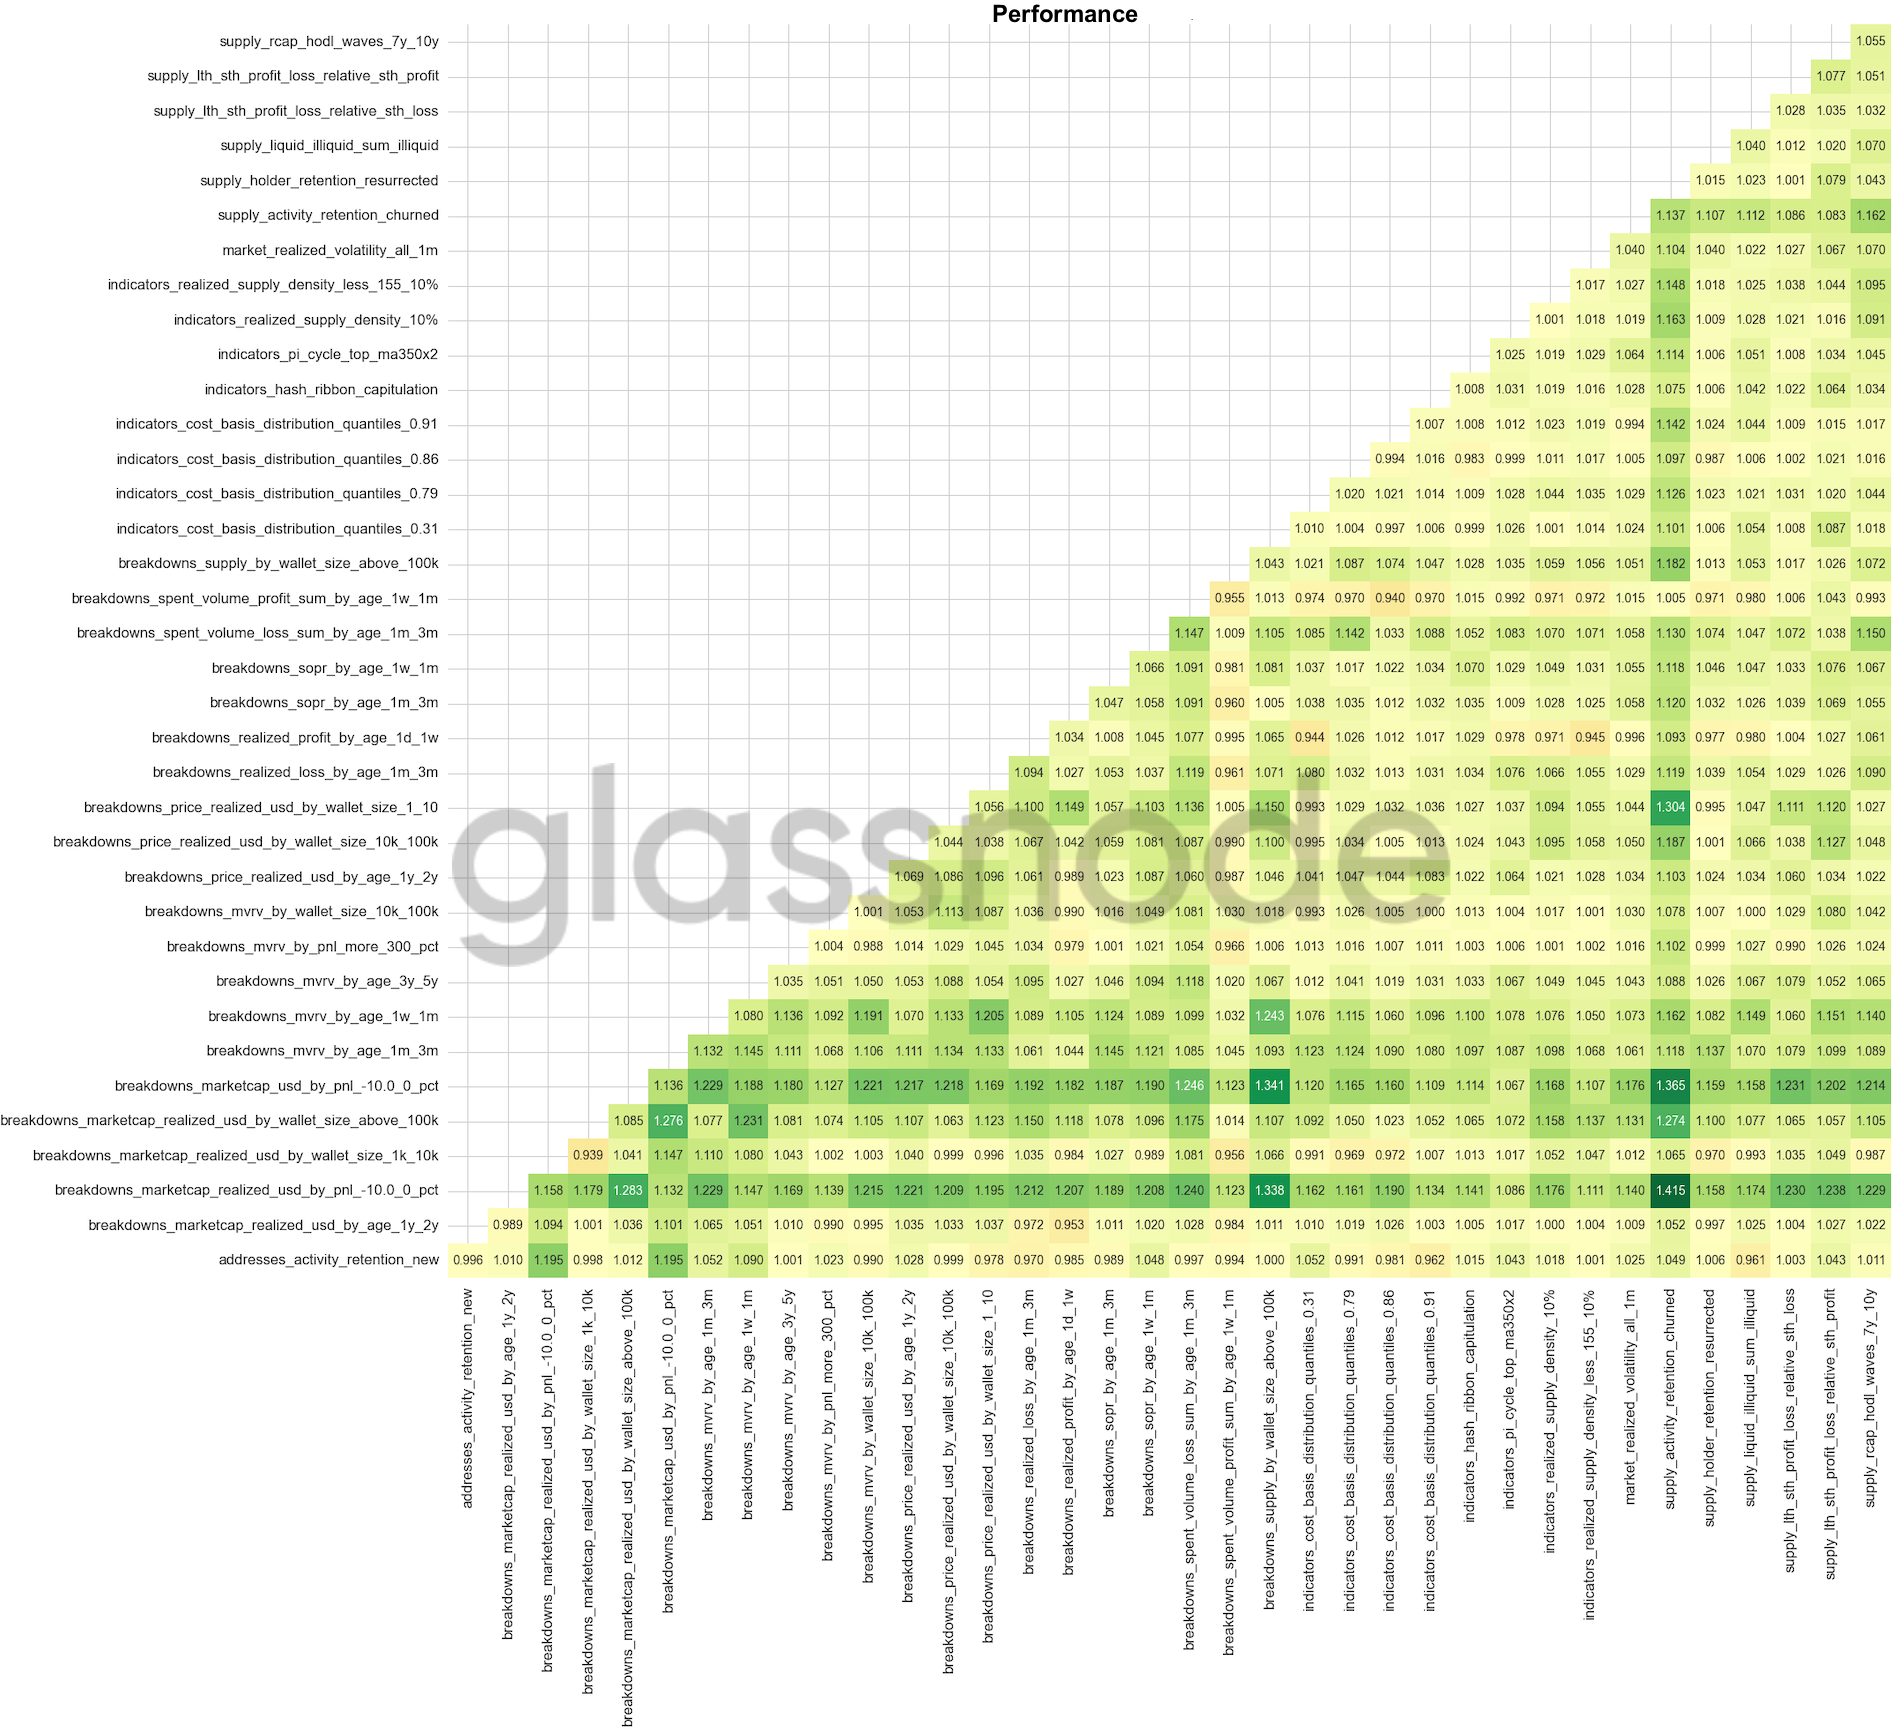
Figure 3: Pairwise performance matrix for top 50 metrics. Cell color indicates combination performance.
Initial findings suggest certain combinations warrant deeper investigation:
- Realized Cap metrics show consistent effectiveness
- Activity Retention metrics appear complementary to valuation indicators
- Some pairs exhibit stronger combined results than individual components
Phase 3: Parameter Optimization
While Phase 2 reveals compelling metric combinations, we have yet to optimize their historical context windows. For the most notable metric pairs, Realized Cap and Activity Retention, identified in our pairwise analysis, we conduct focused parameter searches across context windows. What timeframe would you expect optimal for Bitcoin trend detection - days, weeks, months?
Simulation results are summarized in Fig. 5. Interestingly, an unexpected relationship emerges: optimal windows range from 800-1,200 days, substantially longer than conventional technical analysis periods.
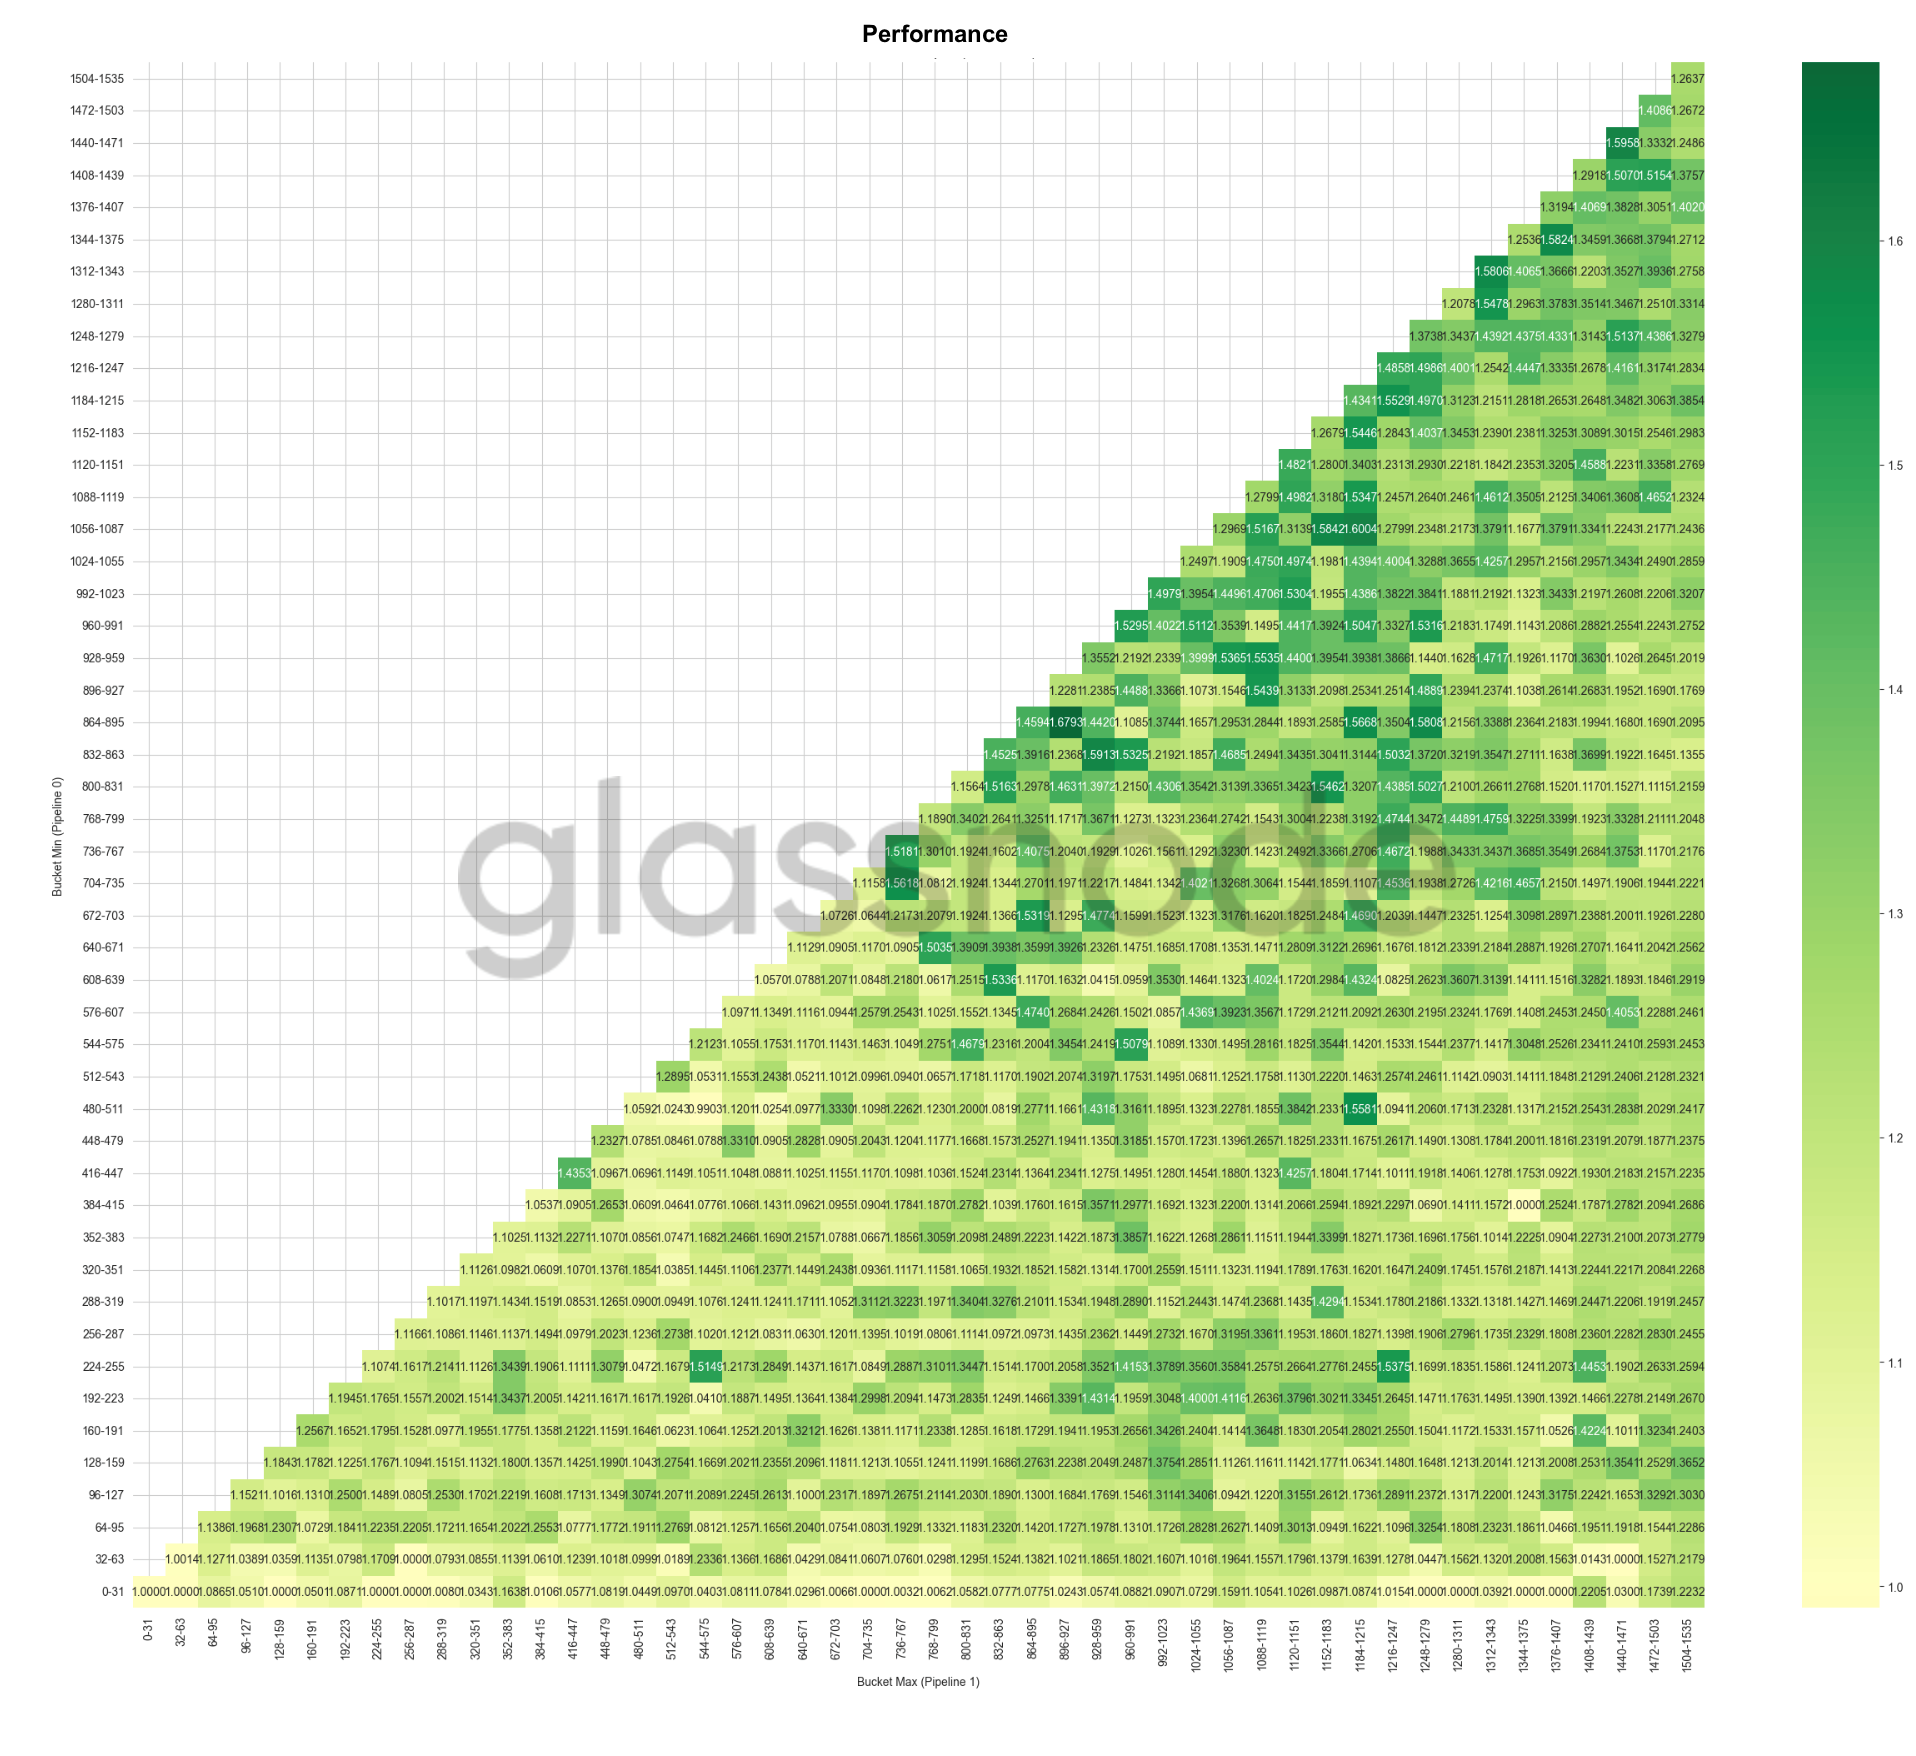
Figure 5: Context window optimization showing performance across different window combinations for selected metric pairs.
Our findings demand explanation, as they contradict conventional wisdom in technical analysis. While Bitcoin's heartbeat often guides the way, we discovered Bitcoin's slow breathing patterns over 3+ years seem to map the real path for this objective. One key factor is our label construction: the hierarchical trend segmentation identifies uptrend segments that typically span multiple weeks or months. Longer context windows may better capture the gradual build-up and establishment of these extended trend periods, while shorter windows might react to noise within the broader trend structure. The 800-1,200 day windows could be detecting the slower-moving underlying conditions that precede and sustain the extensive uptrend phases.
However, we emphasize these are observations from a limited case study specific to our labeling methodology. Modified label definitions targeting shorter-term movements will favor different context windows.
Temporal Performance Analysis
Our exploration revealed compelling combinations, but a crucial question remains: how stable are these relationships over time? To address this, we examine how different feature architectures behave across time periods. We categorize combinations by their metric types:
- Realized Cap × Realized Cap: Both metrics based on on-chain cost basis
- Activity × Realized Cap: Mixed behavioral and valuation indicators
- Activity × Activity: Both metrics based on user behavior patterns
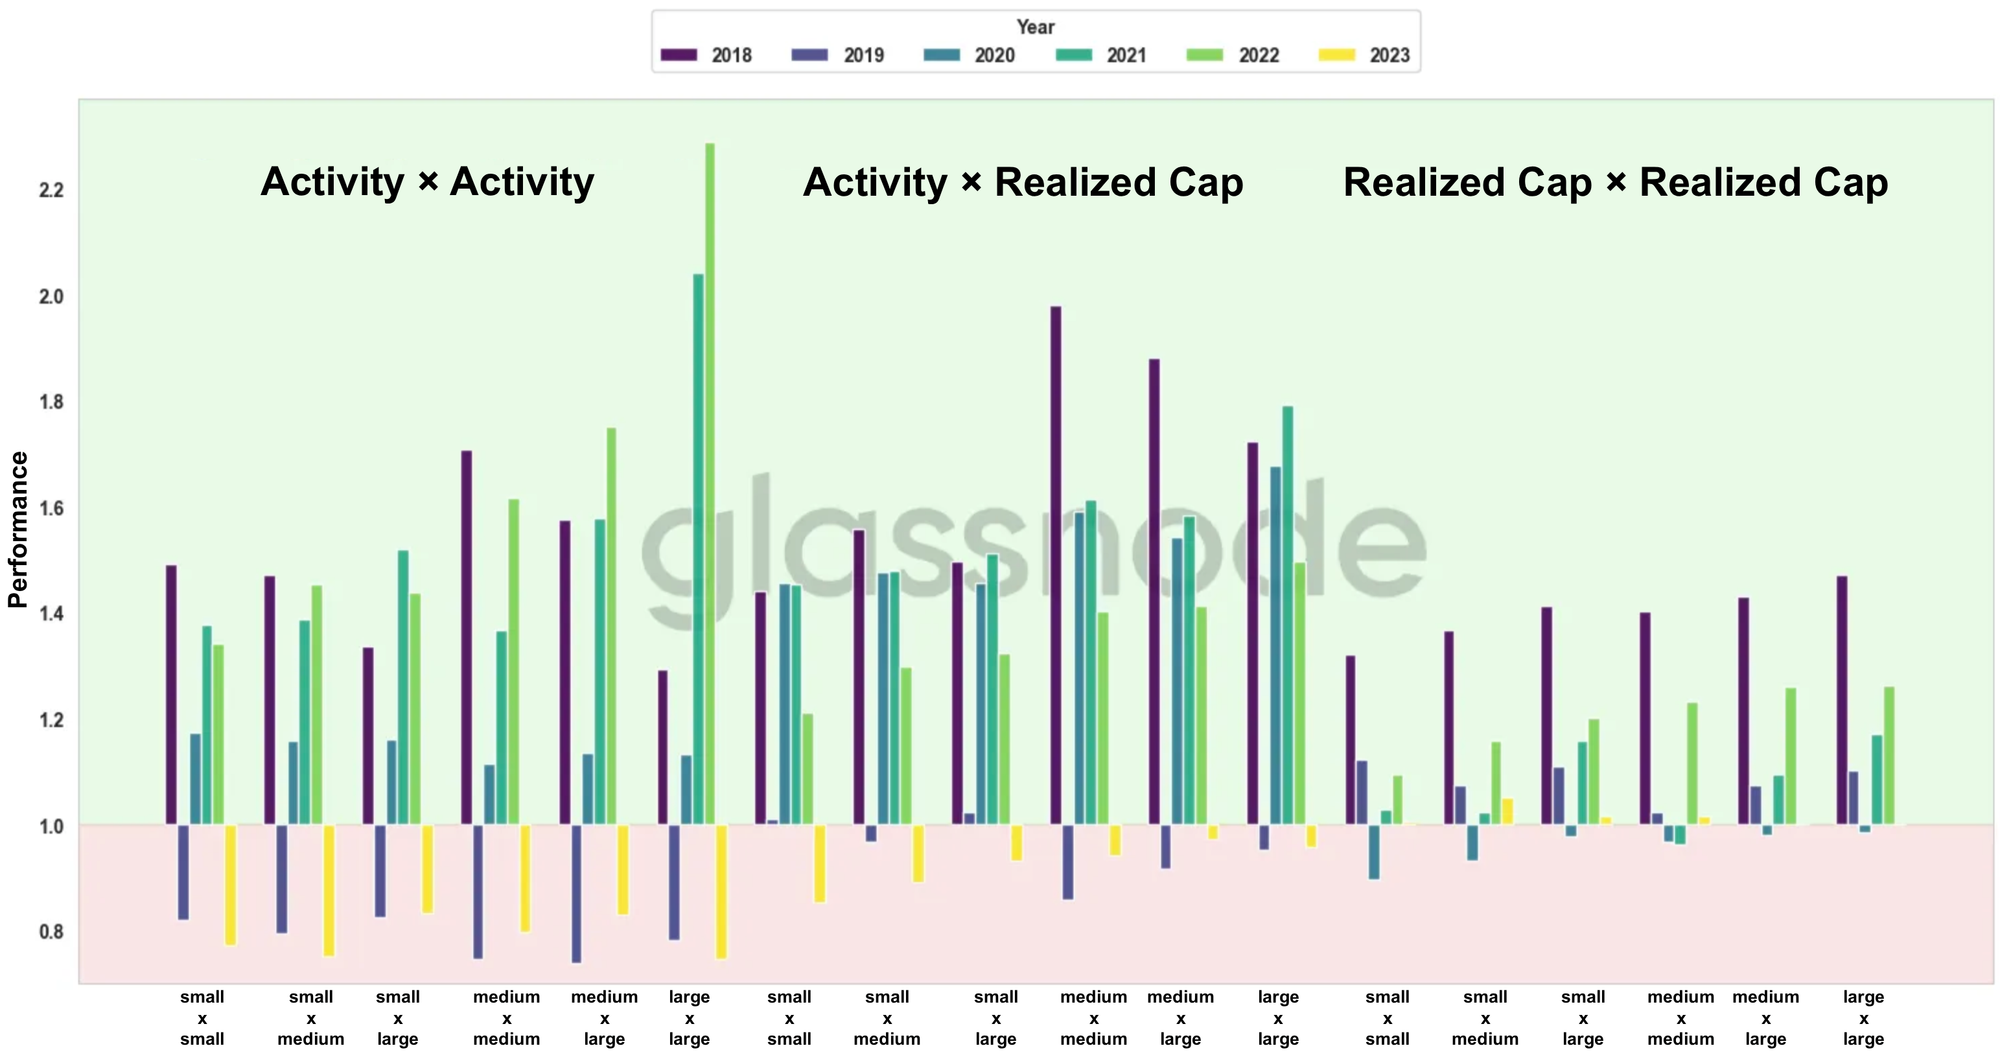
Figure 10: Architecture performance trajectories across test years (2018-2023). Each cluster on the x-axis represents a unique combination of metric pair and context window bucket, with bars showing annual performance.
Key observations from the in-sample period:
- Realized cap combinations show lower variance but moderate returns
- Mixed architectures balance consistency with effectiveness
- Activity-only pairs exhibit high variance with period-specific outcomes
Importantly, all architectures show declining results over time during 2017-2023, suggesting increasing market efficiency or changing market dynamics.
Out-of-Sample Results: A Reality Check
While live trading remains the ultimate test, evaluating algorithmic discoveries on previously excluded data provides insight into potential real-world effectiveness. The 2024-2025 validation period provides this crucial perspective on our findings:
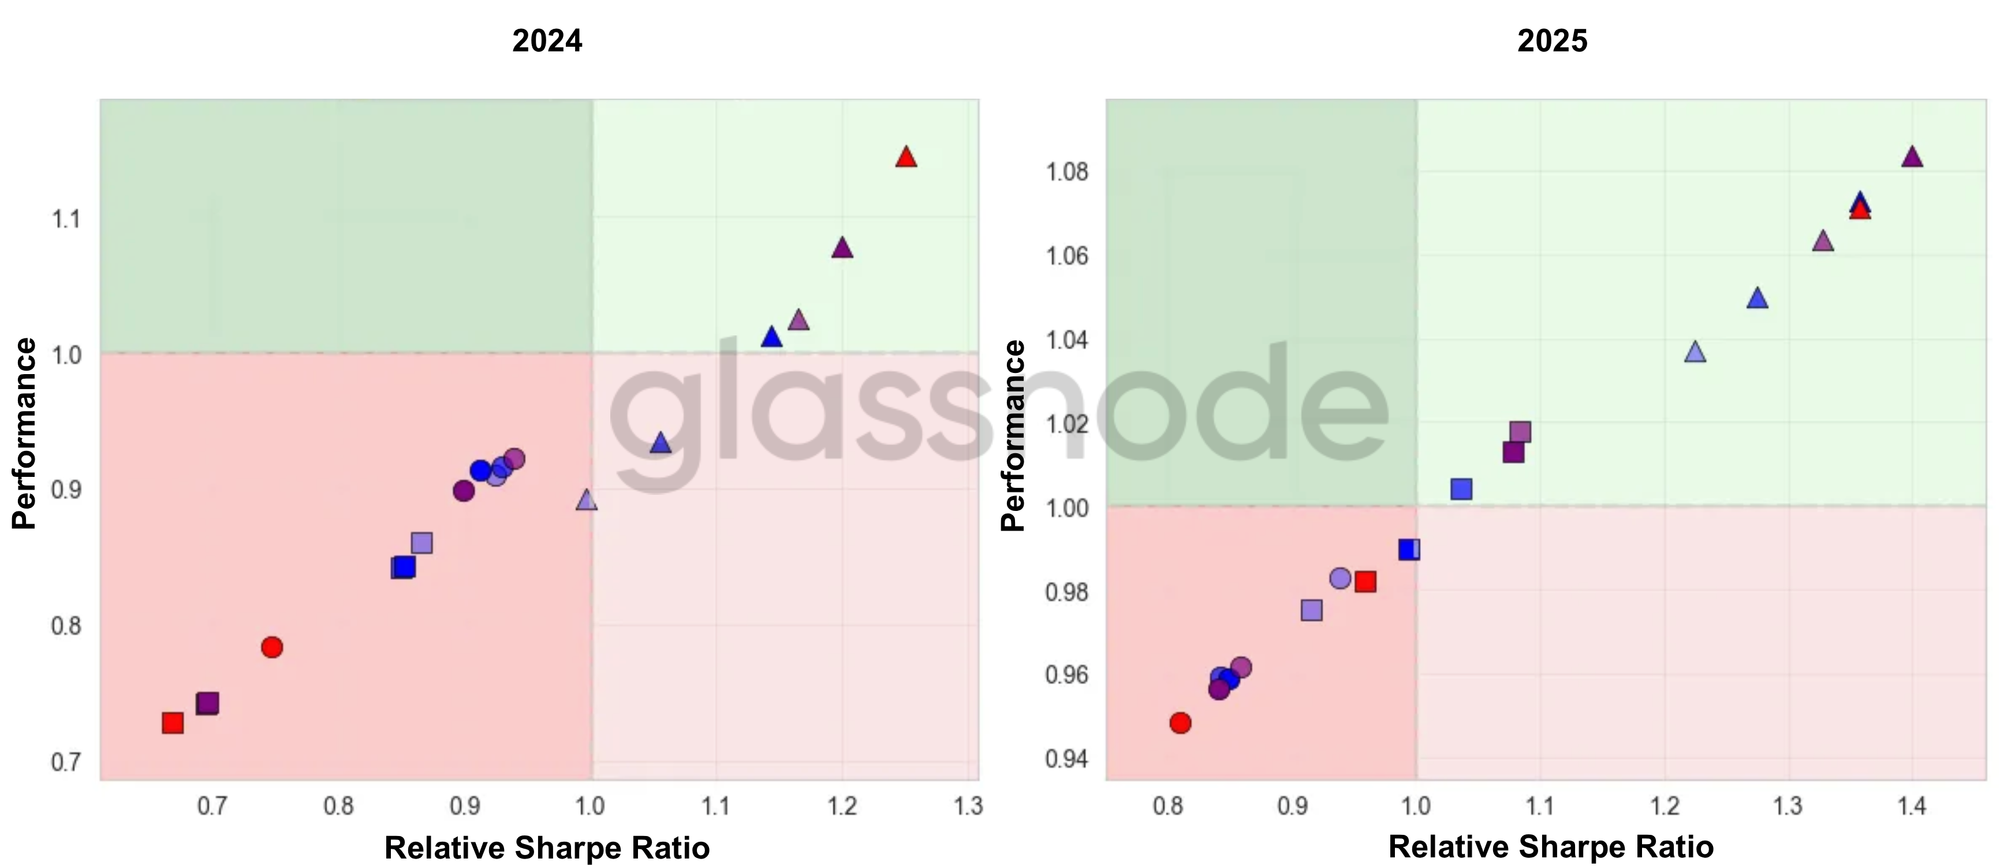
Figure 7: Out-of-sample performance (2024-2025). Same architecture categories as training period.
The out-of-sample period reveals several phenomena: some previously strong performers like pure activity retention blends show reduced effectiveness while certain realized cap combinations maintain consistent results. These shifts in outcomes raise fundamental questions about market evolution. Why do effectiveness characteristics change? Multiple explanations are possible, such as genuine changes in ecosystem structure or participant behavior, the impact of new market infrastructure such as ETFs and increased institutional adoption, or something else entirely.
These results underscore that structured exploration is a starting point for investigation, not an endpoint for trading system development.
Practical Implications and Limitations
What This Analysis Shows
Our structured exploration reveals non-obvious relationships that wouldn't emerge from traditional analysis, particularly the preference for long context windows of 800-1,200 days. Even with our constrained search using only 2 features from a limited set of metrics, we uncover behaviors worth investigating further, demonstrating that valuable insights can emerge from structured sampling even with strict limitations. The approach shows how bottom-up exploration and top-down feature engineering can complement each other, with computational discovery informing where to focus domain expertise. Most importantly, this framework represents a scalable methodology that can be applied to different investment objectives, various assets, and alternative constraints, providing practitioners with a tool for exploring their specific use cases.
What This Analysis Doesn't Show
However, acknowledging these capabilities requires equal attention to constraints. The analysis does not present a complete trading strategy - two features using simple decision trees cannot capture the full complexity of cryptocurrency markets. The results are specific to our particular choice of labels, metrics, and time period, and should not be interpreted as universal truths about market behavior. Since we sampled only a tiny fraction of even our constrained feature space, optimal solutions or the best possible features remain elusive. Furthermore, this is fundamentally a historical analysis where past relationships offer no guarantee of future effectiveness, reinforcing the need for continuous validation rather than static implementation.
Future Research Directions
These constraints point toward several compelling avenues for future work. With thousands of available individual traces and unlimited transformation possibilities, the vast unexplored configuration space holds substantial potential for discovering valuable indicators. The methodology can be scaled to different prediction targets such as volatility forecasting, drawdown risk assessment, and regime change detection, as well as alternative time horizons including intraday, weekly, and monthly analysis periods. Multi-asset combinations across different cryptocurrencies can help identify universal versus asset-specific behaviors, providing deeper insights into crypto markets generally. Additionally, exploring more complex feature interactions beyond simple pairs is essential for building robust predictive models, since more diverse inputs provide both, enhanced individual predictive indicators and allow to capture interactions between features that single metrics cannot reveal.
The tooling we developed enables us to explore different hypotheses with relatively low effort, opening possibilities for customized research tailored to specific objectives and constraints.
Conclusion
The empirical findings, while specific to our case study, illuminate broader questions about computational discovery in financial markets and point toward both immediate applications and future research directions. Our work demonstrates how structured bottom-up exploration can complement traditional top-down approaches, for instance, by revealing the unexpected effectiveness of extended context windows. While our analysis only scratched the surface of endless possible combinations, it illustrates a methodology that practitioners can adapt to their specific needs.
The out-of-sample results serve as a crucial reminder: cryptocurrency markets remain challenging environments requiring not just discovery but ongoing adaptation. For Glassnode clients and algorithmic traders, this framework offers a starting point where the methodology itself - unbiased by preconceptions - helps navigate the significant complexity of blockchain data.
As cryptocurrency markets evolve, so must analytical approaches. Computational exploration doesn't replace expertise but augments it, helping uncover relationships hidden in plain sight.
- Follow us on X for timely market updates and analysis
- Join our Telegram channel for regular market insights
- For on-chain metrics, dashboards, and alerts, visit Glassnode Studio
Disclaimer: This report is for informational and educational purposes only. The analysis represents a limited case study with significant constraints and should not be interpreted as investment advice or definitive trading signals. Past performance patterns do not guarantee future results. Always conduct thorough due diligence and consider multiple factors before making investment decisions.