# Пов'язані статті щодо S&P 500

Центр новин HTX надає останні статті та поглиблений аналіз на тему "S&P 500", що охоплює ринкові тренди, оновлення проєктів, технологічні розробки та регуляторну політику в криптоіндустрії.


War Trade Unwinding | TradeXYZ Weekend Observations

Weekend markets saw a clear return of risk appetite. Major indices rose broadly, with significant gains in tech and precious metals, while energy sectors fell sharply on the "end of war" narrative. On June 14, oil prices initially rose on reports Iran had not yet finalized a memorandum of understanding. Later, YNET reported Trump might immediately lift the maritime blockade on Iran and the Strait of Hormuz. At 21:30, Trump confirmed on Truth Terminal that a deal with Iran was done, authorizing an immediate end to the US blockade and toll-free opening of the Strait. Iran's deputy foreign minister simultaneously announced an immediate and permanent halt to military actions on multiple fronts. Oil prices had already fallen to weekend boundaries, pre-pricing the news. The S&P 500 subsequently touched 7530. Markets will likely remain in a waiting period until the formal peace deal signing on June 19. At the moment of the deal announcement, gold jumped from ~4,221 to a high of 4,337, and silver from ~67.85 to 70.83, before stabilizing at higher levels. Individual stocks and ETFs like NBIS, RKLB, and LITE performed strongly. NBIS, added to the Nasdaq index, saw a target price increase due to strong AI cloud growth. RKLB, also added to the index, benefited from positive SpaceX valuation sentiment. LITE received a $1,130 target from JPMorgan. SPCX rose quickly after Musk tweeted SpaceX could potentially reach ~$1 trillion in revenue by 2030. In summary, the market shock from the multi-month war is beginning to dissipate. Israel's actions remain the key variable before the June 19 signing. Upcoming events like Fed Chair Warsh's debut and BoJ rate hike expectations will also significantly impact markets this week.

marsbit06/15 22:52

War Trade Unwinding | TradeXYZ Weekend Observations

marsbit06/15 22:52

Super-Rich Hoarded Record Cash in February, Stock Market Hit New Highs Four Months Later: Who's Getting Fooled?

In February, the total assets in US money market funds reached a record high of approximately $8.25 trillion, a trend highlighted by high-net-worth individuals increasing their cash holdings. Notably, Warren Buffett's Berkshire Hathaway amassed a $381.7 billion cash pile ahead of his 2025 retirement, while other prominent figures like Peter Thiel sold tech stocks, fueling narratives of wealthy investors seeking safety. However, by June, the trend reversed. Money market fund assets fell to around $7.87 trillion, indicating a flow of capital back into equities. Concurrently, the S&P 500 and Nasdaq reached all-time highs, with the S&P 500 surpassing 7600 points. This market surge occurred despite the earlier defensive moves, highlighting a potential opportunity cost for those who retreated to cash. Analysis shows that since early 2022, the S&P 500's total return significantly outpaced that of prime money market funds. The capital shifted from equities appears to have been partly reallocated into alternative investments like real estate, art, and private credit, especially among ultra-high-net-worth individuals. Meanwhile, major investment banks like Goldman Sachs and Morgan Stanley have raised their year-end targets for the S&P 500, citing AI-driven earnings growth, while also cautioning about risks including market concentration and economic fragility beneath the surface rally.

marsbit06/15 06:02

Super-Rich Hoarded Record Cash in February, Stock Market Hit New Highs Four Months Later: Who's Getting Fooled?

marsbit06/15 06:02

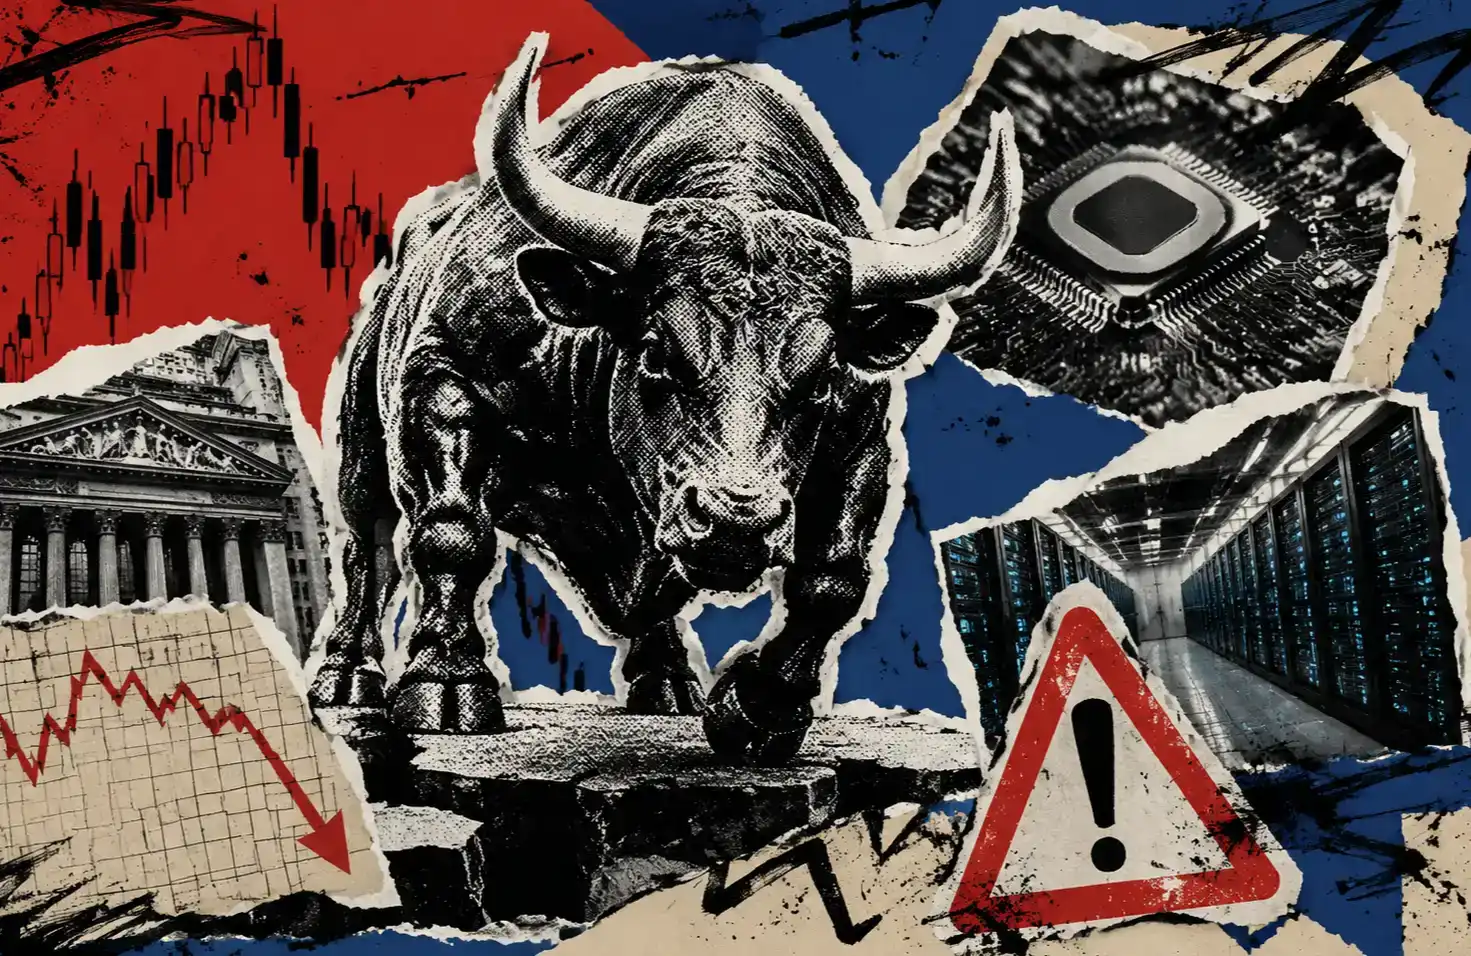
70% Bear Market Signal Flashes in the U.S. Stock Market. Time to Run?

TL;DR: The US stock market faces a complex dilemma: a major bearish warning from Bank of America (BofA) versus strong fundamental growth driven by AI. BofA's equity strategy team warns that about 70% of its bear market indicators have been triggered, a level historically associated with market tops. The S&P 500 shows extreme valuation on multiple metrics, with narrow market breadth and extreme leadership concentration (e.g., top vs. bottom tech stock performance gap at its widest since 2000). This signals deteriorating reward-to-risk odds for investors, as the index advance relies on fewer stocks, reducing portfolio margin for error. However, the current AI boom differs fundamentally from the 2000 dot-com bubble. Today's leading companies (Microsoft, Google, Amazon, Meta, Nvidia) have substantial cash flows, profits, and concrete orders, underpinned by real data center and cloud capital expenditure. Nvidia's massive data center revenue growth offers tangible evidence of demand. The optimism is based on a real infrastructure build-out cycle. The core issue has thus shifted. It's no longer a simple debate about an AI bubble. The market is transitioning from a "buy the growth story" phase to a "prove the growth speed" phase. While AI fundamentals may remain robust, high valuations have priced in significant future success. The key test ahead is whether upcoming earnings can demonstrate that AI-related revenues and cash flows are growing fast enough to justify current prices and offset the elevated risks flagged by historical models like BofA's. Investors must now scrutinize capital expenditure payoffs, profit margins, and whether market breadth improves.

marsbit06/10 09:02

70% Bear Market Signal Flashes in the U.S. Stock Market. Time to Run?

marsbit06/10 09:02

活动图片