Data Decrypts the BTC Cycle: Three Major Bottom Signals Illuminate Simultaneously, Q4 Could Be a Crucial Turning Point Window?

marsbitОпубліковано о 2026-06-16Востаннє оновлено о 2026-06-16

Анотація

"Decoding the Bitcoin Cycle: Three Bottom Signals Flash Simultaneously, Is Q4 the Key Turning Point?" The article analyzes Bitcoin's current market position, comparing it to historical cycles. BTC has corrected over 52% from its October 2025 peak of $126,198 to around $59,100 in June 2026. While significant, this drawdown is milder than the 77-86% declines seen in past bear markets. The analysis is framed within Bitcoin's four-year halving cycle. Past cycles show a pattern: prices peak 12-18 months post-halving, bottom 12-14 months after the peak, with lows typically occurring roughly 17 months before the next halving. Following the April 2024 halving and the October 2025 peak, this pattern suggests a potential bottoming window around Q4 2026, ahead of the expected 2028 halving. Three key on-chain metrics are signaling undervaluation: The MVRV Z-Score has dropped near 0.27, approaching historic bottom zones. The market price is only about 9% above the network's average realized price of ~$53,600, a rare low premium. Bitcoin's price recently touched its 200-week moving average (~$62,200), a level that aligned with bottoms in 2015, 2018, and 2020. While US spot Bitcoin ETFs saw record outflows in May/June 2026, indicating retail panic, whale addresses (holding 100+ BTC) reached a yearly high. Entities like MicroStrategy resumed buying, and long-term holders control a near-record 78% of the supply, suggesting accumulation. A major macro overhang was partially removed with a...

Author | jk

Last October, on the night BTC surged past $120,000, countless people screenshotted the chart and posted it on their social feeds, captioned with "History is being made." Just eight months later, the same people are staring at a price of $59,100, their social posts now asking, "Will it go lower?"

From the peak of $126,198 to the low of $59,100, BTC has experienced a drawdown of over 52%; in early June, the Crypto Fear & Greed Index plunged to 8, hitting its lowest level since 2022.

So, entering the market now—is it brave bottom-fishing, or just catching a falling knife?

In 2018, they said BTC would eventually go to zero; in 2022, they said the crypto industry was finished after the FTX collapse; and now in 2026, the narrative has shifted to "the four-year cycle is broken," "institutions only come to dump," and "risk assets have no place in a high-rate era." Every time, these narratives sound most convincing when prices are at their lowest.

However, narratives are emotional, while data is neutral. Only by separating the two does our current position in the BTC cycle become clear. Let's examine together: where exactly are we in this BTC cycle?

Where Does a 52% Drop Rank in Historical Cycles?

On October 6, 2025, BTC touched its all-time high of $126,198. From that day to an intraday low of around $59,100 on June 5, 2026, this drawdown exceeded 52% from the peak.

A 52% drop sounds alarming, but compared to BTC's past three full bear markets, this figure is actually below the historical median. The 2014 bear market fell 86% from top to bottom, the 2018 one dropped 84%, and the 2022 bear saw a decline of about 77% from $69,000 to $15,479. The current maximum drawdown of approximately 52% so far is significantly milder than the previous three.

This means historically, it has always recovered from deeper declines. While this statement might seem simplistic, from a market confidence perspective, the fear associated with the current price likely exceeds the actual risk implied by the fundamentals.

This is precisely why they say market confidence is more precious than gold.

Four Halvings, Three Nearly Identical Curves

Understanding the current position is inseparable from the halving cycle framework.

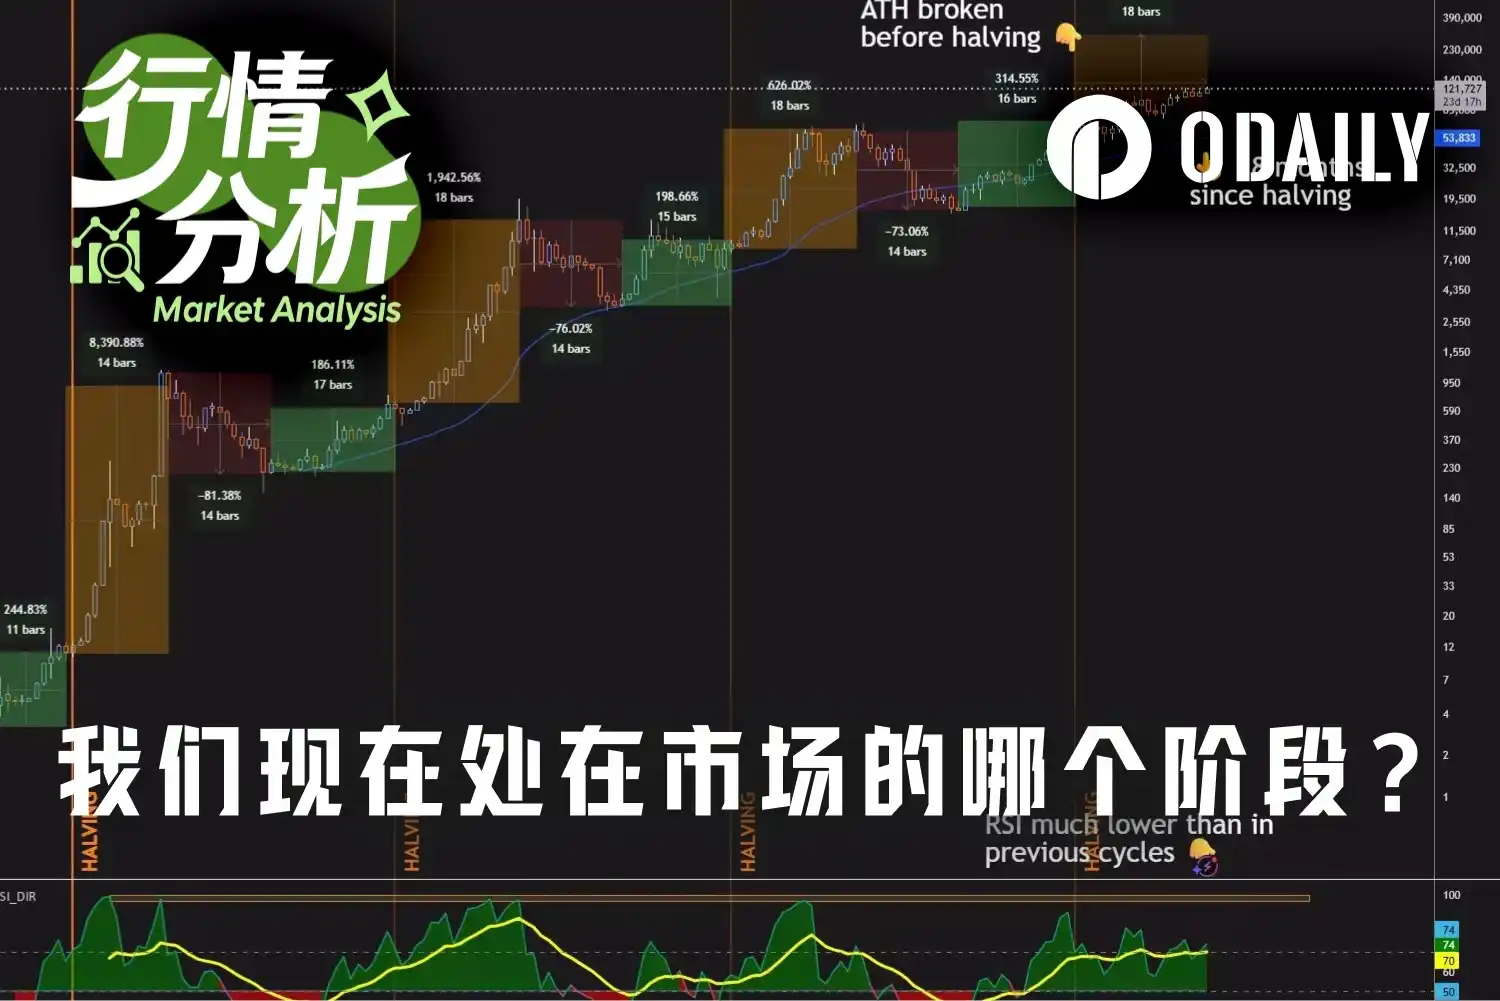
BTC undergoes a halving approximately every four years, reducing the block reward for miners by half and contracting new supply. Surrounding each halving, the past three cycles have followed highly similar bull-bear rhythms: a peak occurs 12 to 18 months post-halving, followed by a bottom 12 to 14 months after the peak, with the bottom typically arriving about 17 months before the next halving.

  • First cycle: Halving in November 2012 when BTC was around $12. About 12 months later, in November 2013, the price peaked at $1,150. The subsequent bear market lasted roughly 13 months, bottoming around $160 in January 2015—about 18 months before the next halving in July 2016.
  • Second cycle: Halving in July 2016 when BTC was around $650. About 17 months later, in December 2017, the price peaked at $19,800. The subsequent bear market lasted about 12 months, bottoming around $3,200 in December 2018—again, about 17 months before the next halving in May 2020.
  • Third cycle: Halving in May 2020 when BTC was around $8,600. About 18 months later, in November 2021, the price peaked at $69,000. The subsequent bear market lasted about 13 months, bottoming around $15,500 during the FTX collapse in November 2022—once more, about 17 months before the next halving in April 2024.
  • Now, the fourth cycle: Halving on April 19, 2024, reducing the block reward from 6.25 to 3.125 BTC at a price of about $63,000. About 18 months later, BTC peaked at $126,198 on October 6, 2025, perfectly falling within the historical "12 to 18 months to peak" window.

As of June 2026, it's been about 26 months since the 2024 halving and about 8 months since the October 2025 peak. According to historical patterns, the bottom typically occurs 12 to 14 months after the peak, suggesting a bottoming window might arrive around October 2026. This would be about 17 months before the next halving (estimated April 2028), almost perfectly aligning with the timing of the previous three cycles.
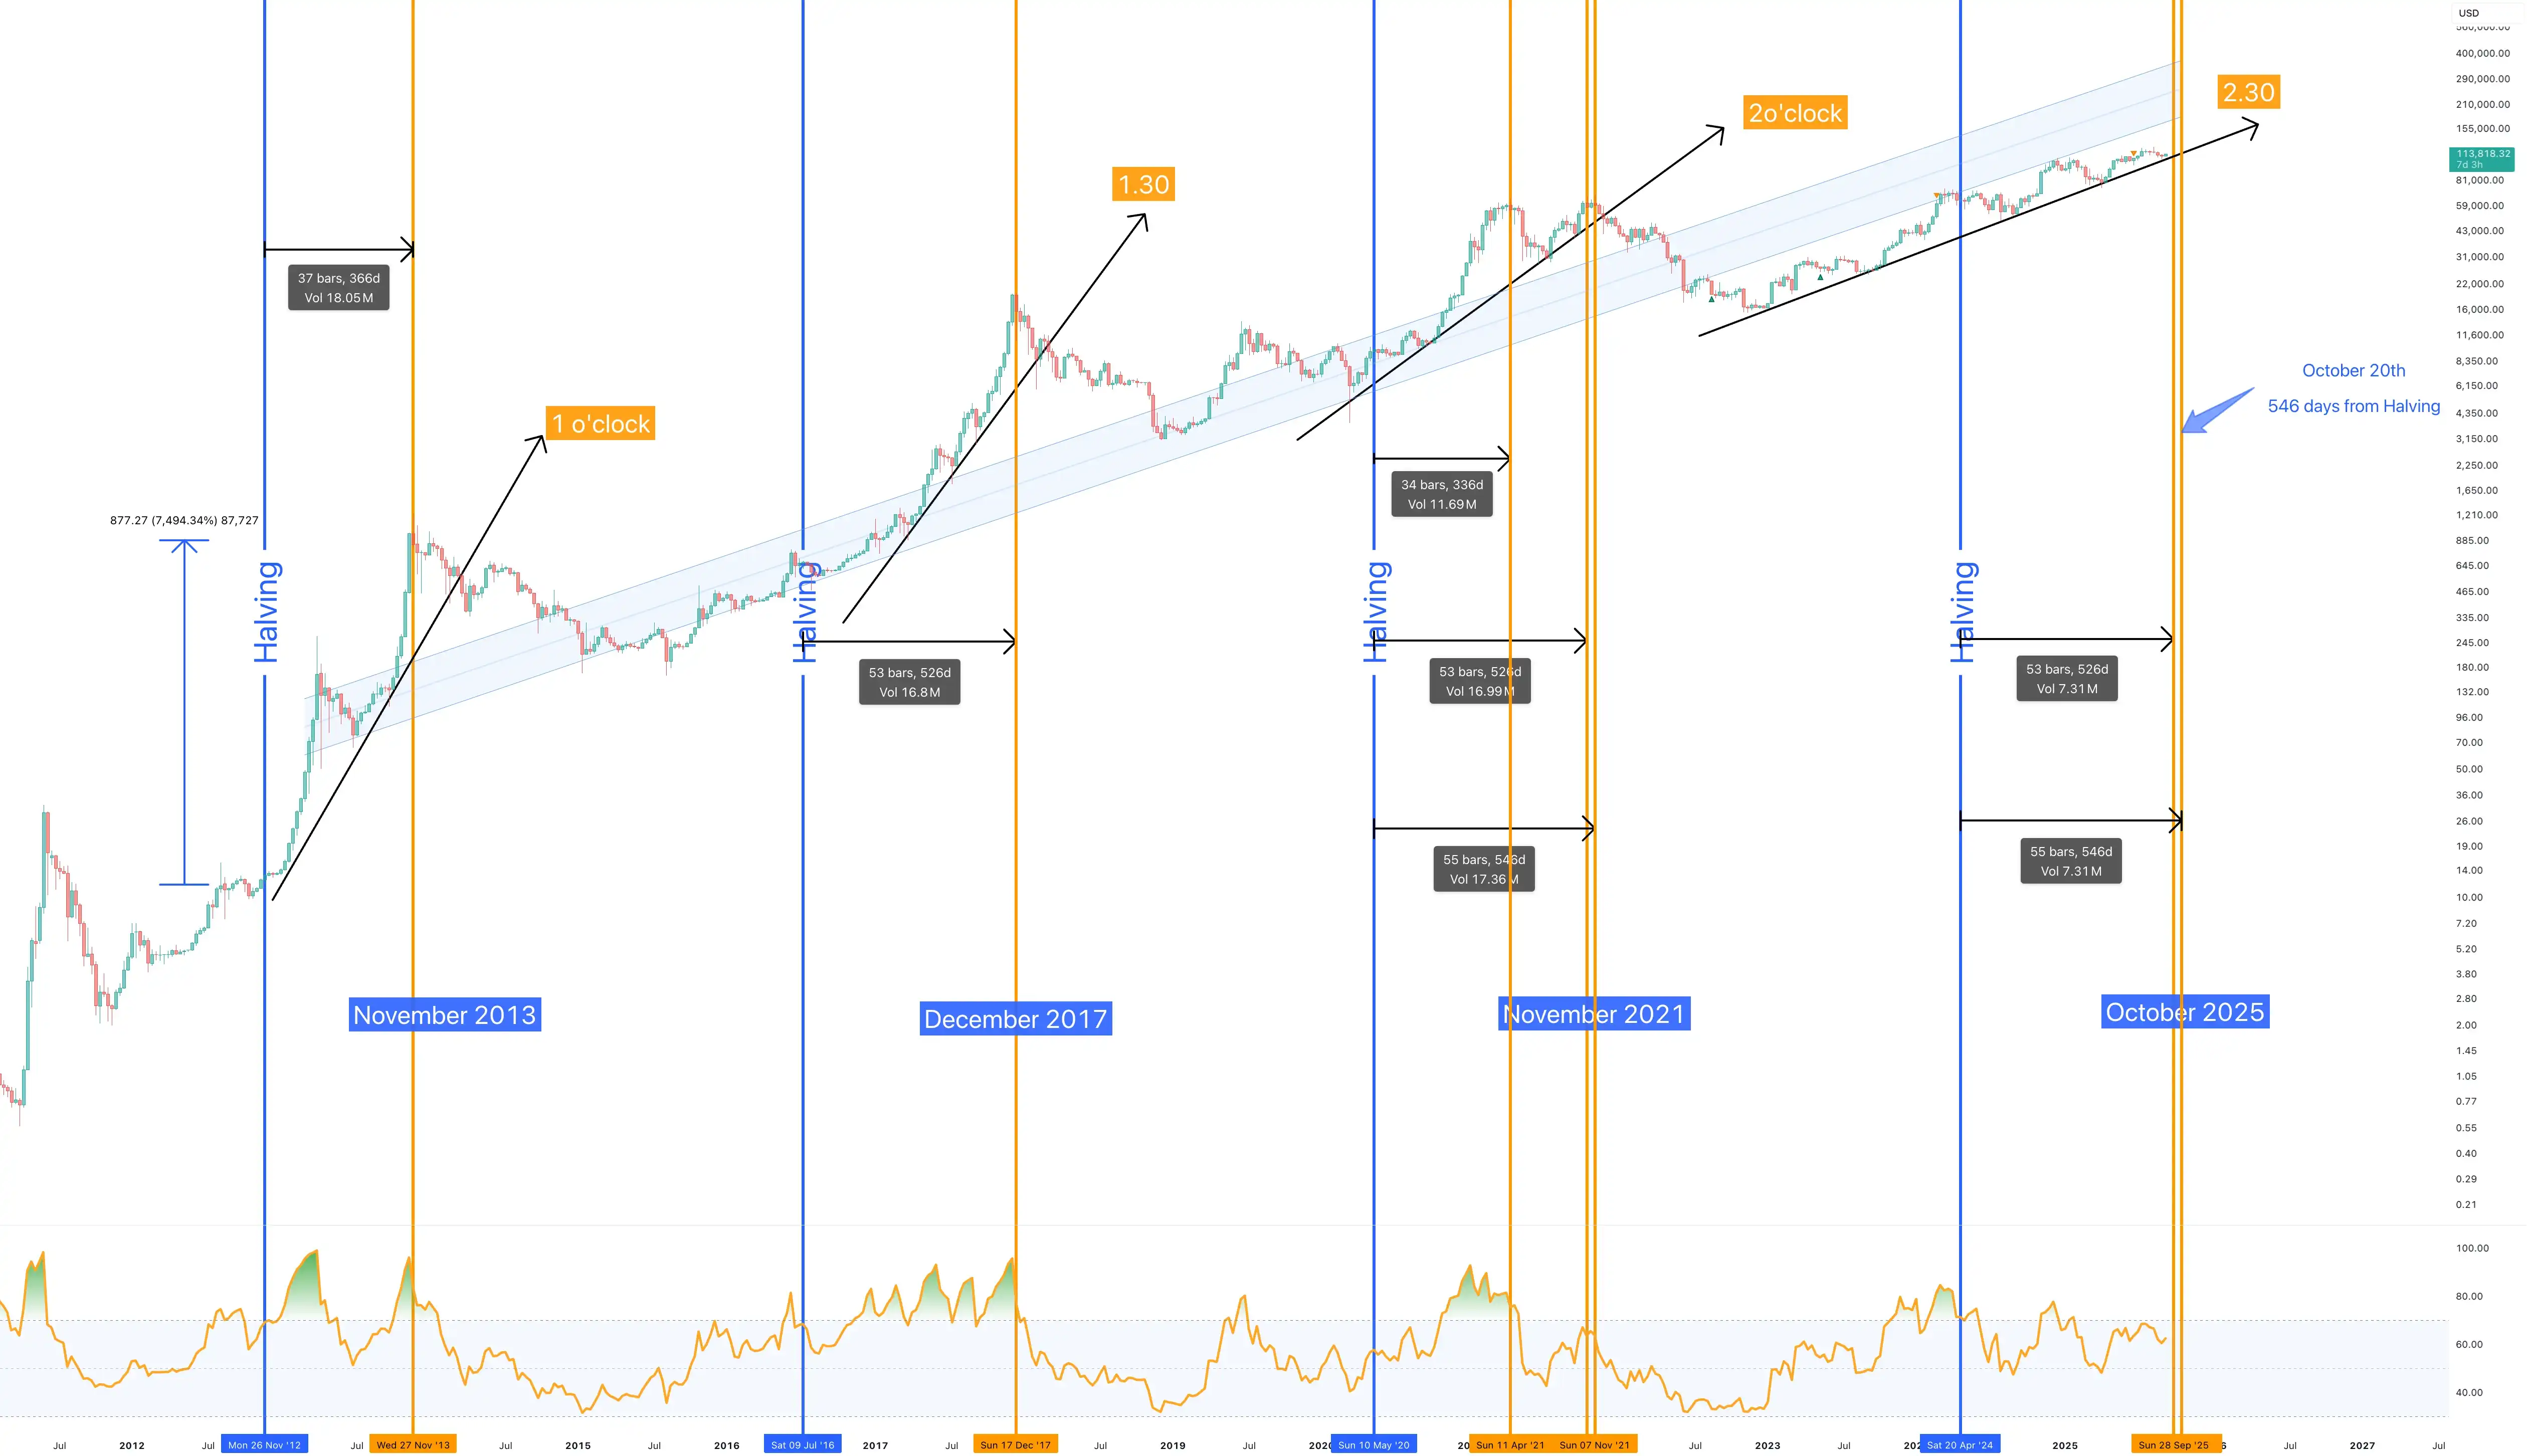
BTC Halving Timeline

From the current vantage point, the second half of 2026 appears more like a phase to reassess the risk-reward ratio within this cycle, rather than a time for simple panic selling.

The supply contraction post-halving continues, and the structural change brought by spot ETFs and institutional capital has altered the market dynamics from being solely driven by retail sentiment. If historical cycles continue to exert influence, the area around Q4 2026 might precisely be the critical window where the market shifts from pessimism to repair, from deleveraging to re-accumulation. For investors bullish on BTC's long-term value, short-term pullbacks might offer more attractive opportunities for phased accumulation. As the bottoming zone gradually approaches, market confidence could begin to reconsolidate, laying the groundwork for the next uptrend.

On-Chain Data: Three Low-Level Signals Illuminate Simultaneously

Beyond price charts, on-chain data provides more fundamental valuation references.

  1. Signal 1: MVRV Z-Score. This metric measures the deviation between the current market price and the average cost basis of all coin holders. Historically, a Z-Score above 7 signals severe overvaluation near a top; falling near 0 or turning negative corresponds to deep undervaluation zones. When BTC peaked in October 2025, the Z-Score was around 5-6. According to data from MacroMicro on June 9, the current Z-Score is approximately 0.27, nearing the boundary of historical bottom areas.
  2. Signal 2: Realized Price. This is the volume-weighted average price at which all circulating BTC last moved on-chain (i.e., their aggregate cost basis). CryptoQuant Head of Research Julio Moreno noted on June 10 that this value is currently around $53,600. With a market price of $62,000, the premium above the aggregate cost basis is only about 9%, a historically rare low level. In past three cycles, major bottoms formed at or slightly below the realized price; it was briefly breached in November 2022.
  3. Signal 3: 200-Week Moving Average (200WMA). This line represents the average price over nearly the past four years and is currently around $62,200. On June 4, 2026, BTC touched this line for the first time in this cycle. The three major bear market bottoms in 2015, 2018, and 2020 all occurred precisely near this line. 2022 was the only exception, where the price broke below and remained under the line for about 16 months, culminating with the FTX collapse.
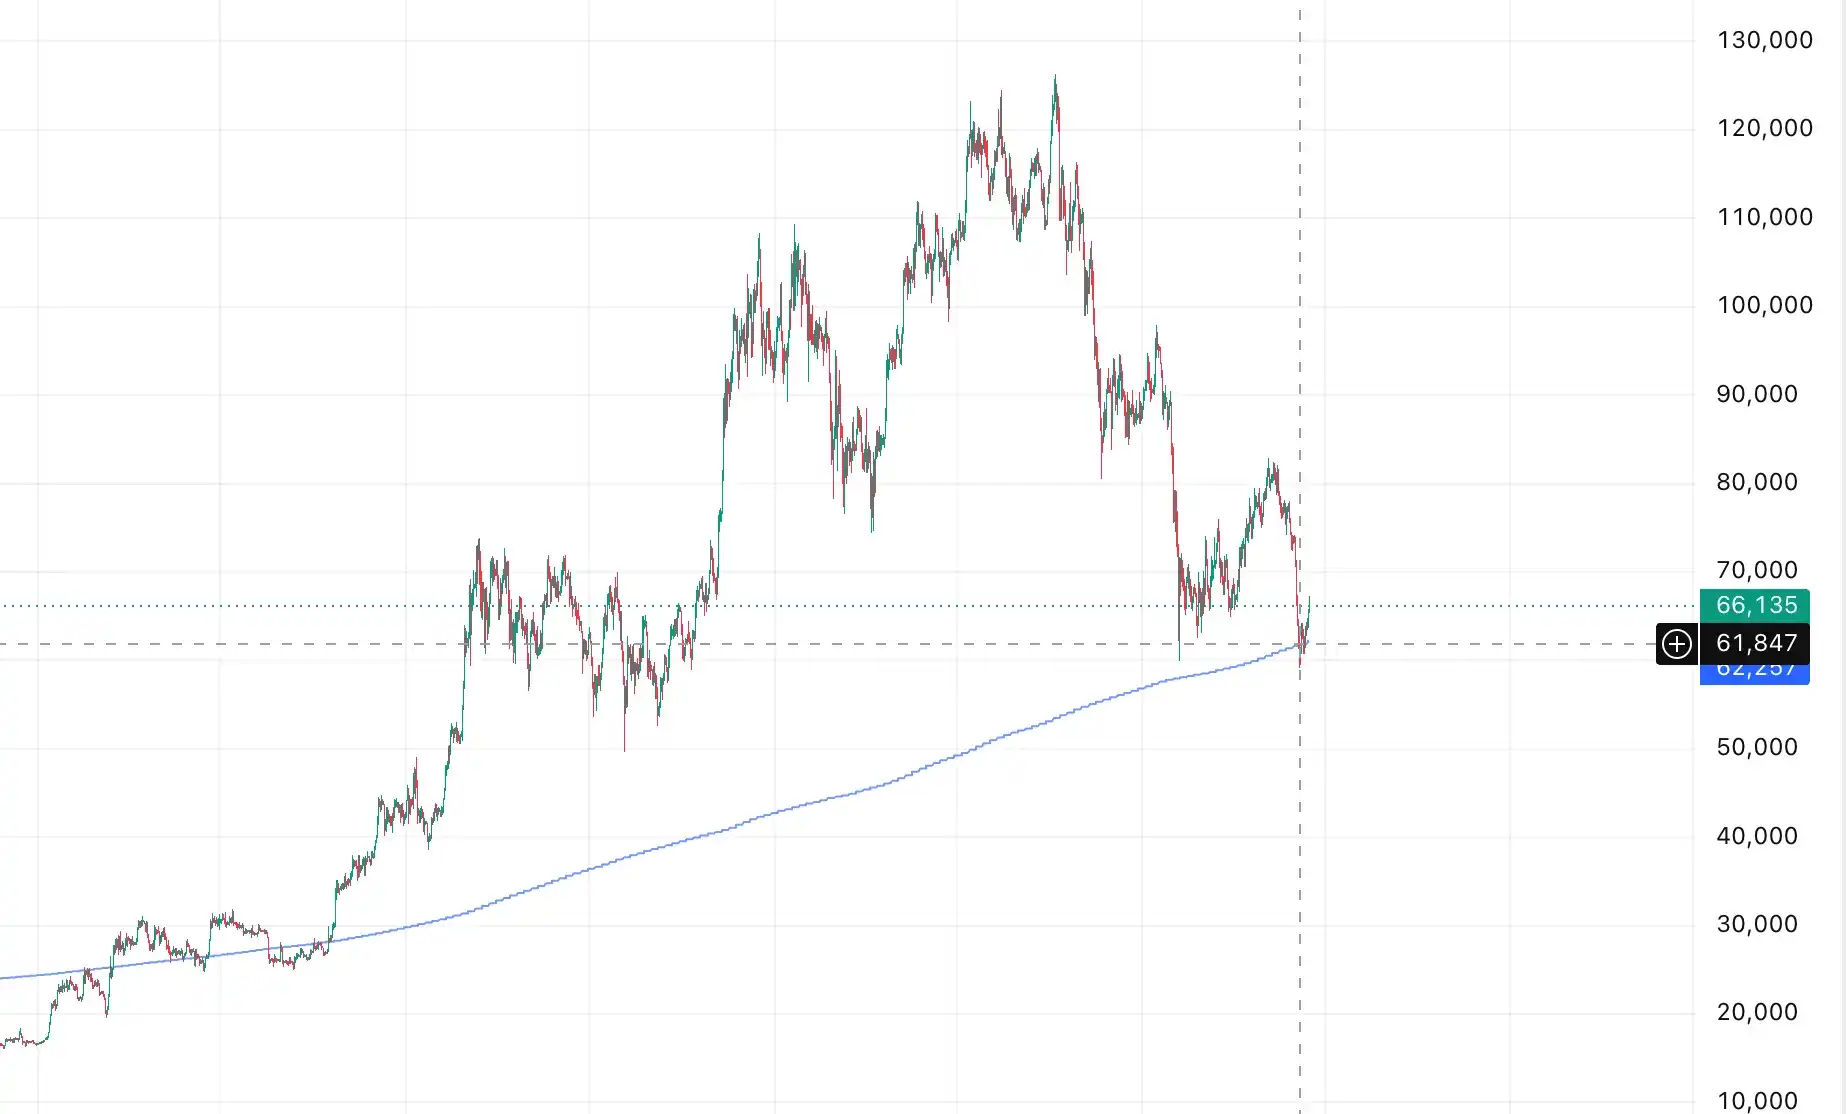
200-Week Moving Average Price. Source: TradingView

Capital Flows: Retail Out, Whales In

Beyond low valuation signals, the structure of capital flows is also showing some bottoming characteristics.

On the ETF front, from mid-May to early June, US spot BTC ETFs experienced net outflows for 13 consecutive trading days, totaling about $4.4 billion (approximately 59,400 BTC), marking the longest continuous outflow period since their launch. BlackRock's IBIT saw a weekly outflow of about $980 million, its worst single-week record. This reflects panic-driven redemptions from short-term and retail capital.

Simultaneously, opposite actions appeared on-chain. The number of whale addresses holding 100+ BTC reached a new 2026 high of around 20,229. The net buying volume by whales in the first five months of 2026 has already matched the total for all of 2025. MicroStrategy sold 32 BTC in late May to pay preferred stock dividends, its first sale in four years, sparking concerns about a strategic shift. However, two weeks later, on June 8, the company bought 1,550 BTC at an average price of $65,332, bringing its total holdings to 845,256 BTC. Michael Saylor described this as "an opportune time to add."

On the exchange front, BTC balances on major exchanges have been declining over the past months, with coins flowing from trading platforms to long-term holders' and institutional cold wallets. Currently, long-term holders (holding for over 155 days) control about 78% of the circulating supply, one of the highest proportions in history.

Macro: The Biggest Uncertainty, Just Half Removed

Over the past months, the core macro logic suppressing BTC has stemmed from two main lines: high interest rates and the Iran war.

In early 2026, US-Israeli military strikes on Iran led to a partial blockade of the Strait of Hormuz. The IEA labeled it the largest supply disruption in global oil market history, with international oil prices briefly surging to $105-120 per barrel. Inflation rebounded as a result; US May CPI rose to 4.2%, far exceeding the 2% policy target. The Federal Funds Rate was forced to remain unchanged in the 3.50%-3.75% range, and the market priced the probability of "zero cuts in 2026" to about 79% at one point. The US Dollar Index strengthened to the 99-100 vicinity. The dual pressure of high rates and risk-off sentiment meant that despite ongoing global liquidity expansion, funds could not flow into the crypto market.

However, on the night of June 14, US President Trump announced the completion of a US-Iran agreement. Iran's Supreme National Security Council formally confirmed the ceasefire memorandum of understanding in the early hours of June 15, with the official signing ceremony scheduled for June 19 in Switzerland. The Strait of Hormuz will subsequently reopen.

The market reaction was immediate and intense. WTI crude oil fell over 4% that day to around $80.25/barrel, and Brent crude dropped to around $83.51. BTC jumped from around $61,500 before the announcement to above $65,000, a single-day gain of over 5%—the largest one-day rebound in the past three months—with volume surging. Futures for the three major US stock indices all rallied over 300 points, and Asian markets followed suit.

Following the agreement, Deutsche Bank stated that it expects the risk of a Fed rate hike to subside in the near term. However, due to sticky inflation, a resilient labor market, and the possibility of a higher neutral rate, a rate hike in 2027 remains possible. The Fed's specific path, of course, depends on the debut of the new chair, Kevin Warsh.

Conclusion: It's the Bottom, and Also When Confidence Is Most Lacking

When BTC stood above $120,000, everyone was willing to believe it would go higher; but now, as it trades around $60,000, with on-chain valuation, cycle positioning, long-term holder dominance, and macro variables all pointing to a bottoming area, what the market lacks most is precisely confidence.

Yet, investing is never done when emotions are most comfortable. Historically, every major BTC bottom has been accompanied by "this time is different" skepticism, alongside comprehensive doubts about the industry, the cycle, and the asset itself. The difference lies only in whether one uses this doubt as a reason to exit or as an opportunity to reprioritize risk-reward.

Current BTC levels certainly don't guarantee it won't fall further or that this is *the* absolute bottom. But when viewed with a longer timeframe, separating short-term panic from long-term structure, the current zone is no longer defined by "chasing highs." It more closely resembles a window for phased accumulation—one requiring patience, discipline, and confidence.

Market confidence is more precious than gold. Because gold can only hedge against inflation, while confidence can navigate cycles. For those who still believe in the long-term value of BTC, in scarcity, and that global liquidity will eventually return to risk assets, the most important question in the second half of 2026 might not be "will it go lower?" but rather, when the market begins to believe in it again, will you already be positioned?

What will you choose?

Трендові криптовалюти

Пов'язані питання

QBased on the article, what are the three primary chain data indicators that are signaling a low valuation for BTC, and what do they signify?

AAccording to the article, the three chain data indicators signaling a low valuation are: 1) The MVRV Z-Score is around 0.27, indicating a market price very close to the historical cost basis. 2) The Network Realized Price (all BTC's cost basis) is approximately $53,600, and the current price is only about 9% above this, a rare historical low premium. 3) The 200-week moving average, currently around $62,200, was touched for the first time this cycle, and it has historically served as a major support level.

QAccording to the historical halving cycle pattern described, when might the current bear market bottom for BTC potentially occur?

ABased on the historical pattern where a market peak occurs 12-18 months post-halving and a bottom occurs 12-14 months after that peak, and considering the 2024 halving and the October 2025 peak, the article suggests the bottoming window could fall around October 2026, which would be approximately 17 months before the next expected halving in 2028.

QHow does the current ~52% price drawdown from the 2025 peak compare to previous major Bitcoin bear markets?

AThe current ~52% drawdown from the $126,198 peak is significantly milder than previous major bear markets. The 2014, 2018, and 2022 bear markets saw drawdowns of approximately 86%, 84%, and 77% respectively. Therefore, the current decline is in the lower to middle range historically.

QWhat contrasting trends in investor behavior does the article highlight regarding BTC holdings?

AThe article highlights a divergence between retail/short-term investors and large holders (whales/institutions). On one hand, US spot BTC ETFs experienced significant and prolonged net outflows, indicating retail panic and selling. On the other hand, the number of whale addresses holding over 100 BTC reached a 2026 high, and long-term holders now control a historically high proportion (~78%) of the circulating supply, suggesting accumulation at lower prices.

QWhat major geopolitical and macroeconomic factor that was suppressing the market did the article state was recently removed?

AThe article states that the geopolitical tension and conflict involving Iran, which led to a spike in oil prices and inflation concerns, was a major market suppressant. This uncertainty was largely removed with the announcement of a US-Iran agreement and ceasefire memorandum on June 14-15, 2026, leading to an immediate positive reaction in BTC and other risk assets.

Пов'язані матеріали

Can Japan Buy Growth with AI? Will the Bond Market Believe It?

Japan's cabinet has introduced the 2026 Basic Policy on Economic and Fiscal Management and Reform, shifting its primary fiscal target. The new framework moves away from the traditional annual primary balance goal and instead prioritizes a stable reduction of the debt-to-GDP ratio. This change is tied to a strategy of increased "responsible proactive fiscal" spending, aiming to boost long-term growth through investments in strategic sectors like AI, semiconductors, energy, and robotics. The government estimates total public and private investment in 62 key technologies could exceed 370 trillion yen by 2040. The market reaction has been mixed and cautious. While equity markets may respond to policy signals, bond markets are focused on fiscal credibility. Concerns center on whether the weakening of the clear primary balance anchor could lead to looser fiscal discipline. If investors doubt that these strategic investments will generate sufficient productivity gains, tax revenue, and nominal growth to outpace rising interest costs, they may demand higher yields on Japanese Government Bonds (JGBs). Recent volatility in the yen and JGB yields, with the 10-year yield briefly reaching 2.9%, reflects this skepticism. The success of this new framework hinges on two factors: whether Japan can achieve a nominal growth rate consistently higher than its long-term interest rates, and whether future budgets demonstrate disciplined control over bond issuance. The government's narrative is that strategic investment is essential to break Japan's cycle of low growth, aging, and labor shortages. However, the bond market will continuously assess the credibility of this plan, pricing the risk that it may represent fiscal expansion rather than a viable growth strategy.

marsbit32 хв тому

Can Japan Buy Growth with AI? Will the Bond Market Believe It?

marsbit32 хв тому

Misjudged A-Shares: Resilience, Expectations, and Confidence

China's A-share market recently faced selling pressure, especially in tech sectors, initially triggered by a global tech sell-off that began in South Korea. However, the article argues this is a case of "mistaken injury" and highlights the market's underlying resilience. This resilience stems from three main pillars: **1) Tech Sector Fundamentals:** Unlike Korea's market dominated by a few memory chip stocks, China's tech sector is diversified across computing, communications, electronics, and semiconductors, supported by dual narratives of global AI supply chains and domestic substitution. Core areas like optical modules and fiber optics continue to show strong earnings growth. **2) "National Team" Support:** State-backed institutions and large corporations have made significant market purchases and announced buybacks, providing liquidity and signaling confidence. This is seen as a stabilizing policy signal, often associated with market bottoms. **3) Broader Market Pillars:** Other major sectors are showing endogenous recovery momentum. Consumer stocks benefit from stabilizing CPI and signs of sector recovery (e.g., liquor price hikes). Cyclical sectors like aluminum have high earnings, potential price increases due to tight supply, and low valuations. The financial sector offers stable dividends and low valuations. The conclusion is that the sell-off was driven by external contagion, not a collapse in fundamentals. With strong policy support and recovering momentum across key sectors, the A-share market possesses the toughness to regain stability.

marsbit1 год тому

Misjudged A-Shares: Resilience, Expectations, and Confidence

marsbit1 год тому

Торгівля

Спот

Популярні статті

Що таке BITCOIN

Розуміння HarryPotterObamaSonic10Inu (ERC-20) та його позиції у крипто-просторі Останніми роками ринок криптовалют спостерігав за зростанням популярності мем-коінів, які привертають інтерес не тільки трейдерів, але й тих, хто шукає спілкування та розважальну цінність. Серед цих унікальних токенів є HarryPotterObamaSonic10Inu (ERC-20), інтригуючий проект, що поєднує культурні посилання з тканинами криптовалюти. Ця стаття досліджує ключові аспекти HarryPotterObamaSonic10Inu, вивчаючи його механізми, спільноту та його взаємодію з ширшим крипто-ландшафтом. Що таке HarryPotterObamaSonic10Inu (ERC-20)? Як випливає з його назви, HarryPotterObamaSonic10Inu є мем-коіном, побудованим на блокчейні Ethereum, класифікованим за стандартом ERC-20. На відміну від традиційних криптовалют, які можуть підкреслювати практичну корисність або інвестиційний потенціал, цей токен процвітає завдяки розважальній цінності та силі своєї спільноти. Проект спрямований на створення середовища, де зацікавлені користувачі можуть об'єднуватися, ділитися ідеями та брати участь у заходах, натхненних різноманітними культурними явищами. Однією з примітних особливостей HarryPotterObamaSonic10Inu є нульовий податок на транзакції. Цей привабливий елемент має на меті заохочувати торгівлю та участь у спільноті, позбавлену додаткових витрат, які можуть відлякувати дрібних трейдерів. Загальна пропозиція монет становить один мільярд токенів, що позначає намір підтримувати суттєву циркуляцію в межах спільноти. Творець HarryPotterObamaSonic10Inu (ERC-20) Походження HarryPotterObamaSonic10Inu дещо окутане таємницею; деталі про творця залишаються невідомими. Розвиток цього токена позбавлений впізнаваної команди або чіткої стратегії, що не є рідкістю в секторі мем-коінів. Натомість проект виник органічно, а його розвиток значною мірою залежить від ентузіазму та участі його спільноти. Інвестори HarryPotterObamaSonic10Inu (ERC-20) Щодо зовнішніх інвестицій та підтримки, HarryPotterObamaSonic10Inu також залишається невизначеним. Токен не зазначає жодних відомих інвестиційних фондів або значної організаційної підтримки. Натомість життєва сила проекту полягає в його базовій спільноті, яка інформує про його зростання та стійкість через колективні дії та залученість у крипто-просторі. Як працює HarryPotterObamaSonic10Inu (ERC-20)? Як мем-коін, HarryPotterObamaSonic10Inu функціонує передусім поза традиційними рамками, що часто регулюють вартість активів. Є кілька відмінних аспектів, що визначають, як працює проект: Транзакції без податку: Завдяки відсутності податкових зборів на транзакції, користувачі можуть вільно купувати та продавати токен, не турбуючись про приховані витрати. Залучення спільноти: Проект процвітає завдяки взаємодії спільноти, використовуючи соціальні медіа для створення шуму та сприяння залученню. Обговорення, обмін контентом та залученість є ключовими елементами, що допомагають розширити його охоплення та зміцнити лояльність серед прихильників. Відсутність практичної корисності: Слід зазначити, що HarryPotterObamaSonic10Inu не пропонує конкретної корисності в рамках фінансової екосистеми. Натомість він класифікується як токен, що призначений в основному для розваги та спільнотних активностей. Культурне посилання: Токен кмітливо вплітає елементи популярної культури, щоб привернути інтерес, зв'язуючи з ентузіастами мемів та крипто-стежками. HarryPotterObamaSonic10Inu ілюструє, як мем-коіни функціонують інакше, ніж традиційні криптовалютні проекти, увійшовши на ринок як інноваційні соціальні конструкти, а не утилітарні активи. Хронологія HarryPotterObamaSonic10Inu (ERC-20) Історія HarryPotterObamaSonic10Inu відзначена кількома значними етапами: Створення: Токен виник з вірусного мему, захопивши уяву багатьох крипто-ентузіастів. Конкретні дати створення недоступні, що підкреслює його органічний розвиток. Лістинг на біржах: HarryPotterObamaSonic10Inu з'явився на різних біржах, дозволяючи зручніший доступ і торгівлю спільноти. Ініціативи залучення спільноти: Ведення діяльності, спрямованої на покращення взаємодії спільноти, включаючи конкурси, кампанії в соціальних мережах та створення контенту від фанатів та прихильників. Плани на майбутнє: Дорожня карта проекту включає запуск колекції NFT, мерчандайзинг та електронну комерцію, пов'язану з його культурними темами, що далі залучає спільноту та намагається додати більше вимірів до його екосистеми. Ключові моменти про HarryPotterObamaSonic10Inu (ERC-20) Спільнотний підхід: Проект надає пріоритет колективному внеску та креативності, забезпечуючи, щоб участь користувачів була в центрі його розвитку. Класифікація як мем-коін: Це є його епігенез розважальної криптовалюти, що відрізняється від традиційних інвестиційних інструментів. Жодного прямого відношення до Bitcoin: Незважаючи на схожість у назві, HarryPotterObamaSonic10Inu є відмінним і не має жодного зв’язку з Bitcoin або іншими усталеними криптовалютами. Зосередженість на співпраці: HarryPotterObamaSonic10Inu створено для того, щоб надати простір для співпраці та обміну історіями серед його власників, забезпечуючи шлях для творчості та спільного зв'язку. Перспективи на майбутнє: Амбіція розширитися за межі початкової концепції в NFT та мерчандайз відкриває шлях для проекту потенційно потрапити в більш мейнстрімні сфери цифрової культури. Оскільки мем-коіни продовжують захоплювати уяву спільноти криптовалют, HarryPotterObamaSonic10Inu (ERC-20) вирізняється своїми культурними зв'язками та орієнтованим на спільноту підходом. Хоча він може не відповідати типовій моделі утилітарного токена, його суть полягає в радощах і товариськості, що підтримуються серед його прихильників, підкреслюючи еволюційну природу криптовалют в усе більш цифрову епоху. Оскільки проект продовжує розвиватися, важливо спостерігати за тим, як динаміка спільноти вплине на його траєкторію в постійно змінюваному ландшафті технології блокчейн.

2.2k переглядів усьогоОпубліковано 2024.04.01Оновлено 2024.12.03

Що таке BITCOIN

Як купити BTC

Ласкаво просимо до HTX.com! Ми зробили покупку Bitcoin (BTC) простою та зручною. Дотримуйтесь нашої покрокової інструкції, щоб розпочати свою криптовалютну подорож.Крок 1: Створіть обліковий запис на HTXВикористовуйте свою електронну пошту або номер телефону, щоб зареєструвати обліковий запис на HTX безплатно. Пройдіть безпроблемну реєстрацію й отримайте доступ до всіх функцій.ЗареєструватисьКрок 2: Перейдіть до розділу Купити крипту і виберіть спосіб оплатиКредитна/дебетова картка: використовуйте вашу картку Visa або Mastercard, щоб миттєво купити Bitcoin (BTC).Баланс: використовуйте кошти з балансу вашого рахунку HTX для безперешкодної торгівлі.Треті особи: ми додали популярні способи оплати, такі як Google Pay та Apple Pay, щоб підвищити зручність.P2P: Торгуйте безпосередньо з іншими користувачами на HTX.Позабіржова торгівля (OTC): ми пропонуємо індивідуальні послуги та конкурентні обмінні курси для трейдерів.Крок 3: Зберігайте свої Bitcoin (BTC)Після придбання Bitcoin (BTC) збережіть його у своєму обліковому записі на HTX. Крім того, ви можете відправити його в інше місце за допомогою блокчейн-переказу або використовувати його для торгівлі іншими криптовалютами.Крок 4: Торгівля Bitcoin (BTC)Легко торгуйте Bitcoin (BTC) на спотовому ринку HTX. Просто увійдіть до свого облікового запису, виберіть торгову пару, укладайте угоди та спостерігайте за ними в режимі реального часу. Ми пропонуємо зручний досвід як для початківців, так і для досвідчених трейдерів.

5.0k переглядів усьогоОпубліковано 2024.12.12Оновлено 2026.06.02

Як купити BTC

Що таке $BITCOIN

ЦИФРОВЕ ЗОЛОТО ($BITCOIN): Комплексний аналіз Вступ до ЦИФРОВОГО ЗОЛОТА ($BITCOIN) ЦИФРОВЕ ЗОЛОТО ($BITCOIN) — це проект на основі блокчейну, що працює в мережі Solana, який має на меті поєднати характеристики традиційних дорогоцінних металів з інноваціями децентралізованих технологій. Хоча він має таку ж назву, як і Bitcoin, який часто називають “цифровим золотом” через його сприйняття як засобу збереження вартості, ЦИФРОВЕ ЗОЛОТО є окремим токеном, розробленим для створення унікальної екосистеми в ландшафті Web3. Його мета — позиціонувати себе як життєздатний альтернативний цифровий актив, хоча деталі щодо його застосувань і функціональностей все ще розробляються. Що таке ЦИФРОВЕ ЗОЛОТО ($BITCOIN)? ЦИФРОВЕ ЗОЛОТО ($BITCOIN) — це токен криптовалюти, спеціально розроблений для використання в блокчейні Solana. На відміну від Bitcoin, який виконує широко визнану роль зберігання вартості, цей токен, здається, зосереджується на більш широких застосуваннях і характеристиках. Помітні аспекти включають: Інфраструктура блокчейну: Токен побудований на блокчейні Solana, відомому своєю здатністю обробляти швидкі та низьковартісні транзакції. Динаміка постачання: ЦИФРОВЕ ЗОЛОТО має максимальне постачання, обмежене 100 квадрильйонами токенів (100P $BITCOIN), хоча деталі щодо його обігового постачання наразі не розголошуються. Утиліта: Хоча точні функціональності не викладені, є вказівки на те, що токен може бути використаний для різних застосувань, потенційно пов'язаних з децентралізованими додатками (dApps) або стратегіями токенізації активів. Хто є творцем ЦИФРОВОГО ЗОЛОТА ($BITCOIN)? На даний момент особа творців і команди розробників, що стоять за ЦИФРОВИМ ЗОЛОТОМ ($BITCOIN), залишається невідомою. Ця ситуація є типовою для багатьох інноваційних проектів у сфері блокчейну, особливо тих, що пов'язані з децентралізованими фінансами та феноменом мем-коінів. Хоча така анонімність може сприяти культурі, орієнтованій на спільноту, вона посилює занепокоєння щодо управління та підзвітності. Хто є інвесторами ЦИФРОВОГО ЗОЛОТА ($BITCOIN)? Доступна інформація вказує на те, що ЦИФРОВЕ ЗОЛОТО ($BITCOIN) не має жодних відомих інституційних спонсорів або помітних венчурних капіталовкладень. Проект, здається, працює за моделлю “рівний до рівного”, зосереджуючись на підтримці та прийнятті спільноти, а не на традиційних шляхах фінансування. Його активність і ліквідність переважно розташовані на децентралізованих біржах (DEX), таких як PumpSwap, а не на встановлених централізованих торгових платформах, що ще більше підкреслює його підхід знизу вгору. Як працює ЦИФРОВЕ ЗОЛОТО ($BITCOIN) Операційні механізми ЦИФРОВОГО ЗОЛОТА ($BITCOIN) можна детальніше розглянути на основі його дизайну блокчейну та характеристик мережі: Механізм консенсусу: Використовуючи унікальний proof-of-history (PoH) Solana в поєднанні з моделлю proof-of-stake (PoS), проект забезпечує ефективну валідацію транзакцій, що сприяє високій продуктивності мережі. Токеноміка: Хоча конкретні дефляційні механізми не були детально описані, велике максимальне постачання токенів вказує на те, що воно може задовольняти мікротранзакції або нішеві випадки використання, які ще потрібно визначити. Інтероперабельність: Існує потенціал для інтеграції з більш широкою екосистемою Solana, включаючи різні платформи децентралізованих фінансів (DeFi). Однак деталі щодо конкретних інтеграцій залишаються невизначеними. Хронологія ключових подій Ось хронологія, яка підкреслює значні віхи, пов'язані з ЦИФРОВИМ ЗОЛОТОМ ($BITCOIN): 2023: Початкове розгортання токена відбувається на блокчейні Solana, позначене його адресою контракту. 2024: ЦИФРОВЕ ЗОЛОТО набуває видимості, оскільки стає доступним для торгівлі на децентралізованих біржах, таких як PumpSwap, що дозволяє користувачам торгувати ним проти SOL. 2025: Проект спостерігає спорадичну торгову активність і потенційний інтерес до ініціатив, очолюваних спільнотою, хоча на даний момент не зафіксовано жодних значних партнерств або технічних досягнень. Критичний аналіз Сильні сторони Масштабованість: Основна інфраструктура Solana підтримує високі обсяги транзакцій, що може підвищити утиліту $BITCOIN у різних сценаріях транзакцій. Доступність: Потенційно низька торгова ціна за токен може привабити роздрібних інвесторів, сприяючи більш широкій участі завдяки можливостям дробового володіння. Ризики Відсутність прозорості: Відсутність публічно відомих спонсорів, розробників або процесу аудиту може викликати скептицизм щодо стійкості та надійності проекту. Волатильність ринку: Торгова активність сильно залежить від спекулятивної поведінки, що може призвести до значної волатильності цін і невизначеності для інвесторів. Висновок ЦИФРОВЕ ЗОЛОТО ($BITCOIN) постає як цікавій, але неоднозначний проект у швидко розвиваючійся екосистемі Solana. Хоча він намагається використати наратив “цифрового золота”, його відхід від встановленої ролі Bitcoin як засобу збереження вартості підкреслює необхідність чіткішого розмежування його передбачуваної утиліти та структури управління. Майбутнє прийняття та адаптація, ймовірно, залежатиме від вирішення поточної непрозорості та більш чіткого визначення його операційних та економічних стратегій. Примітка: Цей звіт охоплює синтезовану інформацію, доступну станом на жовтень 2023 року, і можуть відбутися події, що виходять за межі дослідницького періоду.

160 переглядів усьогоОпубліковано 2025.05.13Оновлено 2025.05.13

Що таке $BITCOIN

Обговорення

Ласкаво просимо до спільноти HTX. Тут ви можете бути в курсі останніх подій розвитку платформи та отримати доступ до професійної ринкової інформації. Нижче представлені думки користувачів щодо ціни BTC (BTC).

活动图片