Wall Street FOMO Rally Continues to Heat Up, How Did Four Days of Gains Surpass Three Months of Fluctuations?

marsbitОпубліковано о 2026-08-11Востаннє оновлено о 2026-08-11

Анотація

A FOMO-driven rally on Wall Street saw the S&P 500 surge 5.8% over four consecutive trading days ending August 4th, a move whose magnitude exceeded the index's entire high-to-low closing price range from the preceding three months. This rapid ascent, placing the four-day gain in the 99.32 percentile for the past decade, forced late entrants to chase prices higher. Despite the bullish momentum, the VIX volatility index also rose concurrently, indicating that traders were simultaneously hedging against potential downside risks. This was reflected in option markets, where short-term call skew hit a two-year high and the one-month average put/call ratio reached its most bullish level in at least four years, showcasing a rare mix of aggressive optimism and persistent caution.

After the close on August 4th, Wall Street witnessed an acceleration that was hard to ignore. The S&P 500 index had rallied 5.8% cumulatively over the four trading days ending that day. According to Reuters, the options market also showed the most bullish skew in at least four years.

The rally itself is not FOMO. What truly makes this round of market action different is how fast prices moved upward and what price the options market simultaneously placed on both upside and downside risks. On August 4th, closing data compiled by FRED also showed the stock market continuing to climb higher, while the VIX volatility index, which measures expected volatility, also closed higher. Optimism did not push volatility down alongside it.

Why Four Days Can Seem Longer Than Three Months
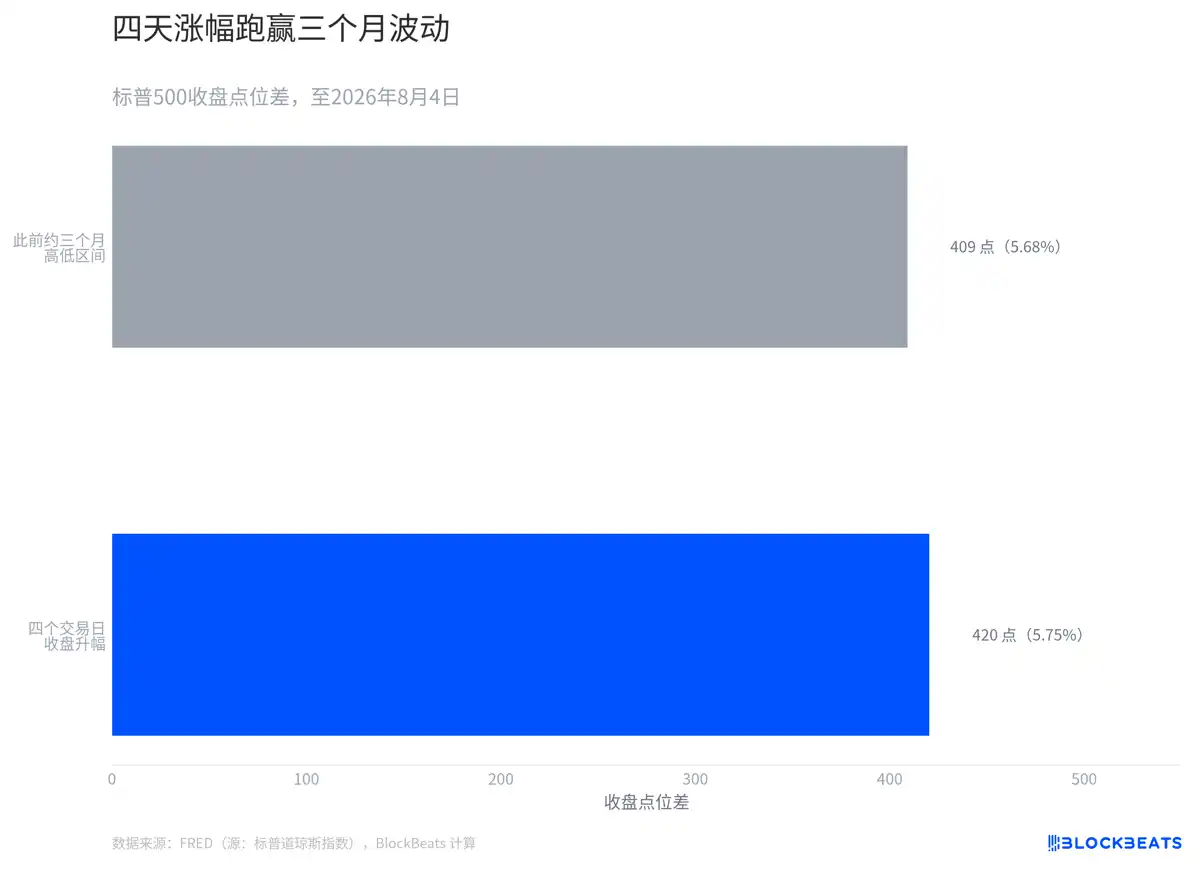
According to the S&P Dow Jones Indices daily closing data compiled by FRED, the economic database of the Federal Reserve Bank of St. Louis, this four-day upward move, measured by the same closing price metric, has slightly exceeded the point difference between the highest and lowest closing prices over the preceding approximately three months.

Placing these two changes side by side is not to equate the four-day return with the three-month high-low range as the same metric. The former indicates direction, the latter a range. They are placed on the same scale to visualize a shift in trading tempo: the closing price fluctuation band formed over months was surpassed by a one-way move over just four trading days.

The price path itself cannot prove the psychology of every participant. What it does illustrate is that four consecutive days of closing price increases rapidly raised the entry price for those joining later. Reuters characterized traders chasing into this rally as FOMO. The speed shown in the chart is precisely the aspect that allows this characterization to be tested against the price series.

How Rare Is This in the Past Decade?
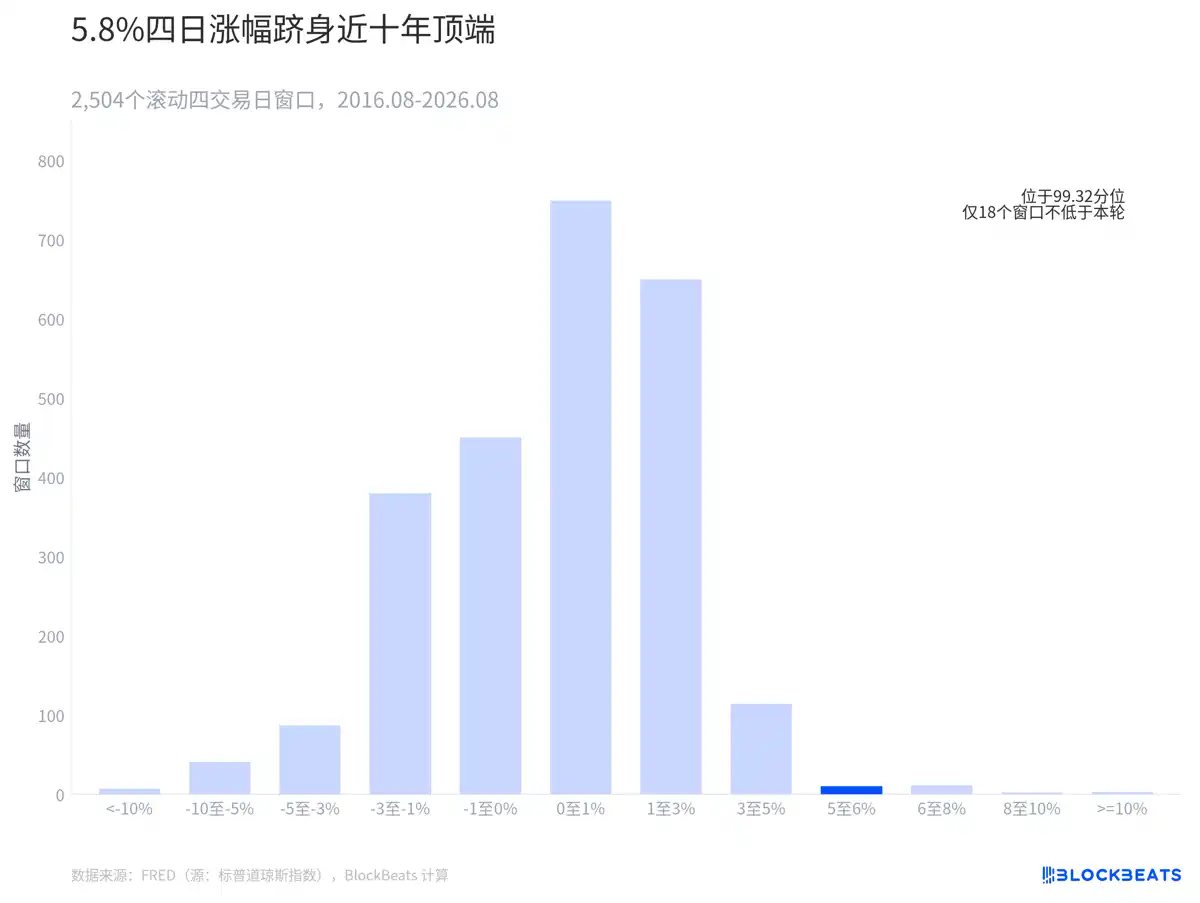
Based on a rolling calculation using nearly a decade of daily S&P 500 closing data from FRED, 2,504 four-day windows were obtained. The current rally of 5.7458% falls at the 99.32nd percentile, already in the sparse area on the far right of the chart.

Calculated from FRED data, including this round, only 18 windows have seen four-day gains at or above this level. Such a four-day magnitude is not common.

How Are Bullishness and Hedging Both Appearing in Options?
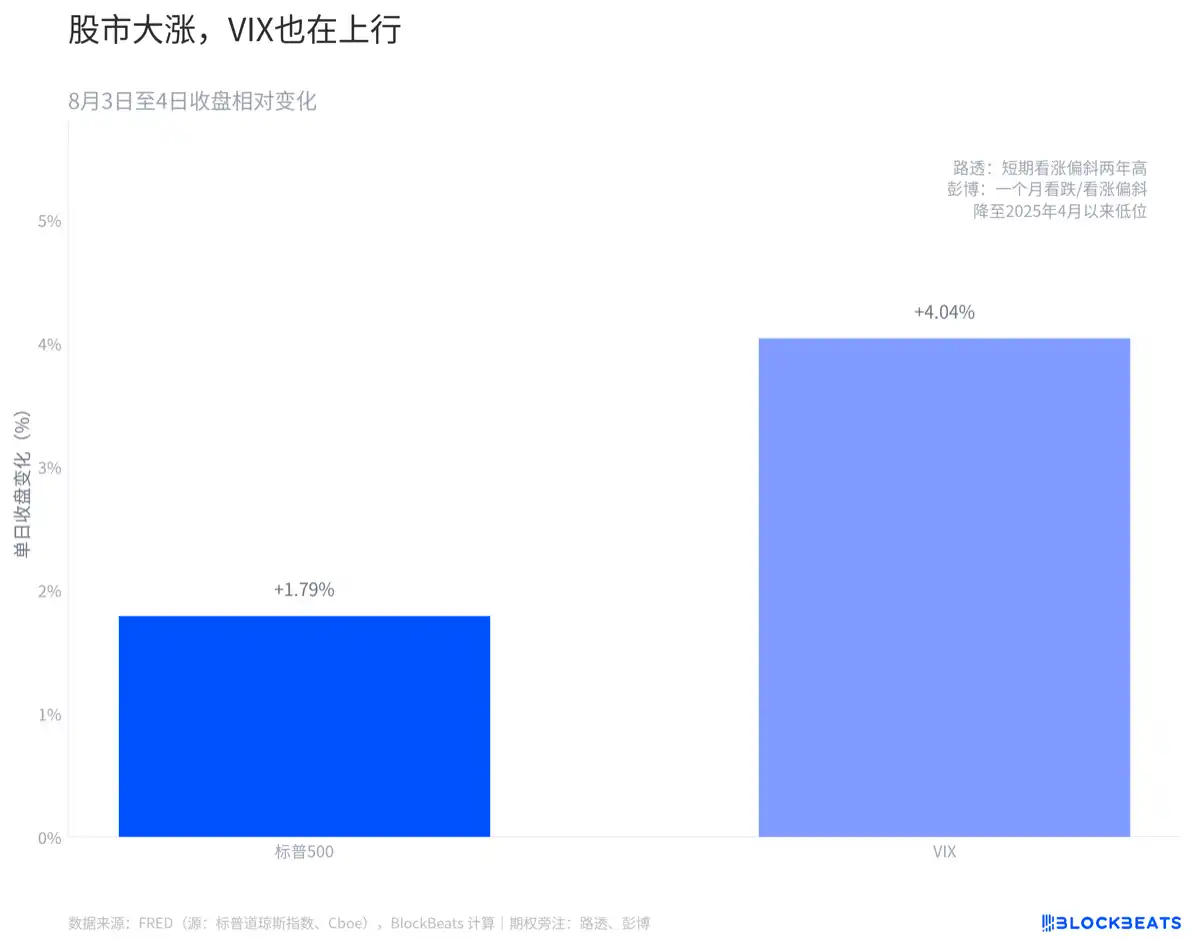
According to closing data for the S&P Dow Jones Indices and the Cboe (Chicago Board Options Exchange) compiled by FRED, the S&P 500 rose 1.79% while the VIX closed up 4.04%. The fact that both prices moved in the same direction indicates that, at least by the end of that day's trading, the market was not fully pricing down expectations for future volatility.

According to Reuters, the skew for near-term call options hit a two-year high. Data from options analytics firm Trade Alert showed the average daily S&P 500 call/put ratio for one month was 0.9, in its most bullish range in at least four years.


Пов'язані питання

QAccording to the article, what two contrasting phenomena occurred simultaneously in the options market during the described rally?

AThe article states that while short-term call option skew hit a two-year high and the call/put ratio indicated strong bullish sentiment (at least a four-year high), the volatility index (VIX) also rose, meaning the market did not completely price down expectations for future volatility. This shows bullishness and a demand for hedging against risk appeared together.

QWhat statistical benchmark is used in the article to show the rarity of the four-day S&P 500 gain mentioned?

AThe article uses a percentile rank based on a rolling calculation of all four-day windows over the past decade of S&P 500 closing data. The specific gain of 5.7458% ranks at the 99.32nd percentile, meaning it is higher than over 99% of similar four-day periods in the last ten years.

QHow does the article visually demonstrate that the four-day price move exceeded the prior three-month range?

AThe article includes a chart (the first image) that plots the four-day upward movement alongside the three-month high-to-low closing price range on the same scale. This visual comparison shows the four-day directional gain crossing the width of the three-month range.

QWhat specific data point from August 4th is given to illustrate that rising stock prices and rising volatility expectations can coincide?

AOn August 4th, the S&P 500 rose by 1.79%, while the VIX (a measure of expected market volatility) also rose, closing up by 4.04%. This simultaneous increase shows that optimism about prices did not suppress expectations for future price swings.

QWhat does the term FOMO refer to in the context of this market rally, and what evidence does the article link to this behavior?

AFOMO refers to 'Fear Of Missing Out,' describing traders chasing the rising market to avoid missing further gains. The article links this behavior to the evidence of the rapid, four-day price increase that quickly raised the entry price for latecomers, as well as the extremely bullish readings in the options market (e.g., high call/put ratios).

Пов'язані матеріали

Citi Research Report Analysis: U.S. Proposed Ban on Chinese Optical Modules Has No Substantial Progress, Short-term Enforcement Faces Supply Constraints

Citi Report Analysis: U.S. Proposed Ban on Chinese Optical Modules Lacks Substantive Progress, Faces Supply Bottlenecks in Short Term. Reuters reported on August 4th that the U.S. government and FCC are considering a ban on Chinese optical modules. Citi's August 9th report clarifies that optical modules are not listed on any effective FCC ban. The FCC's Order 26-50 established two restricted list mechanisms (based on manufacturer and production location), but optical modules were only mentioned once, as an example in a disclosure requirement, not as a restricted product. The reported ban remains at a proposal stage. Citi estimates Chinese suppliers provide 60-70% of high-speed optical modules for U.S. hyperscalers. Non-Chinese suppliers cannot fill this gap in the short term, making the immediate implementation of a genuine ban unlikely. Future regulatory paths could be manufacturer-based (least likely), location-based covering all offshore production (strictest), or location-based covering only China (more feasible but with unresolved definitions). A ban would pressure U.S. AI infrastructure, conflicting with stated policy goals. Citi sees low near-term implementation probability, with the issue potentially becoming a negotiation chip in bilateral talks. U.S. domestic capacity build-out is a key long-term variable. Among Chinese companies, XSENS and Dongshan Precision have the highest U.S. exposure, while Tianfu Communication, as a passive component supplier, is relatively insulated. Citi maintains Buy ratings on all three with respective price targets. The conclusion is that Chinese modules are currently irreplaceable in the U.S. AI supply chain, creating a longer timeline for potential restrictions than the market may expect.

marsbit14 хв тому

Citi Research Report Analysis: U.S. Proposed Ban on Chinese Optical Modules Has No Substantial Progress, Short-term Enforcement Faces Supply Constraints

marsbit14 хв тому

Lead Analyst Claims Bitcoin is at a Critical Stage: 'We are at the Bear Market Bottom, What Happens Next…'

Renowned cryptocurrency analyst Benjamin Cowen, in his latest analysis video, examined recent events and historical cycles in the Bitcoin market. Noting Bitcoin's trading range of $64,000 to $65,000, Cowen stated that market dynamics and investor interest show similarities to past cycles, suggesting the upcoming period marks a critical turning point. Cowen observed a significant decline in public interest and investor enthusiasm for the crypto market, with social risk metrics falling to 0.2, far below levels seen four years ago. He added that market volatility has notably decreased, and a sense of distrust prevails among investors, drawing parallels to the ends of bear markets in 2018 and 2022. Historical data indicates Bitcoin markets typically bottom in summer months, followed by a period of stagnation with low volatility, implying a major move could occur in the year's final quarter. However, Cowen noted on-chain indicators like the MVRV Z-Score have not yet signaled a definitive bottom. Cowen believes an event in the coming weeks could shake the market, potentially triggering a final sell-off wave. Such an event, he argues, would bring investors back and pave the way for a new bull cycle. He predicts October as the most likely bottoming period, while acknowledging September or November are also possible, advising crypto users to remain cautious and prepared for a decisive market moment.

cryptonews.ru23 хв тому

Lead Analyst Claims Bitcoin is at a Critical Stage: 'We are at the Bear Market Bottom, What Happens Next…'

cryptonews.ru23 хв тому

Bitcoin Community in Uproar: Deciphering the New Scaling War Sparked by BIP-110

On August 10, Luke Dashjr, a long-time Bitcoin Improvement Proposal (BIP) editor and co-founder of Ocean mining pool, was removed from the BIP editing team for bypassing discussion protocols and preemptively assigning a number to BIP-110, a controversial soft fork proposal he helped draft. The conflict stems from Bitcoin Core's version 30 release in October 2025, which removed the default 83-byte limit on OP_RETURN, a field used for embedding non-transaction data. In response, BIP-110 aimed to enforce this limit as a consensus rule. It controversially lowered the activation threshold for miners to 55% and included a mandatory activation clause, causing significant community backlash. Major mining pools like Foundry USA and AntPool did not support it, with public criticism from figures like F2Pool's Wang Chun and Michael Saylor, who argued it compromised Bitcoin's neutrality. On August 8, at block height 961,632, nodes running the BIP-110 patch rejected the main chain block, causing a chain split. The minority chain, supported by only about 2.53% of the network's hash rate, produced just one additional block before stalling. The main chain quickly outpaced it by over 240 blocks. No major exchanges have supported the minority chain. The event highlighted Bitcoin's governance reality: while rules can be proposed by a few, ultimate authority lies with the economic majority—miners willing to expend hash power and users/exchanges recognizing a chain's validity. Following the failed split, BIP-110 proponents, including Luke Dashjr, have begun discussing a change to the proof-of-work algorithm to create a separate coin, though this remains in early discussion stages.

marsbit44 хв тому

Bitcoin Community in Uproar: Deciphering the New Scaling War Sparked by BIP-110

marsbit44 хв тому

Торгівля

Спот
活动图片