Author: Jake Pahor
Compilation: Shenchao TechFlow
Shenchao Guide: A valuation model that has tracked Bitcoin's 12-year history has just been rebuilt. The new model shows a current reading of 24.3, in the bottom 20% historical range—but at the true bottom of every previous bear market, this number has fallen below 20. Either this time is different, or the real washout hasn't come yet. For those wanting to buy the dip, it's an uncomfortable but worthwhile signal to watch.
Two weeks ago I told you Bitcoin was in the bottom 3% range of its entire history. Today that score reads 24.3, bottom 20%.
The market hasn't moved 17 points. The model changed. Rather than quietly updating a number and hoping no one checks, I'd rather explain in plain English exactly what happened.
Because here's the thing: if you're using a score to make real-money decisions, you deserve to know when and why it changes. That's the difference between a system and a pitch.
Why the Score Moved But the Market Didn't
Our old model had a flaw we've known about. It compared today's price to Bitcoin's entire history, including the early years when BTC could swing thousands of percent in months. That volatility will never repeat. Because it was baked into the baseline, the score would read low and drift, and could never again reach the top of its own range. Useful, but drifting.
The rebuilt model (v4.1, now live) measures where price sits within a fair value band that projects forward with the asset, instead of being anchored to 2012. Same 0 to 100 scale. Same job. Better ruler. We validated it against 21 hand-labeled cycle tops and bottoms in Bitcoin's history, and it's about 35% more accurate at identifying those points than the old model. I'm not dumping the full methodology in a newsletter, but we've published the plain-English version on the site because a score you can't interrogate is just a feeling with numbers attached.
So what does the new ruler actually say?
This is where it gets interesting, and honestly a bit uncomfortable.
Since 2014, every Bitcoin bear market has ended the same way on this model: the score spends real time below 20 before the turn. The 2015 bottom printed around 7. December 2018 printed around 15. At the November 2022 price low of $15,742, the score read 18, and spent weeks below 20 around that time.
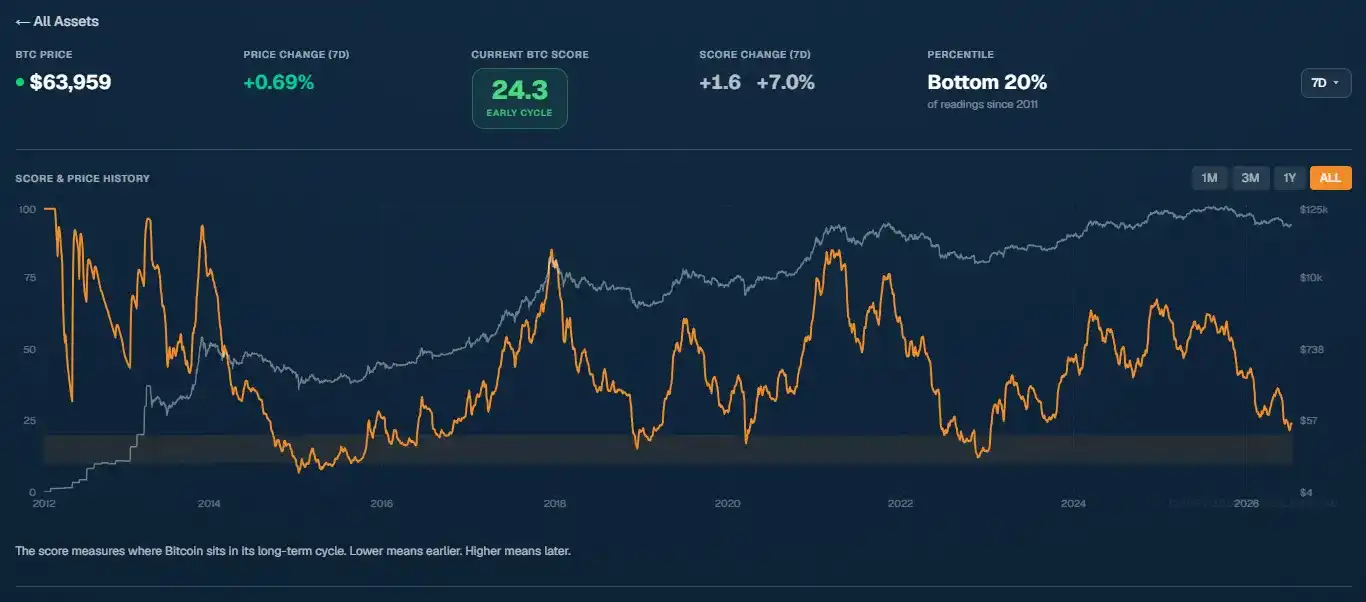
The lowest print of this cycle so far: 21.5, July 1st, with BTC at $58,550.
Close. But not there.
Take from that what you will, but here is my honest take: By the standard of every previous cycle, we have not yet seen the kind of washout that has historically marked the end. That is one possibility. The other possibility is that this cycle stays shallower, just as each prior cycle has been shallower than the last. Our October 2025 top printed a score of 59, well short of the 74+ readings of past manias. A compressed top could mean a compressed bottom. The past doesn't predict the future, and I won't pretend the model is a crystal ball. It's a map of where we are, not a prediction of where we're going.
What I actually did, because a score without a decision is just decoration:
I bought on July 1st. Not because I called a bottom (I didn't know it was a bottom, no one does). But because my plan had a trigger set at that price, and the trigger fired. It felt like a completely ordinary day. The score printed the cheapest reading of the entire cycle, and my phone didn't ring once. That's what real accumulation zones feel like: boring, quiet, slightly nauseating.
I still have a large chunk of capital left. Its deployment schedule is written in my plan, tied to score levels, not to how I feel on a given day. If the score prints below 20, my plan buys more aggressively. If it doesn't and the market turns anyway, my regular DCA already has me positioned. In either case, I don't need to be right. I just need to follow what I wrote when I was calm.
The rebuilt score is live in the app now, along with historical data, so you can check every claim I just made against the charts yourself.
CSH Risk Dashboard
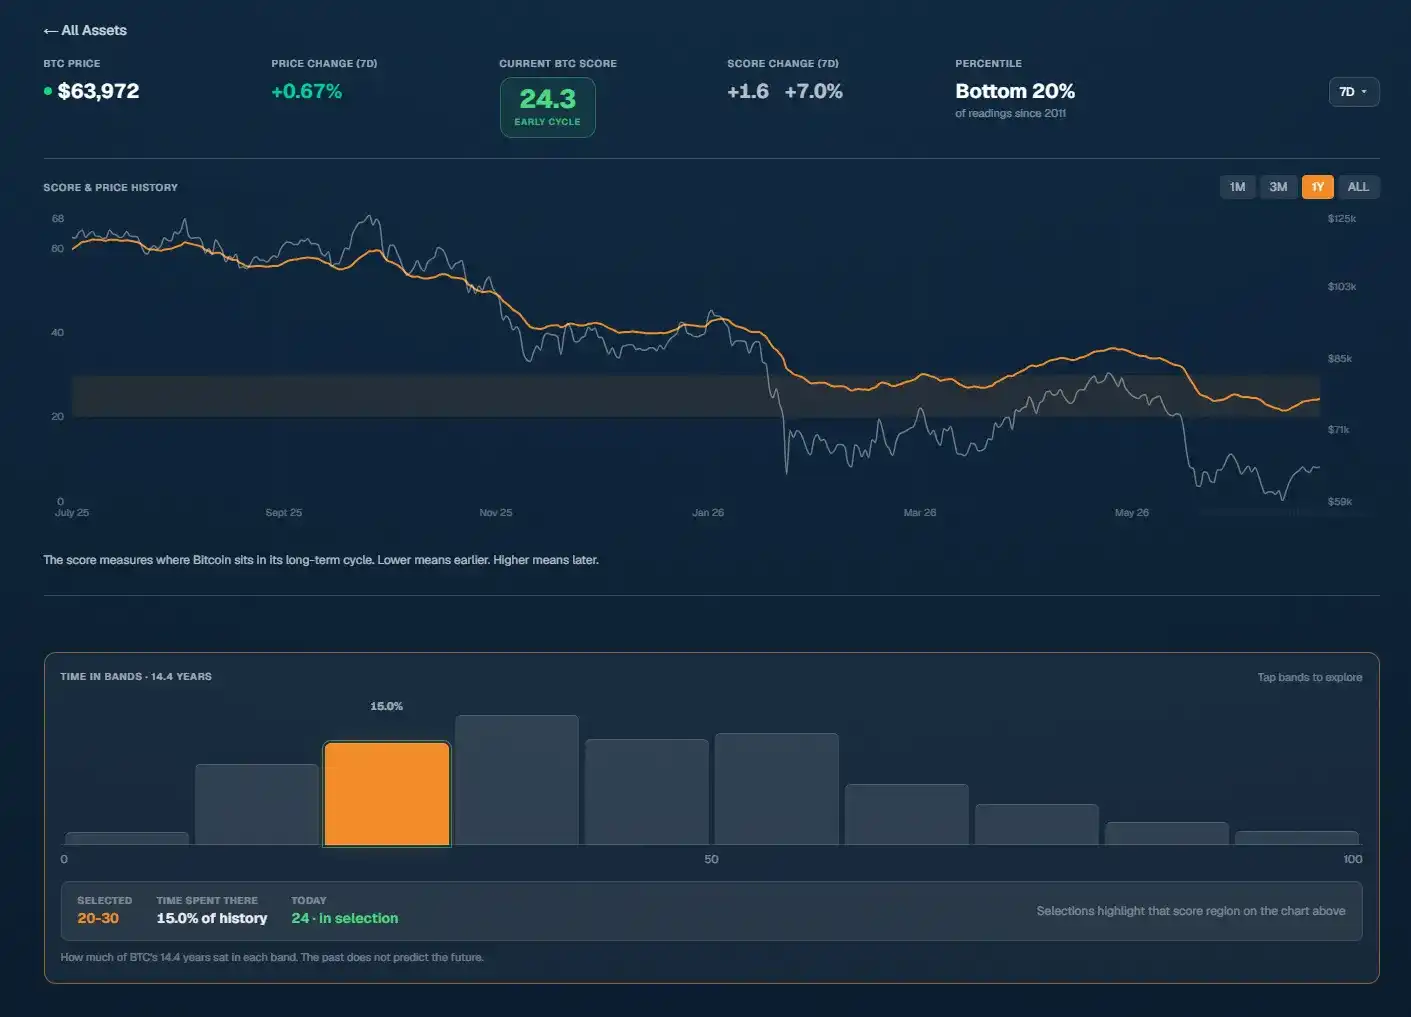
The numbers as of tonight:
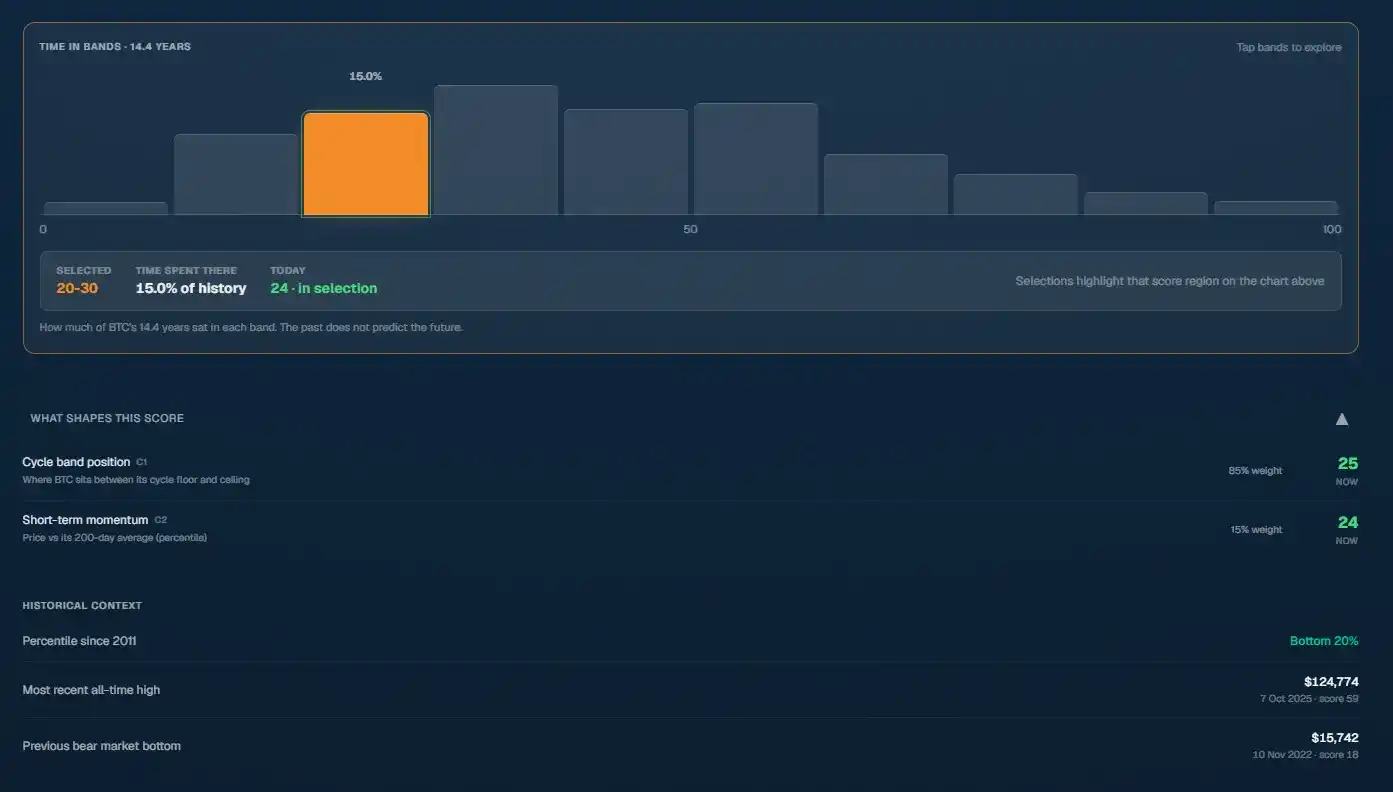
BTC $64,085, up 0.96% this week. The score sits at 24.3, up 1.6 points (7%) over the same period, in the bottom 20% of all readings since 2011. We're in the 20-30 band, where BTC has spent about 15% of its 14.4-year history.
To callback, because the system keeps receipts: The July 1st low at $58,550 printed the cheapest score of this cycle, 21.5. Since then, price is up about 9.5%, and the score has risen with it. None of this changes the plan. The next tier has its trigger, and the trigger hasn't moved.
BTC reclaimed its 200-week moving average this week, around $62.9k, after losing it on July 1st. So what: That line is the life/death line for long-term holders, and the past two bear markets ground below it for months. A quick reclaim is constructive. My plan doesn't trade moving averages, but this aligns with the shift the score's momentum reading captured this week.
One bitcoin now buys about 15.5 ounces of gold, the lowest in nearly three years. Gold has corrected hard, from near-record highs of ~$5,100 in January to around $4,120, but BTC has still lost ground relative to it: This ratio has roughly halved since the October top, when one coin bought nearly 30 ounces. So what: Hard money capital went to gold first this cycle. When the crypto cycle turns, this ratio will snap back fast. My plan doesn't trade this ratio, but there's no clearer picture of how unloved BTC is right now.
Bitcoin dominance at 59%. So what: Altseason isn't even on the radar. The playbook's bear market rule: Altcoins bleed longer and harder. Plan accumulates the index leader first, asks altcoin questions much later in the cycle.
Jake's Workbench: Launch Week
The biggest build week we've ever had. Tom is a machine:
CSH Score v4.1 is live for BTC, with ETH, SOL, and XRP to follow. The website ate a full UI overhaul, charts and mobile included. And we ran a full security audit ahead of something we've been working toward all year: The paid Founding Plan.
To be direct about that last thing: There will be exactly 100 Founding seats, discount priced and permanently locked. That cap is real, not marketing theater, so when it's full, it's full. If you want first look, create a free account, and you'll hear it from me before anyone else. For the price of a coffee or two a month, you get the score, the plan builder, and a dashboard that keeps you honest on the days you don't want to be.
An apology here: If you were using a live plan with triggers on the score this week, the model change moved your readings. I know that's annoying. Short-term pain, long-term sharper tool. Full changelog on the site.
Looking Ahead to Next Week
I'm watching three things, none requiring prediction:
The 200-week MA around $62.9K. We reclaimed it this week after losing it July 1st. Holding above it is the first good sign; losing it again puts lower support back in play.
The path of the score to 20. Every prior bear market printed below it before turning, but not this one yet. If it gets there, my plan buys harder. If it doesn't, DCA already has me positioned. Watch this number with me in the app.
The gold rotation. If the BTC/gold ratio stops declining, that's the earliest signal hard money capital is starting to look our way.
We rebuilt our own model 10 to 12 weeks before asking anyone to pay for it, and the new version makes today's market look less like a bottom, not more. That was the most commercially inconvenient possible result, and we shipped it anyway. Systems over hype was never meant to be a slogan.
My question for you this week, and I'll feature the best answers next issue: What score level would get you to deploy your final third of dry powder? Reply with a number. Mine is already written in my plan.
If this issue was useful, give it a heart. Substack decides who else to show it to based on that.
Talk next Sunday,
Thanks for reading. Share this with someone who would find it valuable.