"Uninvestable" U.S. Treasuries Might Be the Highest-Returning Asset of 2026

marsbit2026-01-20 tarihinde yayınlandı2026-01-20 tarihinde güncellendi

Özet

Amidst a shifting macroeconomic landscape in 2026, long-term U.S. Treasuries, particularly ETFs like TLT and TMF, are positioned to outperform equities. Key arguments include: gold's 200% rise signaling deflationary risks rather than sustained inflation; unsustainable U.S. interest expenses nearing $1.2 trillion annually; heavy short-term Treasury issuance increasing refinancing risks; and extreme short interest in long bonds creating potential for a squeeze. Additionally, cooling inflation, weak consumer sentiment, and rising trade tensions suggest a deflationary shock. Policy interventions, such as yield curve control or QE, are likely if long yields threaten growth or fiscal stability. With long-duration assets offering convexity and a 4.4–4.7% yield, a 100–200 bps decline in long-term rates could drive 15–45%+ returns, making long bonds a high-upside, asymmetric bet for 2026.

Author: Common Sense Investor (CSI)

Compiled by: Deep Tide TechFlow

Deep Tide Guide: With the dramatic changes in the macro environment in 2026, market logic is undergoing a profound shift. Veteran macro trader Common Sense Investor (CSI) presents a contrarian view: 2026 will be the year bonds outperform stocks.

Based on the U.S. government's heavy interest payment pressure, the deflationary signals released by gold, extremely crowded bond short positions, and imminent trade conflicts, the author believes that long-duration U.S. Treasuries (such as TLT) are at an inflection point with an "asymmetric game" advantage.

At a time when the market generally considers bonds "uninvestable," this article, through rigorous macro-mathematical deduction, reveals why long bonds could become the highest-returning asset of 2026.

Full article below:

Why I'm Overweight TLT and TMF — And Why Stocks Will Underperform in 2026

I do not write these words lightly: 2026 is destined to be the year bonds outperform stocks. This is not because bonds are "safe," but because macro mathematics, positioning, and policy constraints are converging in an unprecedented way—and this situation rarely ends with "Higher for Longer."

I have put my money where my mouth is.

TLT (20+ Year Treasury ETF) and TMF (3x Leveraged 20+ Year Treasury ETF) currently make up about 60% of my investment portfolio. This article compiles data from my recent posts, adds new macro context, and outlines a bullish upside scenario for long-duration bonds, particularly TLT.

Core Arguments at a Glance:

  • Gold's Movement: Gold's historical performance does not预示持续通胀—it预示通缩/deflation risk.
  • Fiscal Deficit: U.S. fiscal math is breaking down: ~$1.2 trillion in annual interest支出, and rising.
  • Issuance Structure: Treasury issuance is skewed short-term, quietly increasing systemic refinancing risk.
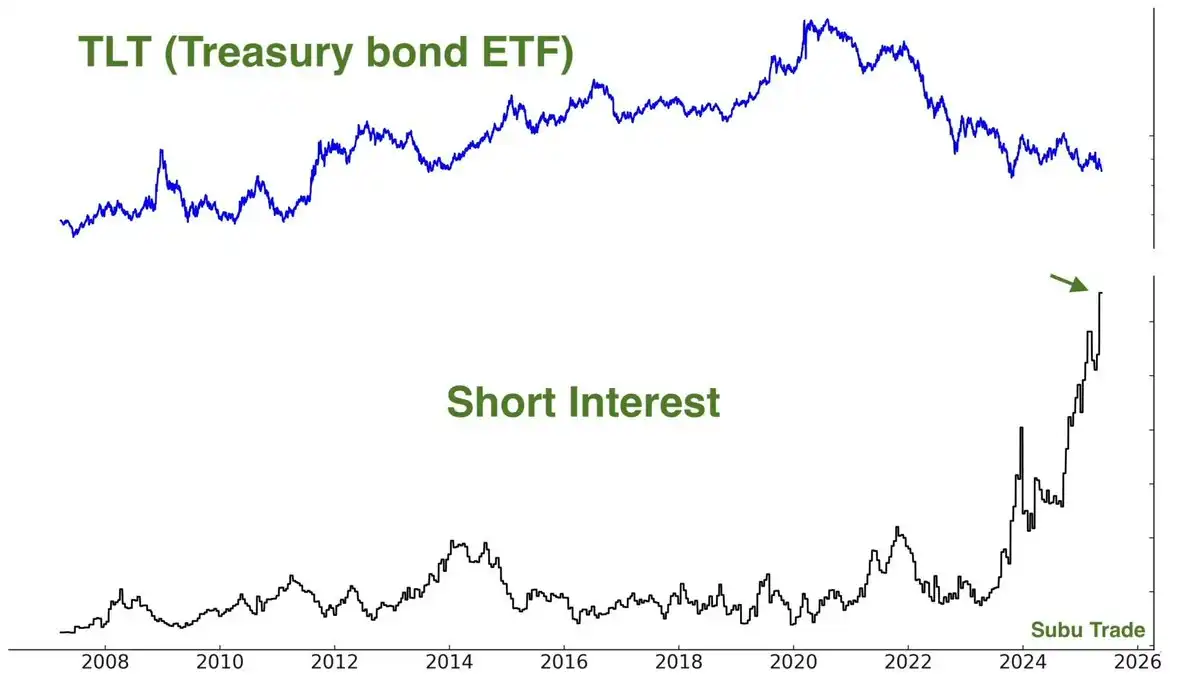
  • Short Squeeze: Long bonds are one of the most crowded short positions in the market.
  • Economic Indicators: Inflation data is cooling, sentiment is weak, labor market pressures are rising.
  • Geopolitics: Geopolitical and trade headlines are turning "Risk-off," not "Reflationary."
  • Policy Intervention: Policy always turns towards lowering long-end rates when something cracks.

This combination has historically been rocket fuel for TLT.

Gold Is Not Always an Inflation Alarm

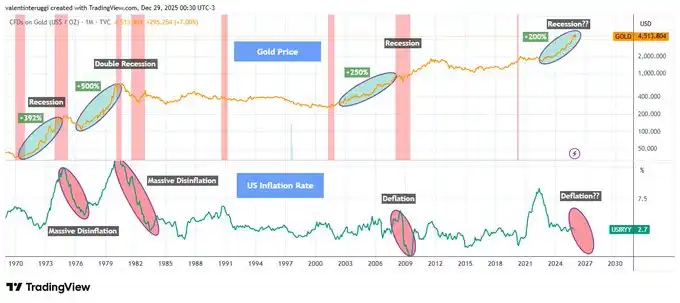
Whenever gold rallies over 200% in a short period, it signals not runaway inflation, but economic stress, recession, and falling real rates (see Chart 1 below).

Historical experience shows:

  • The 1970s gold surge was followed by recession + disinflation.
  • The early 1980s surge was followed by a double-dip recession; inflation was broken.
  • The early 2000s gold rise预示了 the 2001 recession.
  • The 2008 breakout was followed by a deflationary shock.

Since 2020, gold has again risen about 200%. This pattern has never ended in lasting inflation.

When growth flips, gold acts more like a safe-haven asset.
U.S. Interest支出 Is Compounding Explosively

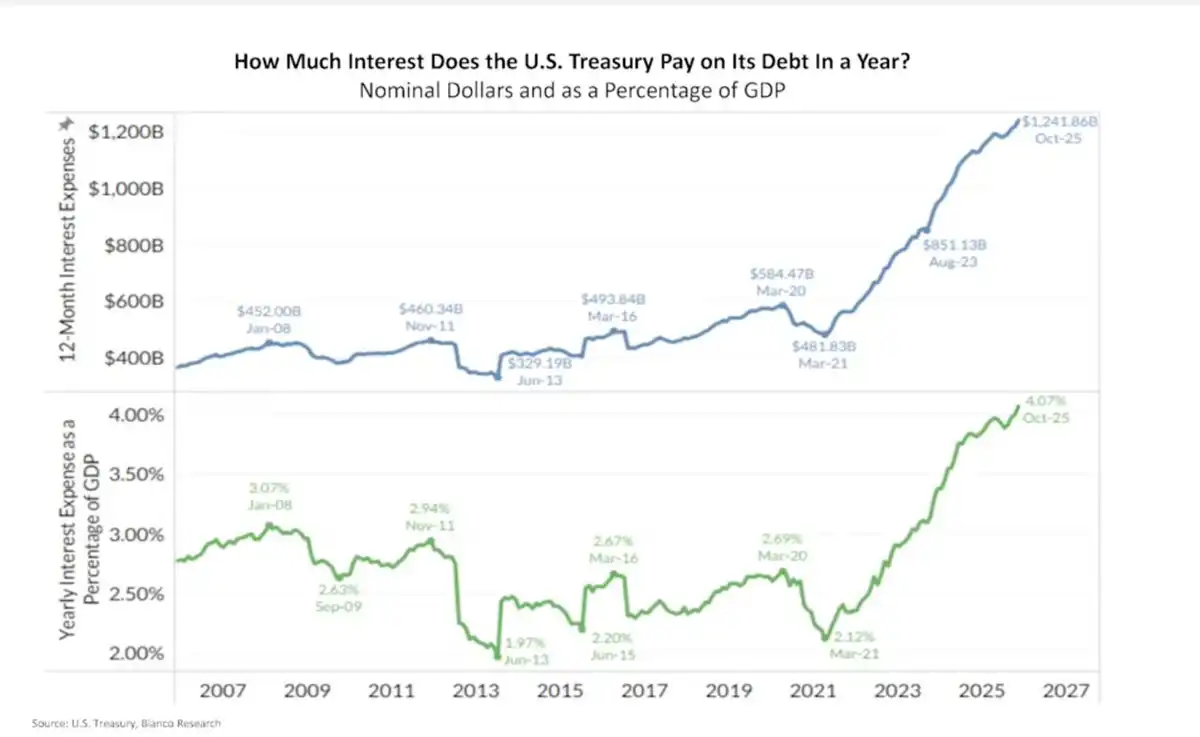
The U.S. currently has annual interest支出 of about $1.2 trillion, roughly 4% of GDP (see Chart 2 below).

This is no longer a theoretical issue. This is real money flowing out—interest compounds rapidly when long-term yields stay high.
This is so-called 「Fiscal Dominance」:

  • High rates mean higher deficits
  • Higher deficits mean more debt issuance
  • More issuance leads to higher Term Premium
  • Higher Term Premium leads to higher interest支出!

This doom loop won't resolve itself with "Higher for Longer." It must be resolved through policy intervention!

Treasury's Short-Term Trap

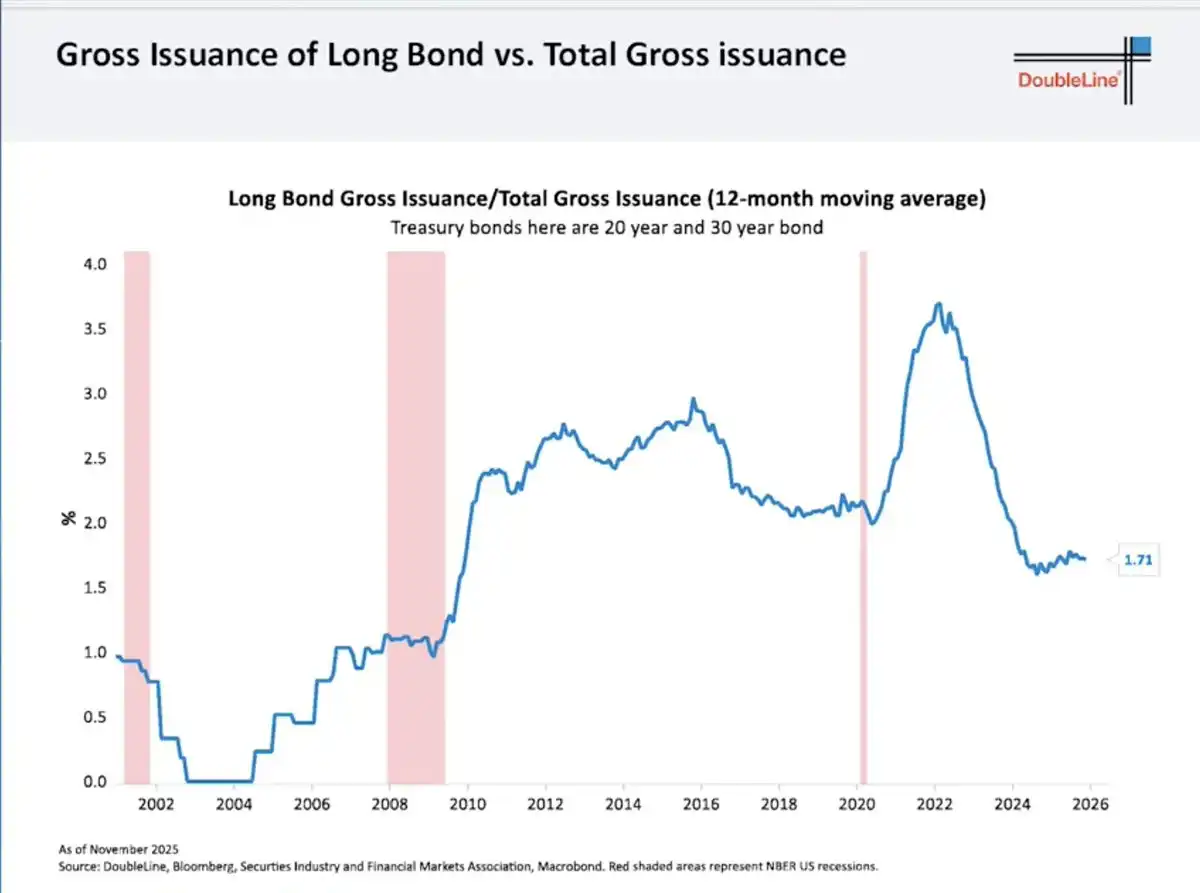
To alleviate immediate pain, the Treasury has drastically cut long-bond issuance:

  • 20/30-year bonds now make up only ~1.7% of total issuance (see Chart 3 below).
  • The rest has been pushed into short-term Bills.
This doesn't solve the problem—it just kicks it down the road:

  • Short-term debt constantly rolls over.
  • Refinancing will happen at future rates.
  • The market sees the risk and demands a higher Term Premium.

Ironically, this is why long-end yields stay high... and why they will collapse violently if growth cracks.

The Fed's Trump Card: Yield Curve Control

The Fed controls the short end, not the long end. When long-end yields:

  1. Threaten economic growth
  2. Trigger explosive fiscal costs
  3. Disrupt asset markets

...the Fed has historically only done two things:

  1. Buy long bonds (QE)
  2. Cap yields (Yield Curve Control)

They won't act preemptively. They only act after stress appears.

Historical references:

  • 2008–2014: 30-year yield fell from ~4.5% to ~2.2% → TLT surged +70%
  • 2020: 30-year yield fell from ~2.4% to ~1.2% → TLT surged +40% in under 12 months

This isn't just theory—this has happened!

Inflation Is Cooling, Economic Cracks Appearing

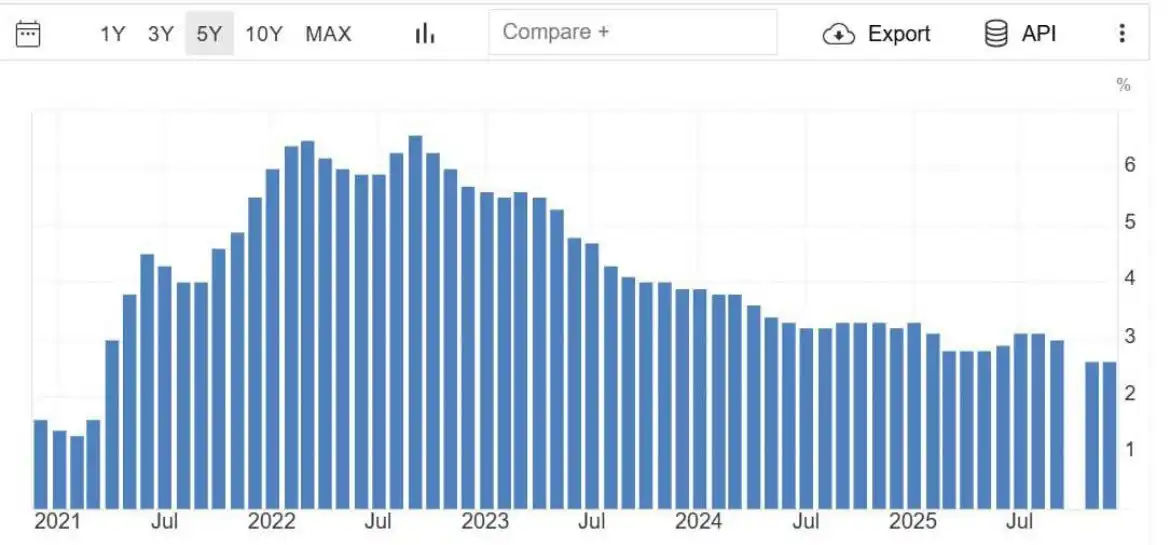
Recent data shows core inflation falling back to 2021 levels (see Chart 4).

  • CPI momentum is fading.
  • Consumer confidence is at a decade low.
  • Credit pressures are building.
  • The labor market is starting to crack.
Markets are forward-looking. The bond market is already starting to smell this.

Extremely Crowded Short Position

TLT short interest is extremely high:

  • ~144 million shares sold short.
  • Days to cover exceeds 4 days.

Crowded trades don't unwind slowly. They reverse violently—especially when the market narrative shifts.

And importantly:

"Shorts pile in AFTER the move, not before."

This is classic late-cycle behavior!

Smart Money Is Moving In

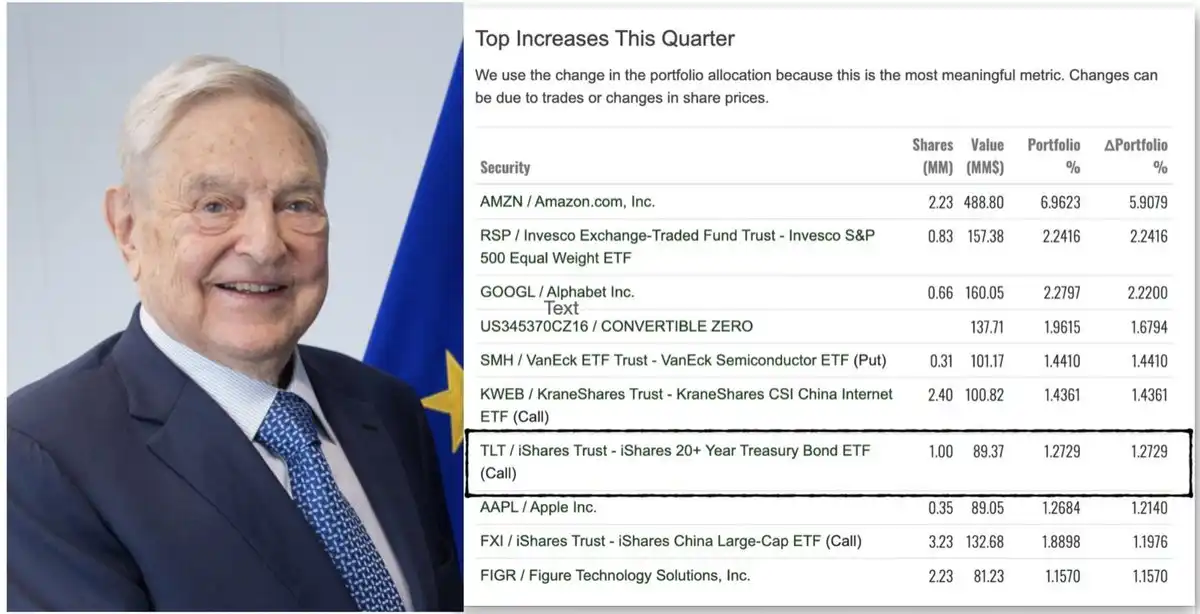
Recent widely circulated 13F institutional holding reports showed a large fund's quarterly increase list featured significant TLT call options.

Whoever it's attributed to, the message is simple: Sophisticated capital is starting to reposition for duration. Even George Soros's fund held TLT call options in its latest 13F disclosure.
Deflationary Shock from Tariff Friction

Recent news is reinforcing the "risk-off" logic. President Trump announced new tariff threats regarding the Denmark/Greenland dispute, and European officials are now openly discussing freezing or suspending participation in the EU-US tariff agreement in response.

Trade friction will:

  • Hit growth
  • Squeeze margins
  • Reduce demand
  • Push capital into bonds over stocks

This is not an inflationary impulse; it's a deflationary shock.

Valuation Mismatch: Stocks vs. Bonds

Today's stock pricing reflects:

  • Strong growth
  • Stable margins
  • Benign financing conditions

While bond pricing reflects:

  • Fiscal stress
  • Sticky inflation worries
  • Permanently high yields

If either of these narratives is wrong, returns will diverge violently.

Long-duration bonds have "convexity"; stocks do not.

$TLT Upside Case Analysis

TLT has:

  • ~15.5 years effective duration
  • You earn ~4.4–4.7% yield while you wait

Scenario Analysis:

  • If long-end yields fall 100 basis points (bps), TLT price return is +15–18%.
  • Fall 150 bps, TLT return is +25–30%.
  • Fall 200 bps (not extreme historically),意味着 it will surge +35–45% or more!

This doesn't include interest income, convexity bonuses, or the accelerating effect of short covering. This is why I see "asymmetric upside."

Conclusion

Honestly: After the惨状 of 2022, I swore I'd never touch long bonds again. Watching duration assets get crushed was a frustrating experience.

But the market doesn't care about your psychological trauma—it only cares about probabilities and price.

When everyone agrees bonds are "uninvestable," when sentiment bottoms, when shorts pile up, when yields are high and growth risks are rising...

That's when I start buying!

  • TLT + TMF are currently ~60% of my portfolio. I made 75% returns in the 2025 stock market and redeployed most of it into bond ETFs in November 2025.
  • I'm "getting paid to wait" (earning over 4% yield).
  • My position is based on policy and growth shifts, not虚无的 narrative.

2026 will finally be the "Year of the Bond."

İlgili Sorular

QAccording to the article, why does the author believe long-duration U.S. Treasuries (like TLT) could be the highest-returning asset in 2026?

AThe author believes a combination of factors creates an 'asymmetric bet' for long bonds: unsustainable U.S. interest expenses, gold price signaling deflationary risks, extremely crowded short positions in bonds, cooling inflation, emerging economic weaknesses, and the high probability of policy intervention (like QE or Yield Curve Control) to lower long-term rates, which would cause their prices to surge.

QWhat historical pattern does the author cite regarding gold's performance and what it has typically preceded?

AThe author states that historically, whenever gold has risen over 200% in a short period, it has not signaled persistent inflation but instead preceded economic stress, recession, and falling real interest rates (disinflation/deflation). Examples given are the 1970s, early 1980s, 2000s, and 2008.

QWhat is 'Fiscal Dominance' as described in the article, and why is it a problem for the U.S.?

A'Fiscal Dominance' is described as a vicious cycle where high interest rates lead to higher budget deficits, which require more government debt issuance. This increased issuance leads to a higher term premium (the extra yield investors demand for holding long-term bonds), which in turn leads to even higher interest expenses, creating a self-reinforcing loop that is unsustainable.

QHow does the current structure of U.S. Treasury debt issuance create a 'short-term trap'?

AThe Treasury has drastically reduced the issuance of long-term bonds (20/30-year) to about 1.7% of total issuance, pushing most of the borrowing into short-term bills. This doesn't solve the debt problem; it merely kicks it down the road. These short-term bills must be constantly refinanced at future (potentially higher) rates, increasing systemic refinancing risk and keeping long-term yields high due to the market's perceived risk.

QWhat specific market positioning factor does the author highlight as a potential catalyst for a rapid price increase in long-term bond ETFs like TLT?

AThe author highlights the extremely crowded short interest in TLT, with approximately 144 million shares sold short and a high 'days to cover' ratio. This creates the conditions for a violent short squeeze, where a shift in market narrative would force short sellers to buy back shares rapidly, accelerating any upward price move.

İlgili Okumalar

From Gold to Bitcoin: Fixed Supply + Institutional Frenzy, Might It Repeat the 'Explosive' Price Trend?

"From Gold to Bitcoin: Fixed Supply and Institutional Frenzy May Lead to 'Explosive' Price Rally Analysts suggest Bitcoin's price action could mirror gold's over the past two decades, following the launch of spot Bitcoin ETFs. Gold ETFs, introduced in 2004, drove gold's price surge to a current market cap near $28 trillion. Both gold and Bitcoin are non-yielding stores of value, with prices driven purely by investor sentiment rather than cash flows or credit. Gold ETFs experienced dramatic cycles: explosive growth, painful drawdowns, and slow recoveries, with each cycle reaching higher peaks. Bitcoin ETFs, approved in early 2024, saw rapid institutional adoption but are now facing similar volatility. Recent warnings highlight the risk of significant ETF outflows disrupting the current rebound. BlackRock's IBIT, a leading Bitcoin ETF, has sold nearly 100,000 BTC to meet redemptions while still holding over 733,000. The core parallel is fixed supply: when demand surges, prices explode, but demand is often volatile and wave-like, not steady. Institutional interest, through ETFs and corporate adoption, remains a key support pillar, helping to cushion sell-offs. If Bitcoin captures even a fraction of gold's role as a store of value, its upside potential is immense, though the path will be marked by high volatility. For investors, focusing on long-term trends and managing risk is crucial as this 'price explosion' narrative unfolds."

Foresight News6 dk önce

From Gold to Bitcoin: Fixed Supply + Institutional Frenzy, Might It Repeat the 'Explosive' Price Trend?

Foresight News6 dk önce

Why Is AI Agent Shopping Hard to Popularize?

The article argues that the popular narrative of "AI agent shopping" – equipping AI with a wallet to autonomously handle purchases – is fundamentally flawed and oversimplifies the complexity of shopping. It deconstructs shopping into two core actions: **information retrieval** (standardized, easily automated) and **value judgment** (deeply subjective and human-centric). The narrative mistakenly assumes AI can fully handle both. Value judgment itself has two layers: **evaluation** (assessing options against criteria) and **demand definition** (setting the criteria, weights, and values). The latter is inherently human and dynamic, as preferences are not fixed but constructed during the decision-making process ("constructive preferences"). The real dividing line for automation is not product standardization, but whether the **act of choosing** itself holds experiential value. For mundane purchases (e.g., printer paper), full AI delegation works. For experiential goods (e.g., wine, furniture), the joy of selection is core to consumption, so AI should act as an assistant that narrows options, leaving the final choice to humans. The "AI wallet" concept confuses three separate elements: decision-making, execution, and fund custody. Current payment industry solutions (e.g., from Stripe, Mastercard, Google, Visa) show that limited, scoped payment authorization tokens are sufficient for most consumer scenarios, not full fund custody. The true use case for autonomous AI wallets is in **B2B procurement** and **machine-to-machine (M2M) settlements** for standardized, high-frequency, low-value transactions. The real bottlenecks for AI shopping are not payment technology, but **1) the lack of trusted data sources** (e.g., fake reviews, counterfeit goods) and **2) the impossibility of automating human demand definition**. The conclusion is that the focus should be on safely automating the assessment and filtering process while reserving for humans the rights to define their criteria and enjoy the final act of choice. For experiential goods, the platform's competitive advantage shifts to providing a superior selection experience.

Foresight News1 saat önce

Why Is AI Agent Shopping Hard to Popularize?

Foresight News1 saat önce

After Nine Months of Shorting, a Full Turn to Long: Renowned Trader Opens Bitcoin Positions Around 64K, Crypto Market Long-Short Divergence Intensifies

After nine months of being short, prominent crypto trader Doctor Profit has closed all his bearish positions and started buying Bitcoin near $64,000, signaling a complete bullish reversal. He argues that structural market changes—such as impending U.S. regulation (CLARITY Act) and institutional adoption via securities tokenization—are rewriting the traditional four-year cycle script, potentially bringing the market bottom forward from the widely expected September/October timeframe. This view finds some technical support from on-chain analyst gumsays, who notes a bullish divergence on Bitcoin's weekly chart has persisted for 147 days, nearing the 161-day duration seen before the 2022 cycle low. However, cycle researcher Jake Pahor presents a counter-argument based on historical data. Analyzing patterns since 2014, he identifies three common features of past bear market bottoms: a ~12-month duration from peak to trough, a sustained period of extreme fear (with a proprietary risk score below 20), and the price falling below Bitcoin's realized price (~$53,000 currently). The current cycle, only nine months from its October 2025 peak, meets none of these conditions. The debate highlights a market torn between "front-running" a potential early bottom driven by new fundamentals and waiting for confirmation through traditional on-chain and sentiment metrics. While Doctor Profit opts for aggressive buying, Pahor maintains a disciplined, tiered accumulation strategy, continuing weekly buys at current risk levels but reserving larger orders for if more extreme fear emerges.

marsbit1 saat önce

After Nine Months of Shorting, a Full Turn to Long: Renowned Trader Opens Bitcoin Positions Around 64K, Crypto Market Long-Short Divergence Intensifies

marsbit1 saat önce

Senior Trader's Confession: How to Trade Market's False Expectations?

Veteran trader's case study: trading the market's "wrong expectations". This trade centered on a textbook "expectation error" after a weak CPI report. While the market initially priced in broad monetary easing (sending Nasdaq to 30,060), the crucial 30-year real yield hit a 20-year high. This signaled a fractured transmission mechanism: short-term rates eased, but long-term funding costs (vital for tech valuations) refused to fall. The trader executed five short positions on the Nasdaq (NQ) as it fell from 30,060 to 28,768. The core methodology: don't just trade the data, but analyze the market's implied causal chain and identify where it breaks. In this case, the chain was: Weak CPI → Policy Easing → Lower Long-Term Funding Costs → NQ Valuation Expansion. The break occurred between policy easing and long-term rates. The "veto variable" – long-term real yields – refused to confirm the bullish narrative. Trades were structured around "fast variables" (price) temporarily repairing while "slow variables" (funding conditions) remained broken. The article outlines a repeatable framework: 1) Map the market's implied causal chain. 2) Identify the veto variable. 3) Observe if it rejects the narrative. 4) Enter when price still follows the old script. 5) Choose the cleanest asset expression (e.g., short NQ, not broad S&P). 6) Define both invalidation and fulfillment exit conditions. The key insight: Alpha often comes not from an information edge, but from a "reaction function edge" – recognizing when the market is applying an outdated causal logic to new data. The critical question: What causal chain is the market's first reaction relying on, and is that chain still valid today?

marsbit1 saat önce

Senior Trader's Confession: How to Trade Market's False Expectations?

marsbit1 saat önce

İşlemler

Spot
活动图片