Glassnode: Crypto Market in 'Late Bear Market Bottoming Phase', Three Core Signals Absent, Bitcoin Reversal Still Requires Time

marsbit2026-07-10 tarihinde yayınlandı2026-07-10 tarihinde güncellendi

Özet

According to a Glassnode analysis, the cryptocurrency market is currently in the late stages of a bear market bottom formation. Bitcoin's price has remained below key realized price and short-term holder cost benchmarks for five months, indicating deep undervaluation. A major source of sell-side pressure is from long-term holders realizing losses, with their daily loss-taking recently peaking at $280 million, the highest level since December 2022. While spot Bitcoin ETF outflows have moderated, they remain in a state of monthly net negative flows, and trading volumes are approximately 80% below their 2025 peak, signaling a lack of robust institutional demand. In derivatives markets, positioning has shifted to a cautiously bullish stance. However, options volatility surfaces still price in downside risk, and the spot price sits below the "Max Pain" strike level. The report concludes that the necessary conditions for a market bottom are in place, but a confirmed reversal requires three core signals: a sustained decline in long-term holder loss realization, a stabilization in ETF fund flows, and a sustained price recovery above the Realized Price. Until these signals emerge, a full transition to a bull market is unlikely to occur imminently.

Authors:CryptoVizArt, Frederik Theissen, Glassnode

Compiled by:Luffy, Foresight News

Bitcoin price has been below the true market average and the cost basis of short-term holders for five consecutive months, residing in a deeply undervalued zone.

The proportion of losses realized by long-term holders relative to total on-chain realized losses has now risen to 43%, with the daily peak of loss realization reaching $280 million, the highest level since December 2022. The outflow of spot ETF funds has moderated but still maintains a state of monthly net outflows; ETF daily average trading volume remains in the range of $650 million to $950 million, shrinking approximately 80% from the peak in October 2025, indicating institutional buying demand has not yet stabilized.

Derivatives positioning has shifted to cautiously bullish, with the put/call ratio dropping to its lowest level in 2026; however, the options volatility skew still maintains a defensive premium, and the spot price remains significantly below the max pain price. The market has entered the late stage of bottoming, and the continuous narrowing of selling pressure from long-term holders is an important precondition for a market reversal and recovery.

Macro Perspective

Oil Surges, Risk Assets Under Collective Pressure

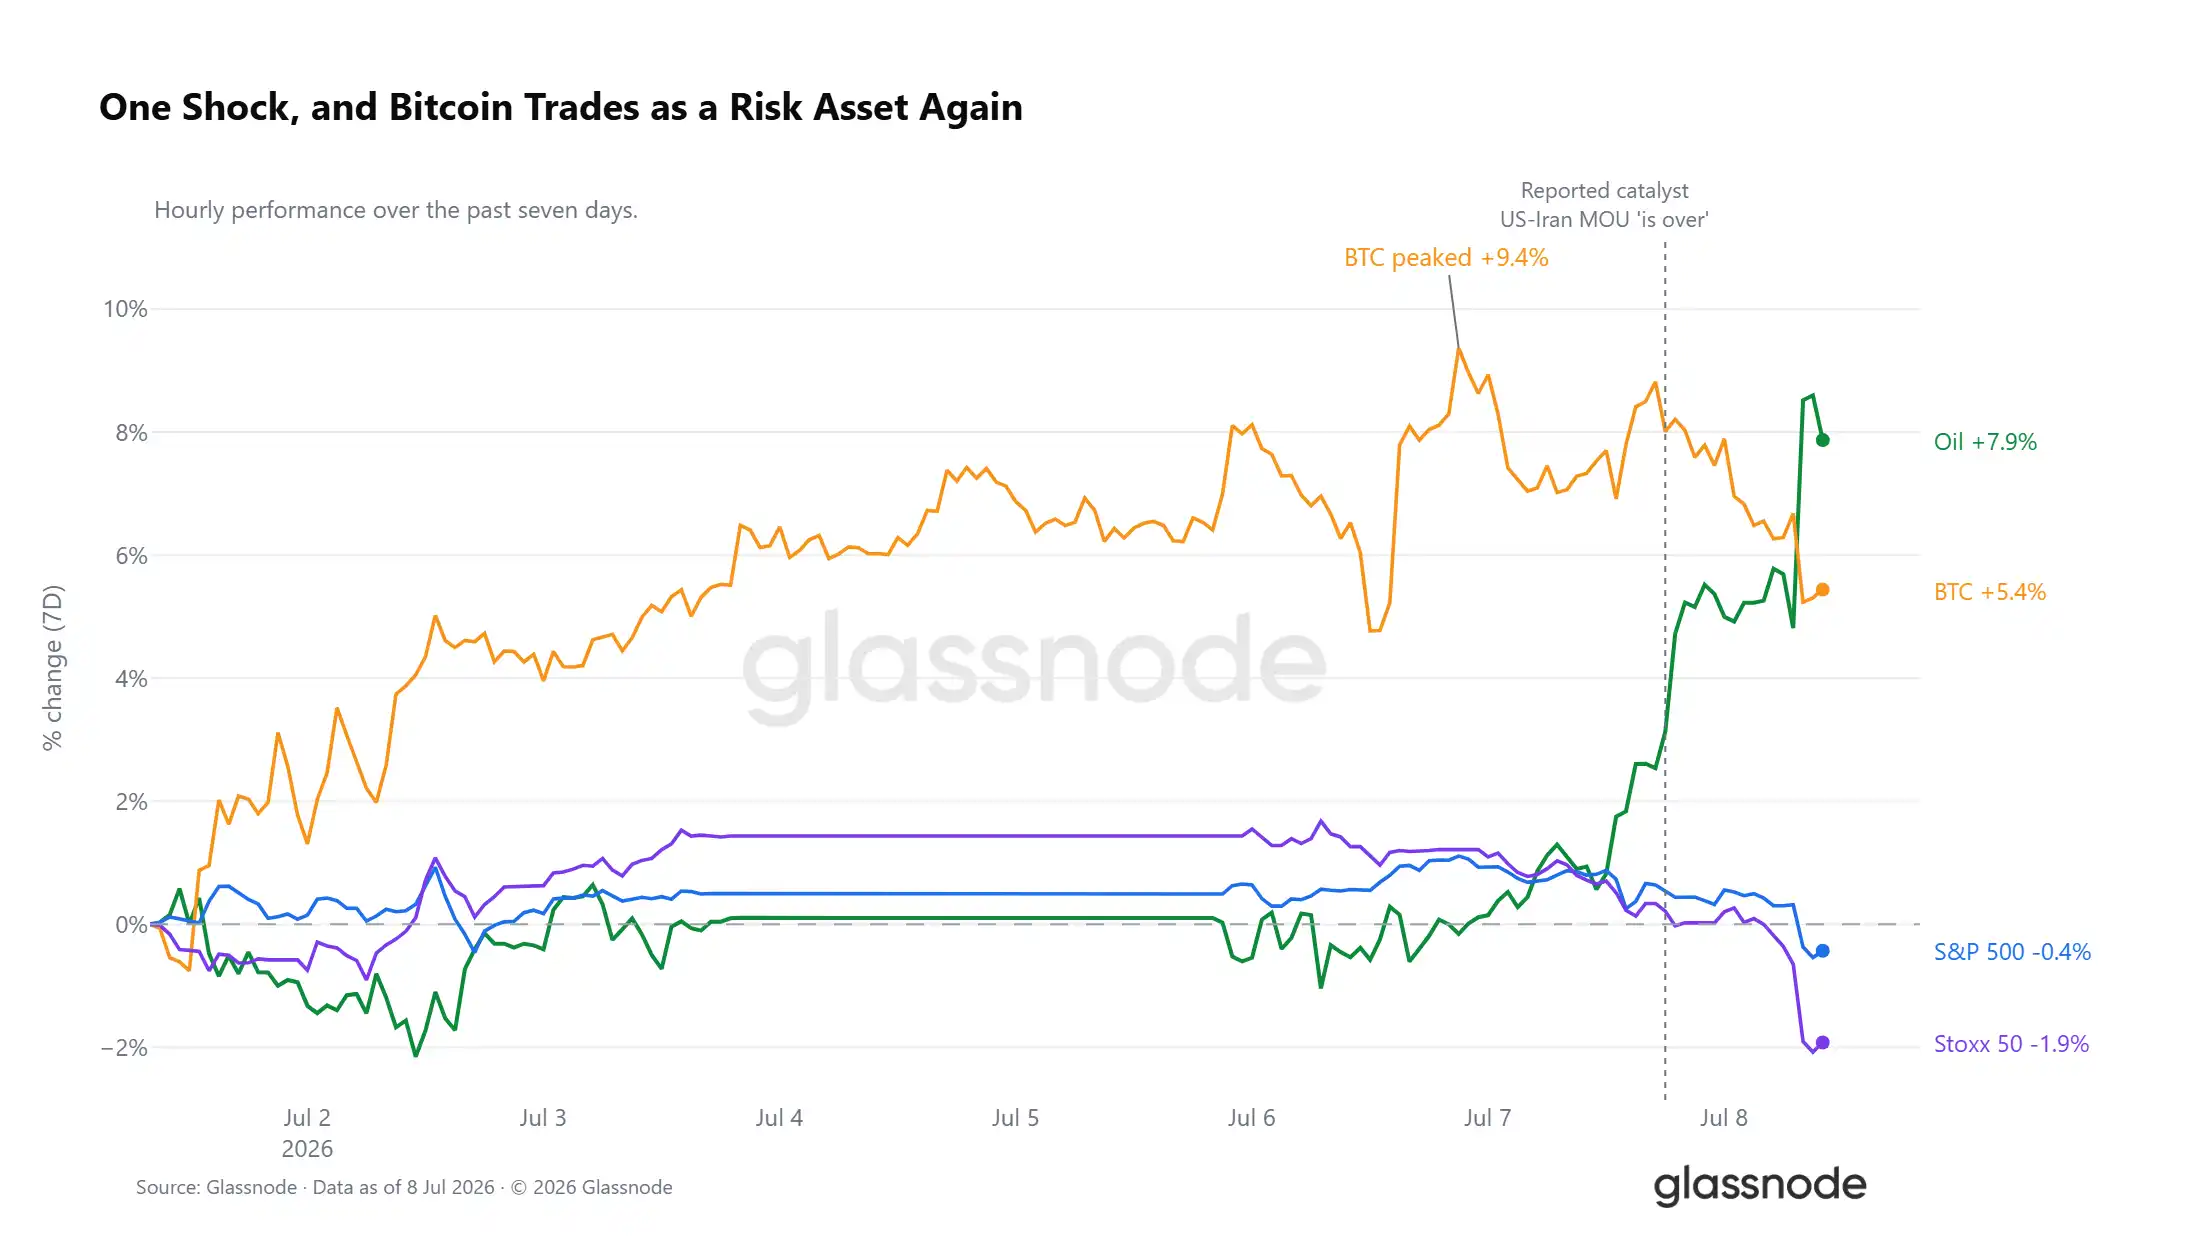
Over the past 7 trading days, WTI crude oil has cumulatively risen by 7.9%, with the majority of gains concentrated in recent sessions. News emerged that the US-Iran Memorandum of Understanding has expired, an impact that has rippled across all asset markets. Bitcoin's weekly gain peaked at 9.4% but has now retreated to a 5% weekly gain; the S&P 500 and Euro Stoxx indices have all turned negative, with European stocks leading the decline among global risk assets. Currently, Bitcoin's movement is highly synchronized with risk assets.
Liquidity Environment: Long-Short Contradictions Intensify

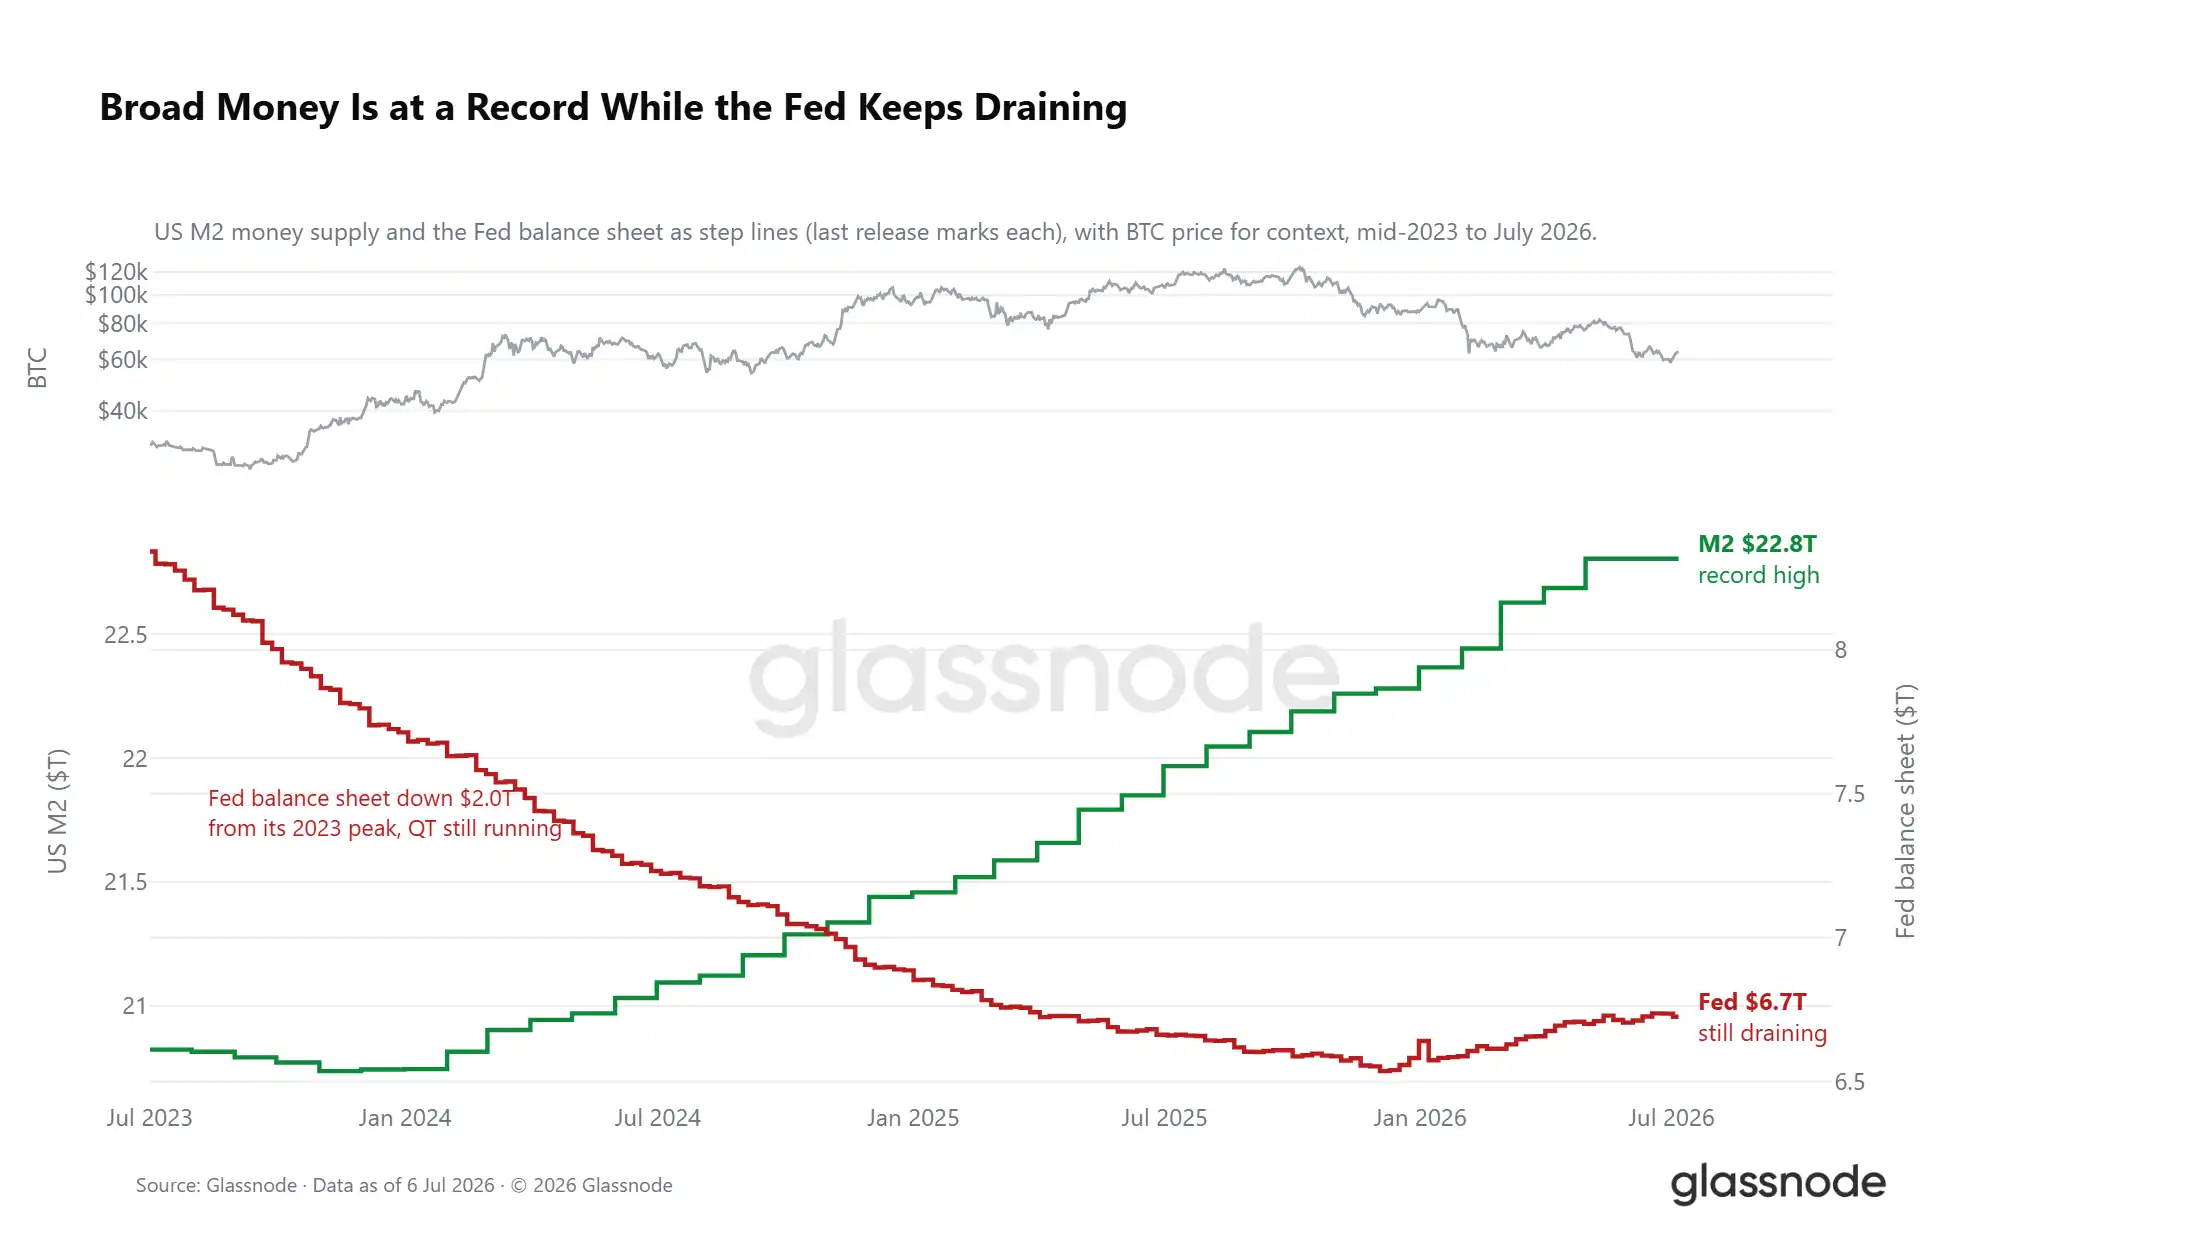
Amid external shocks from oil, the market's liquidity environment presents a contradictory picture. The total U.S. broad money supply (M2) has climbed to a new historical high of $22.8 trillion. Historically, broad money expansion cycles tend to boost market risk appetite; however, the Federal Reserve's balance sheet continues to shrink, with its current size down by $2 trillion from the 2023 peak. These two liquidity signals create a strong counterforce: the total broad money supply continues to rise while the quantitative tightening process persists, with real interest rates hovering near 1%, keeping the opportunity cost of holding non-yielding digital assets high. The macro-level favorable window is not completely closed but has not formed clear accommodative support either.
On-Chain Data

A Deeply Undervalued Zone Spanning Five Months

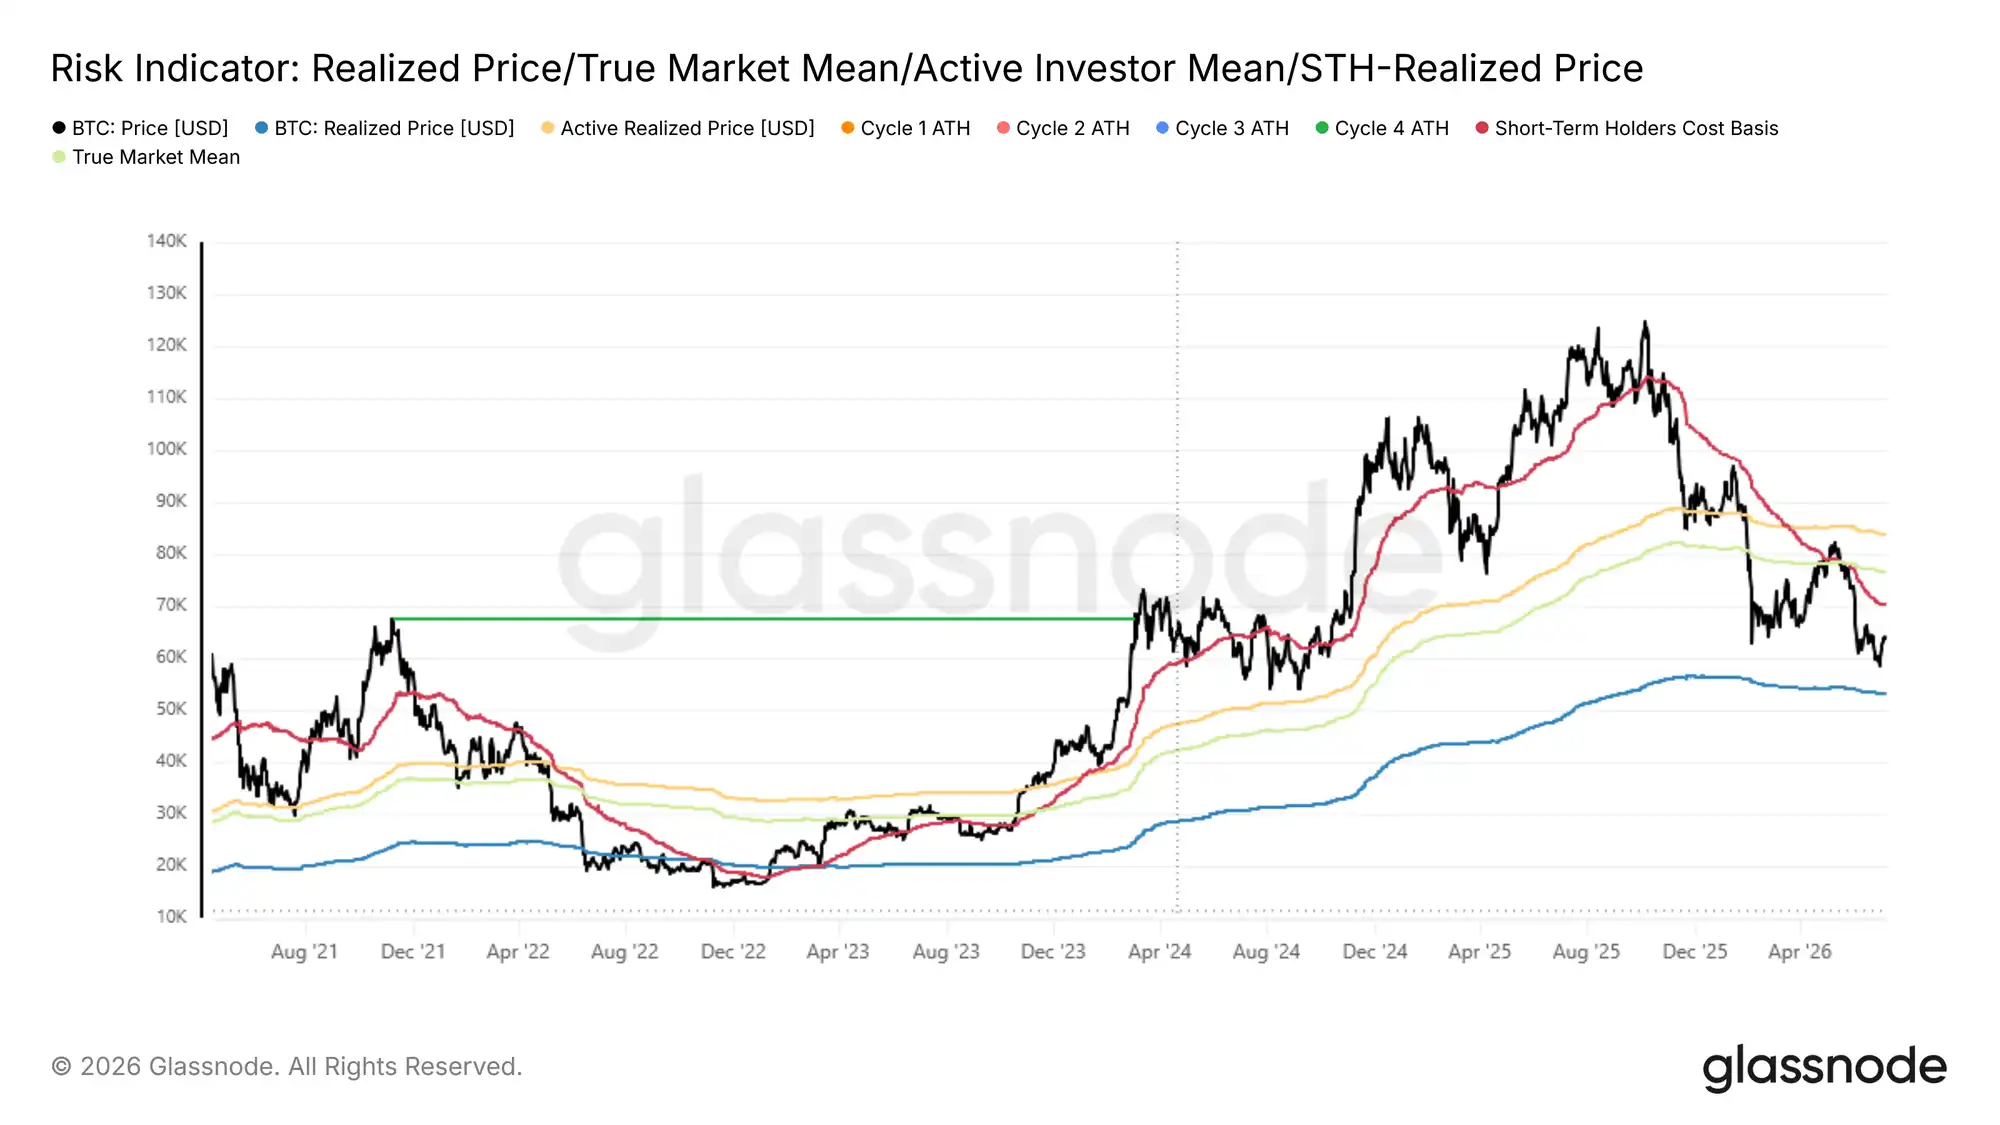
Over the past week, Bitcoin rebounded from $58,300 to $64,400, showing a short-term recovery, but the price remains significantly below the true market average of $76,600 and the short-term holder cost basis of $72,200. Only when the price reclaims these two key levels can the market exit the deeply undervalued zone; otherwise, the price action remains susceptible to declines catalyzed by external negative news.

The duration of this discount phase is noteworthy. Since early February 2026, the price has persistently traded below the cost basis of active investors and the break-even line for recent entrants, lasting nearly five months, which qualifies as a relatively long-lasting deep discount cycle in Bitcoin's history.

Continued high-volume coin distribution within a prolonged discount zone, with fresh capital consistently accumulating below the cost basis of earlier buyers and the entire market's active holdings, has historically formed the foundation for major cycle bottoms, offering long-term allocation appeal for value investors. Various metrics indicate the bottoming process has entered its later stages, but the possibility of a retest to $53,000 cannot be entirely ruled out.
Concentrated Stop-Loss Selling by Long-Term Holders with High-Cost Basis

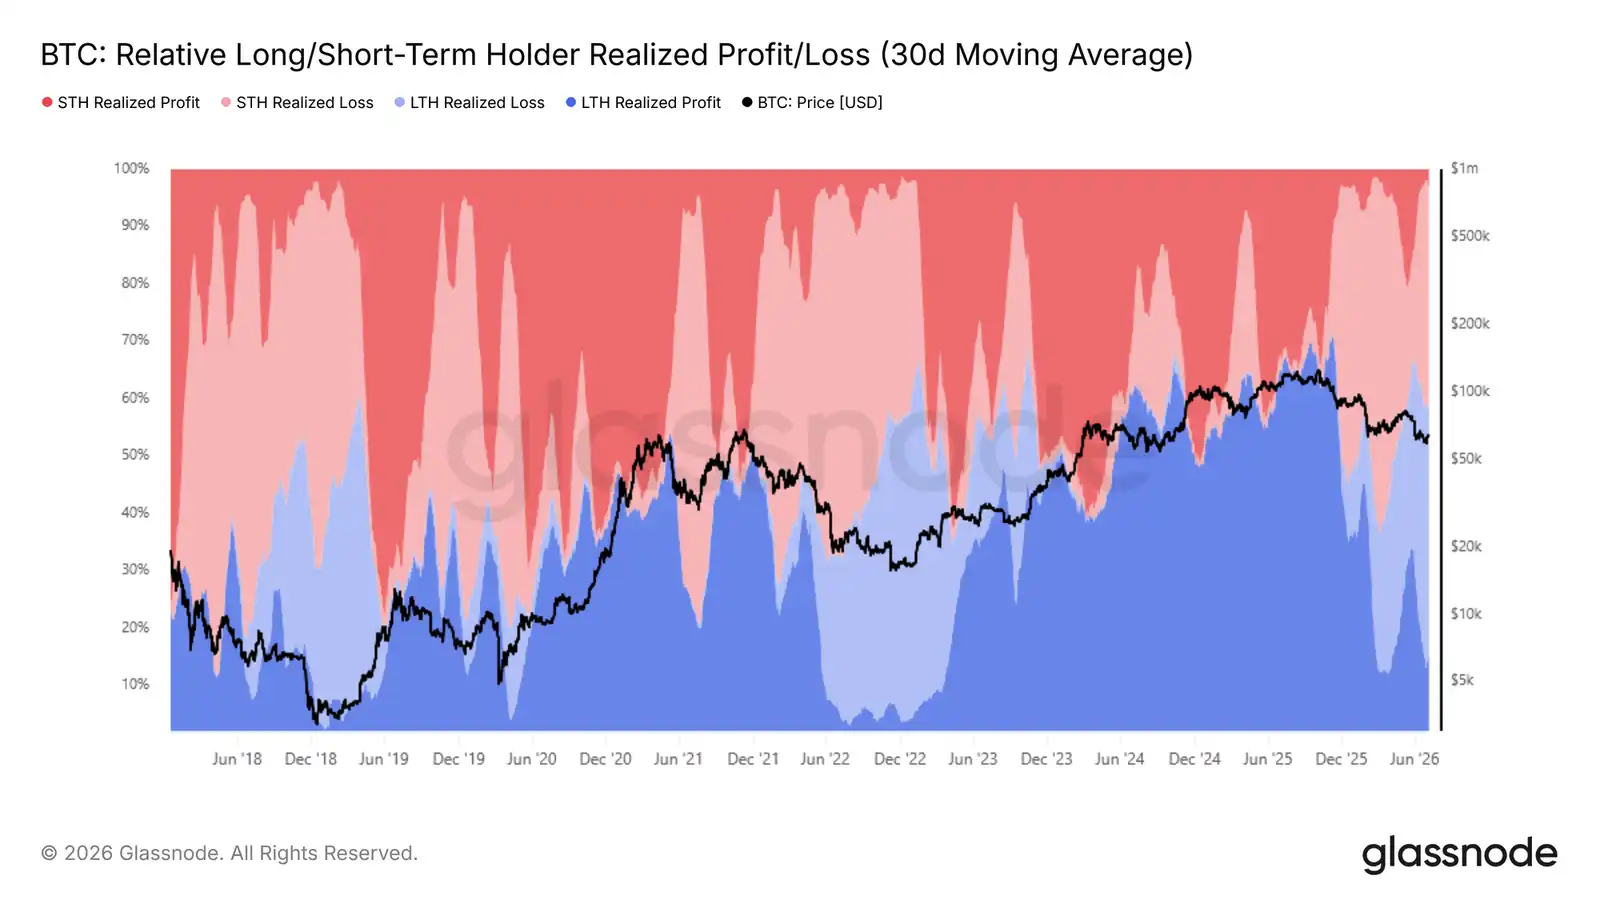
The market is constructing a cyclical bottom. The core question now is identifying the primary source of selling pressure. The relative indicator of profit/loss realization by long/short-term holders analyzes the distribution proportion of the entire market's on-chain realized profit/loss between these two holding groups, directly reflecting the scale share of each group's profit/loss realization.

After the price fell below the true market average, the 30-day moving average share of loss realization by long-term holders has climbed from around 15% in early February 2026 to the current 43%. Loss-driven selling pressure from this group has become the most dominant bearish force suppressing the price.

These investors mostly entered near the cycle highs. After enduring months of deep drawdowns, their confidence is gradually depleted, leading to concentrated exits. This coin structure directly explains why every recovery rally faces concentrated selling from deeply entrenched positions, preventing the price from solidifying above the upper bound of the current range.
Stop-Loss Selling Pressure Yet to Show Signs of Abating

Long-term holder loss realization has become the market's primary downward pressure. The next key observation is whether this selling pressure begins to subside.

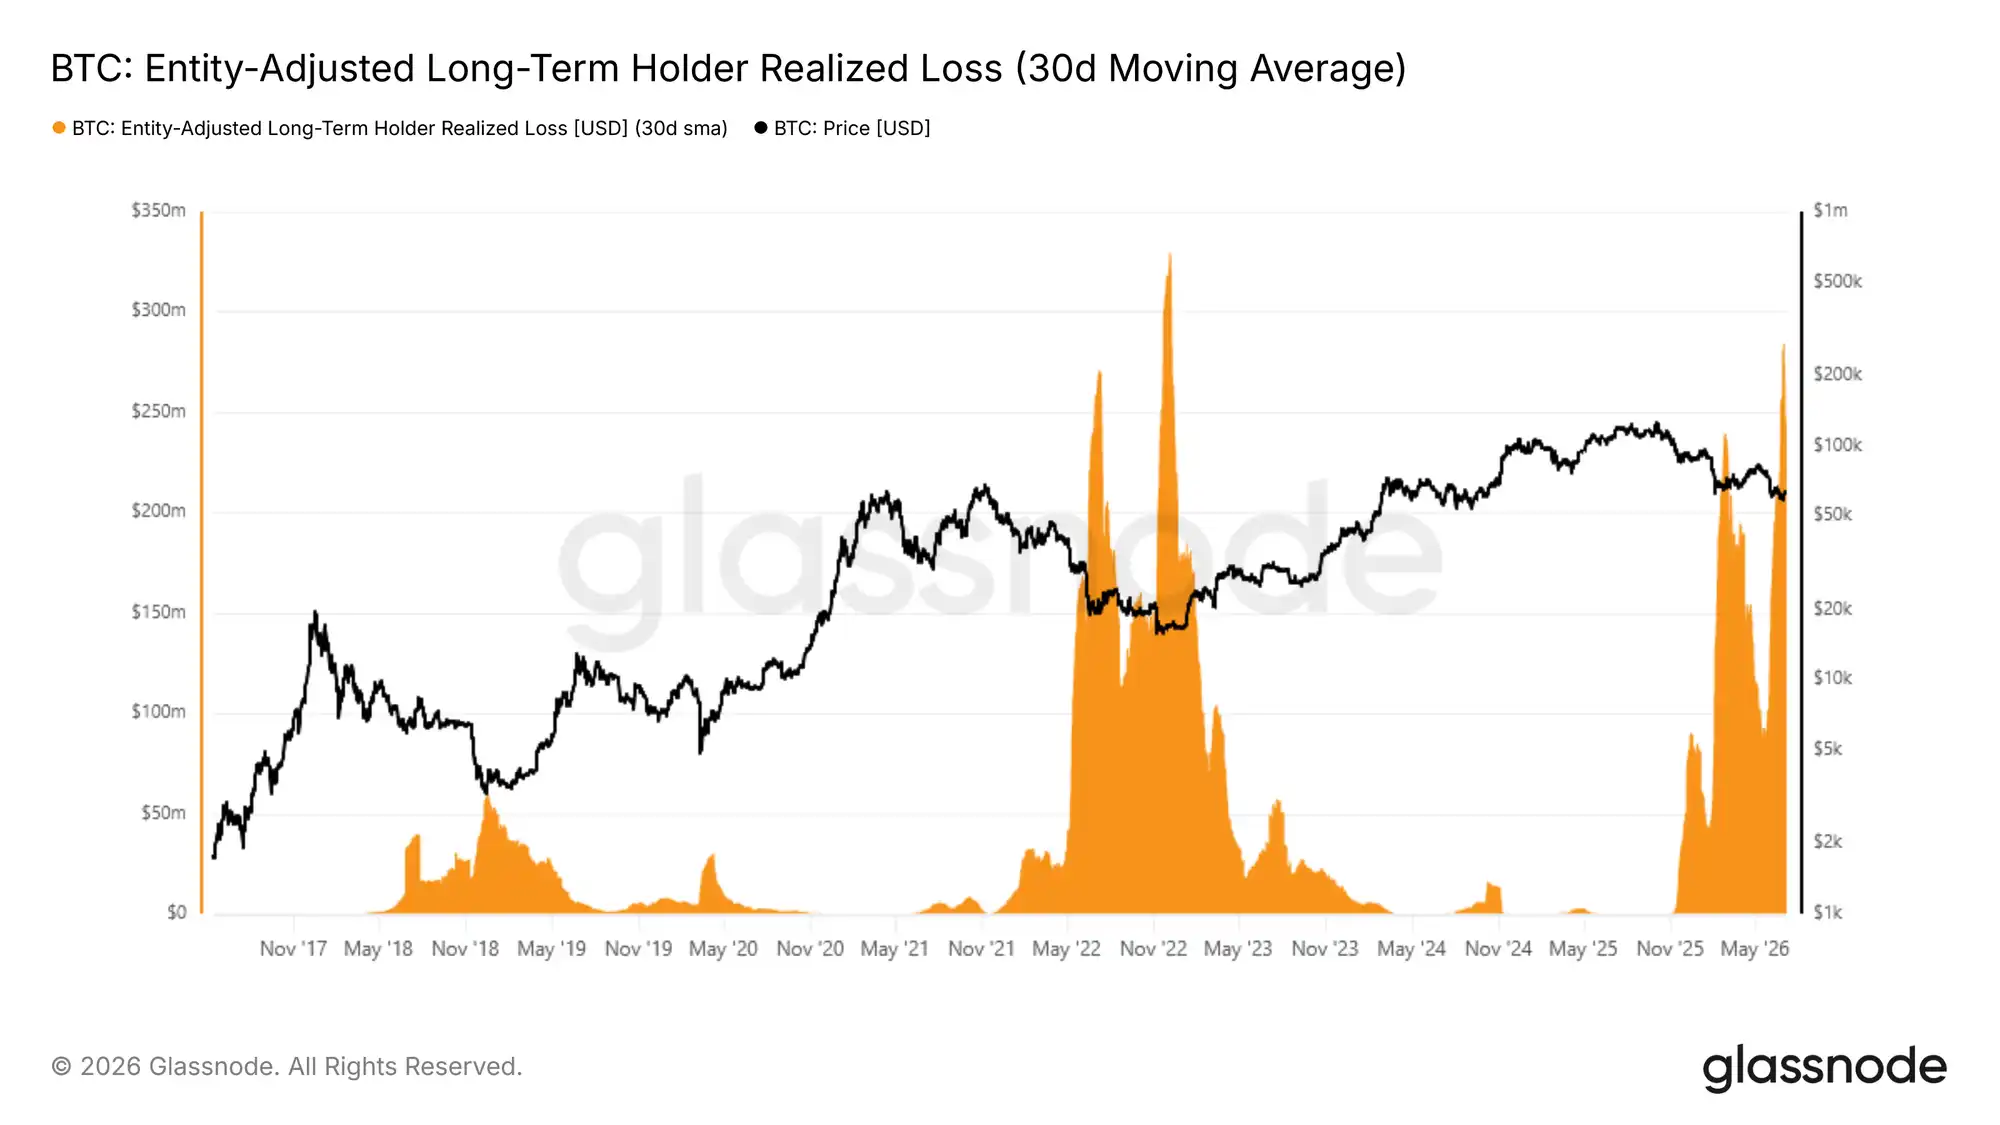
The entity-adjusted long-term holder realized loss indicator (30-day smoothed average) tracks the loss amount from sales by users holding coins for over 155 days, excluding internal address transfers, accurately reflecting genuine stop-loss exit behavior. This indicator recently hit a new daily peak, with daily loss realization volume around $280 million, the highest since December 2022, marking the second major wave of long-term holder stop-loss selling in this bear market.

The key difference is that after the first peak, selling pressure showed a temporary decline, whereas the current wave has yet to show a contraction in scale. Only when this indicator shows a clear downward trend will the market possess the foundational conditions for a shift towards a bull market. Its trajectory in the coming weeks to months will be the core signal for judging whether the market has truly completed selling pressure capitulation.
Off-Chain Markets

ETF Outflows Slow, But Outflow Trend Not Reversed

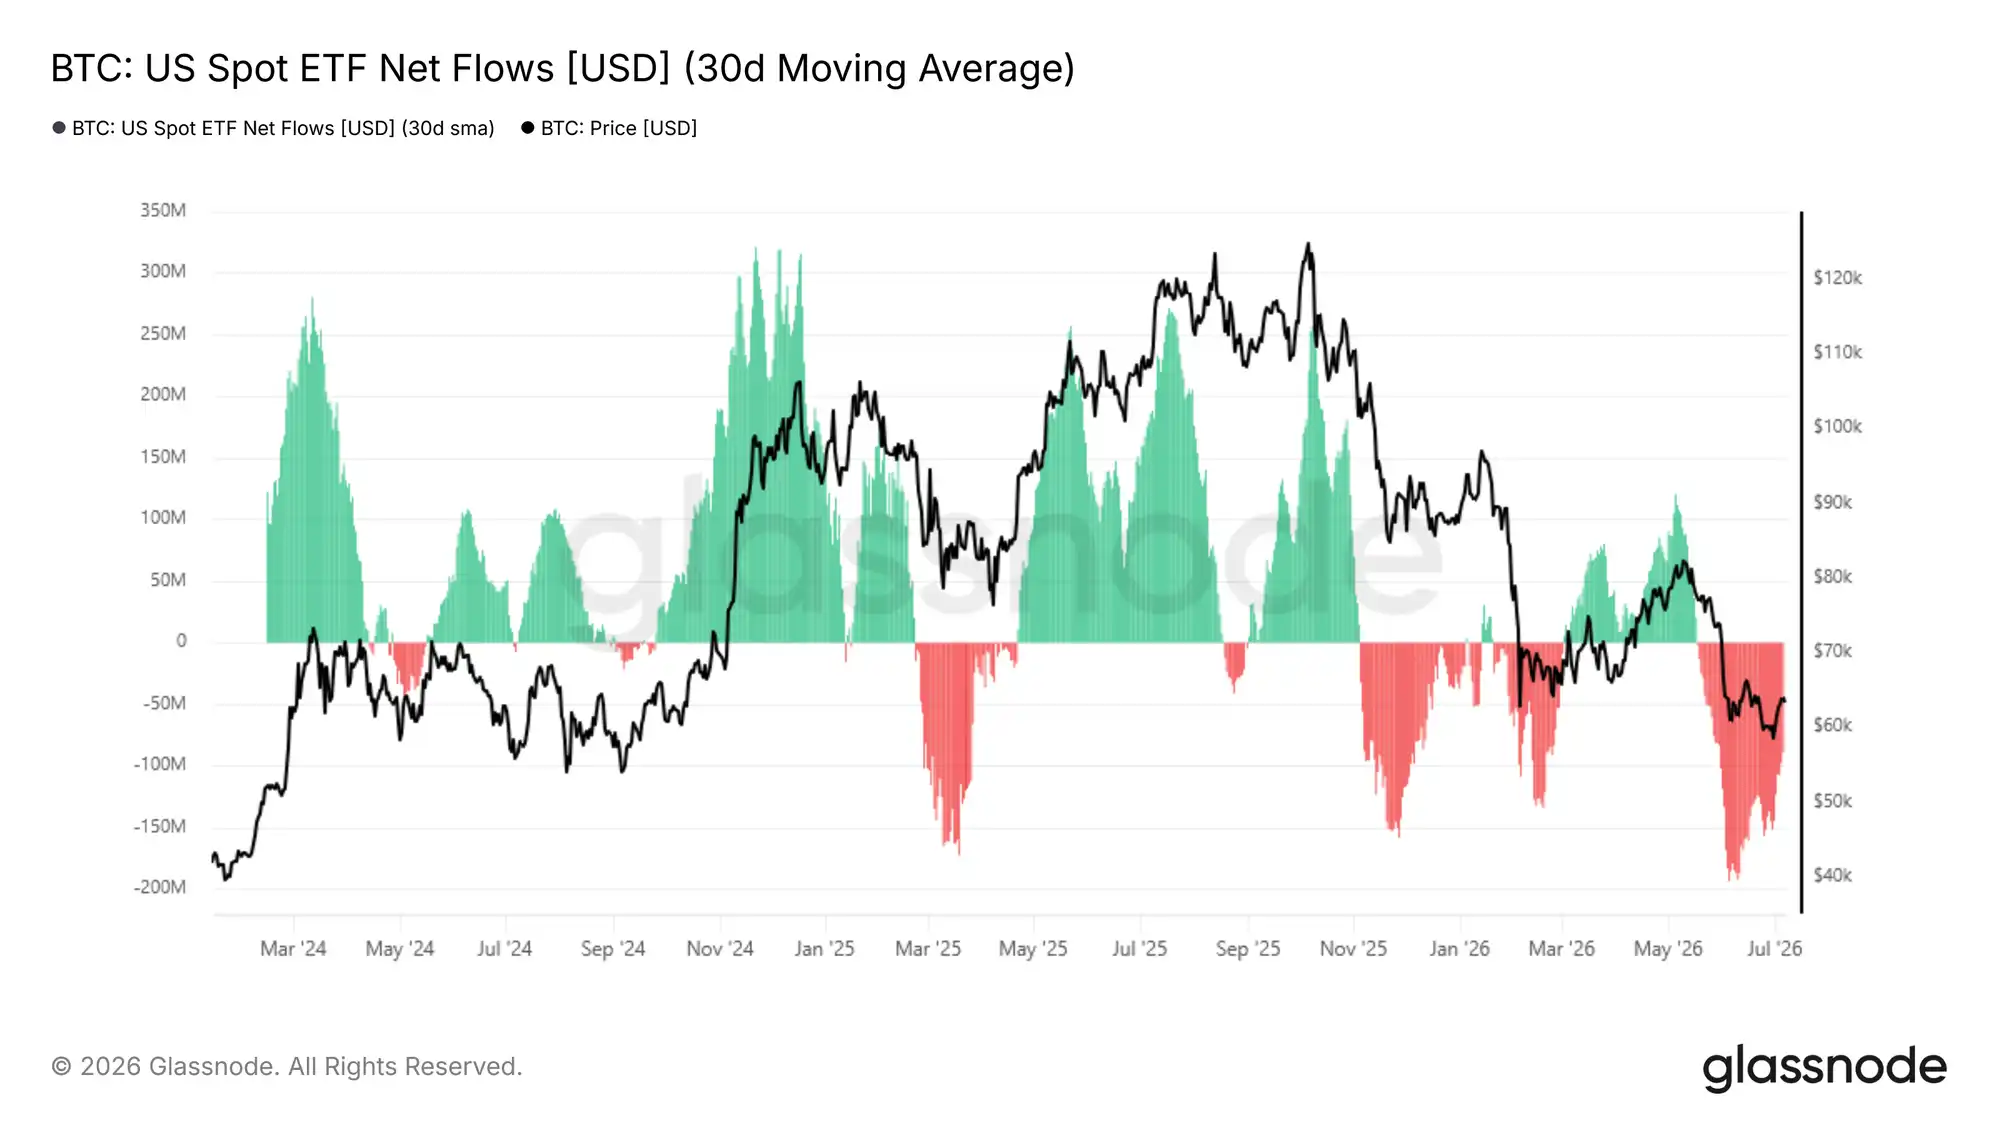
Shifting from on-chain to off-chain markets, spot ETF fund flows directly reflect institutional capital behavior. The 30-day moving average of ETF net flows indicates the daily net capital inflow/outflow from U.S. spot Bitcoin ETFs, smoothing out daily volatility to reveal underlying trends in institutional holdings.

Since mid-May 2026, this indicator entered a zone of monthly net outflows, with a daily outflow peak reaching $193 million in early June, now receded to a daily net outflow of $88.9 million. The moderation in outflow scale is a faint positive, but the market continues to see monthly capital outflows, and institutional buying demand has not stabilized. Only when the fund flow trend narrows consistently towards a balanced range can one reasonably anticipate a short-term expansionary rally.
Institutional Trading Volume Remains Sluggish

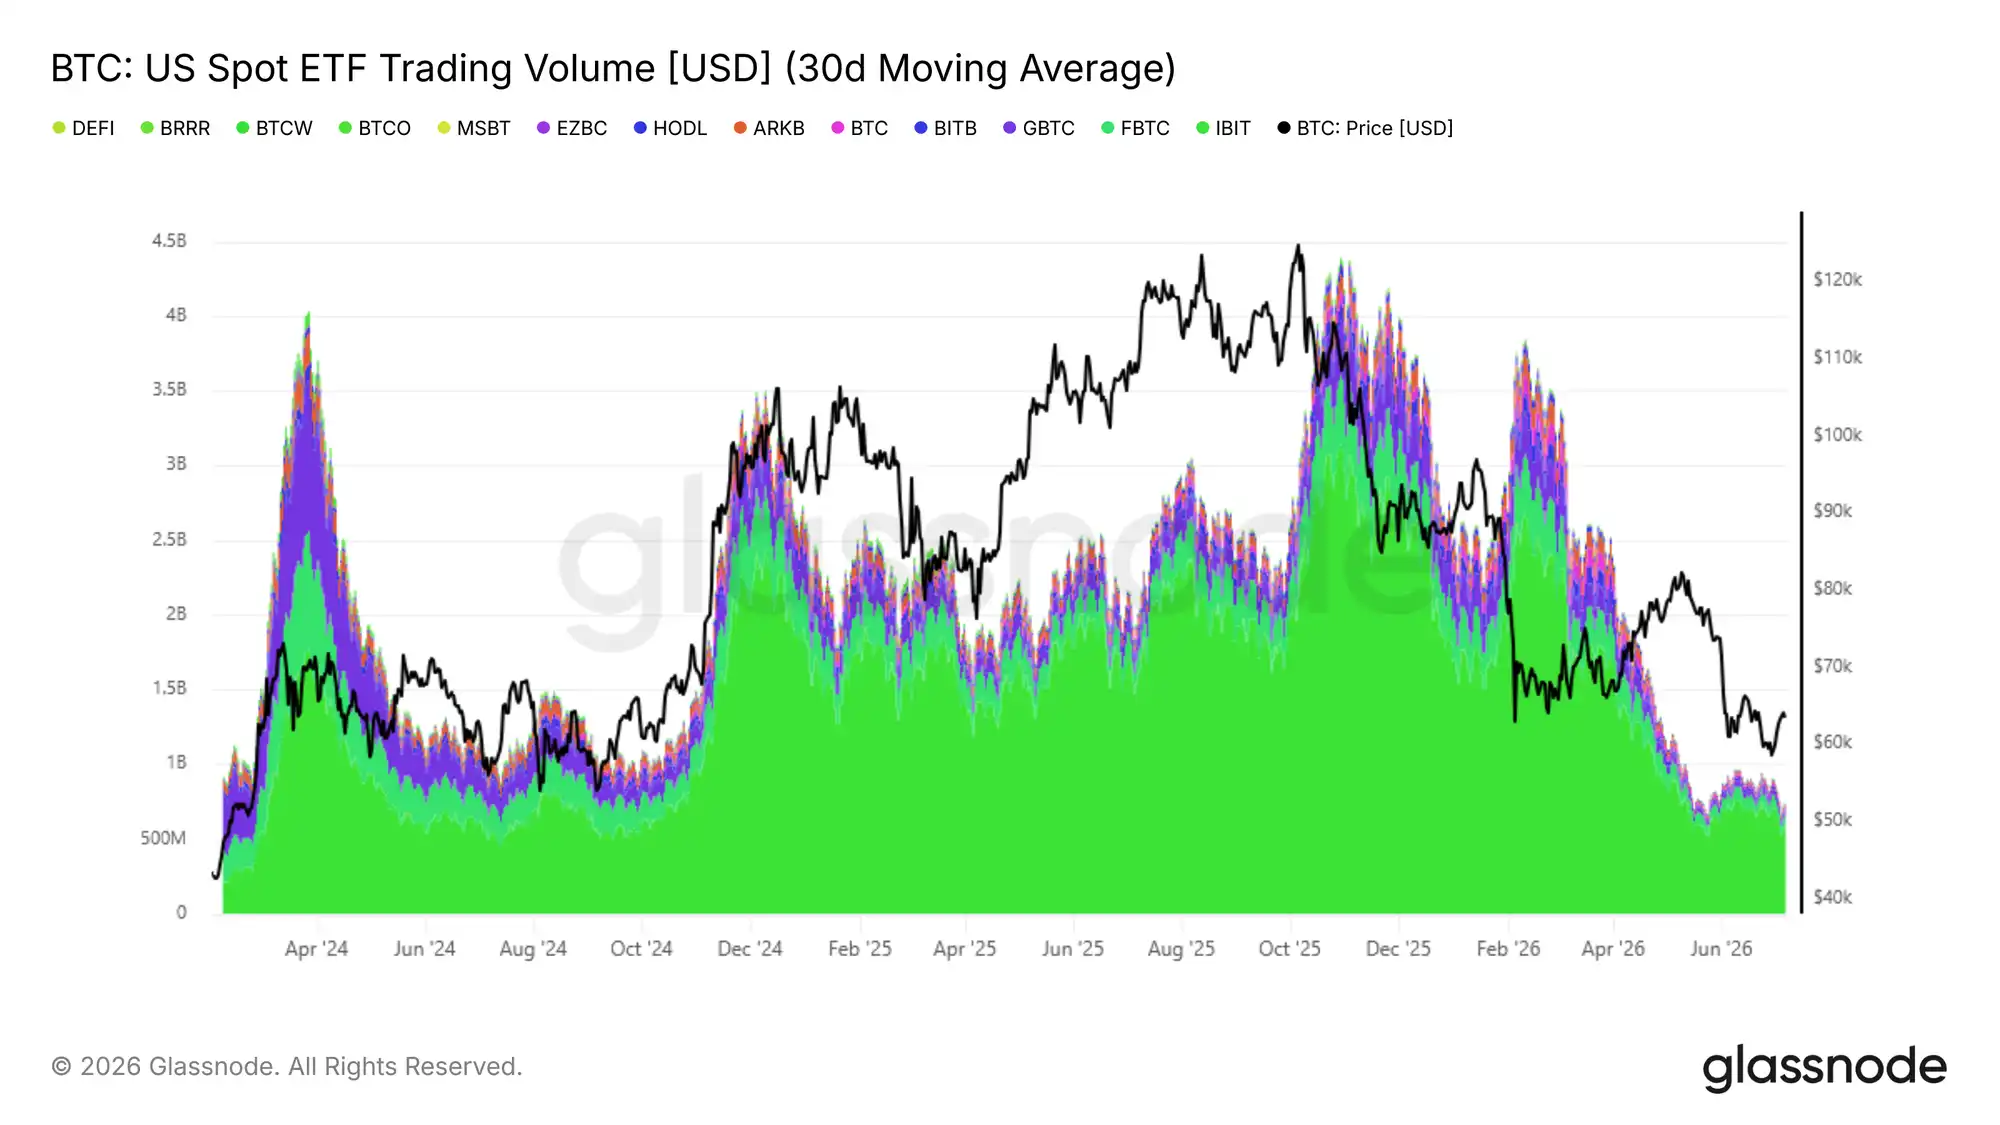
In addition to net flow data, U.S. spot ETF trading volume helps gauge the degree of institutional confidence recovery. The 30-day moving average of ETF daily trading volume currently fluctuates between $650 million and $950 million, a level comparable to Q4 2024, but also about 80% lower than the daily peak of $4.4 billion set in October 2025.

Current trading volume only represents basic institutional participation, remaining extremely low compared to bull market peaks, indicating that medium-to-long-term bullish confidence among ETF investors has not materially returned. Only when daily average trading volume shows sustained expansion *and* net outflow scale continuously narrows, with both signals appearing simultaneously, can institutional demand recovery be confirmed. Until both metrics improve in tandem, off-chain data aligns with on-chain indicators, suggesting the overall market remains in a bear market-dominated regime.
Derivatives Market

Short Covering, Positioning Shifts to Cautiously Bullish

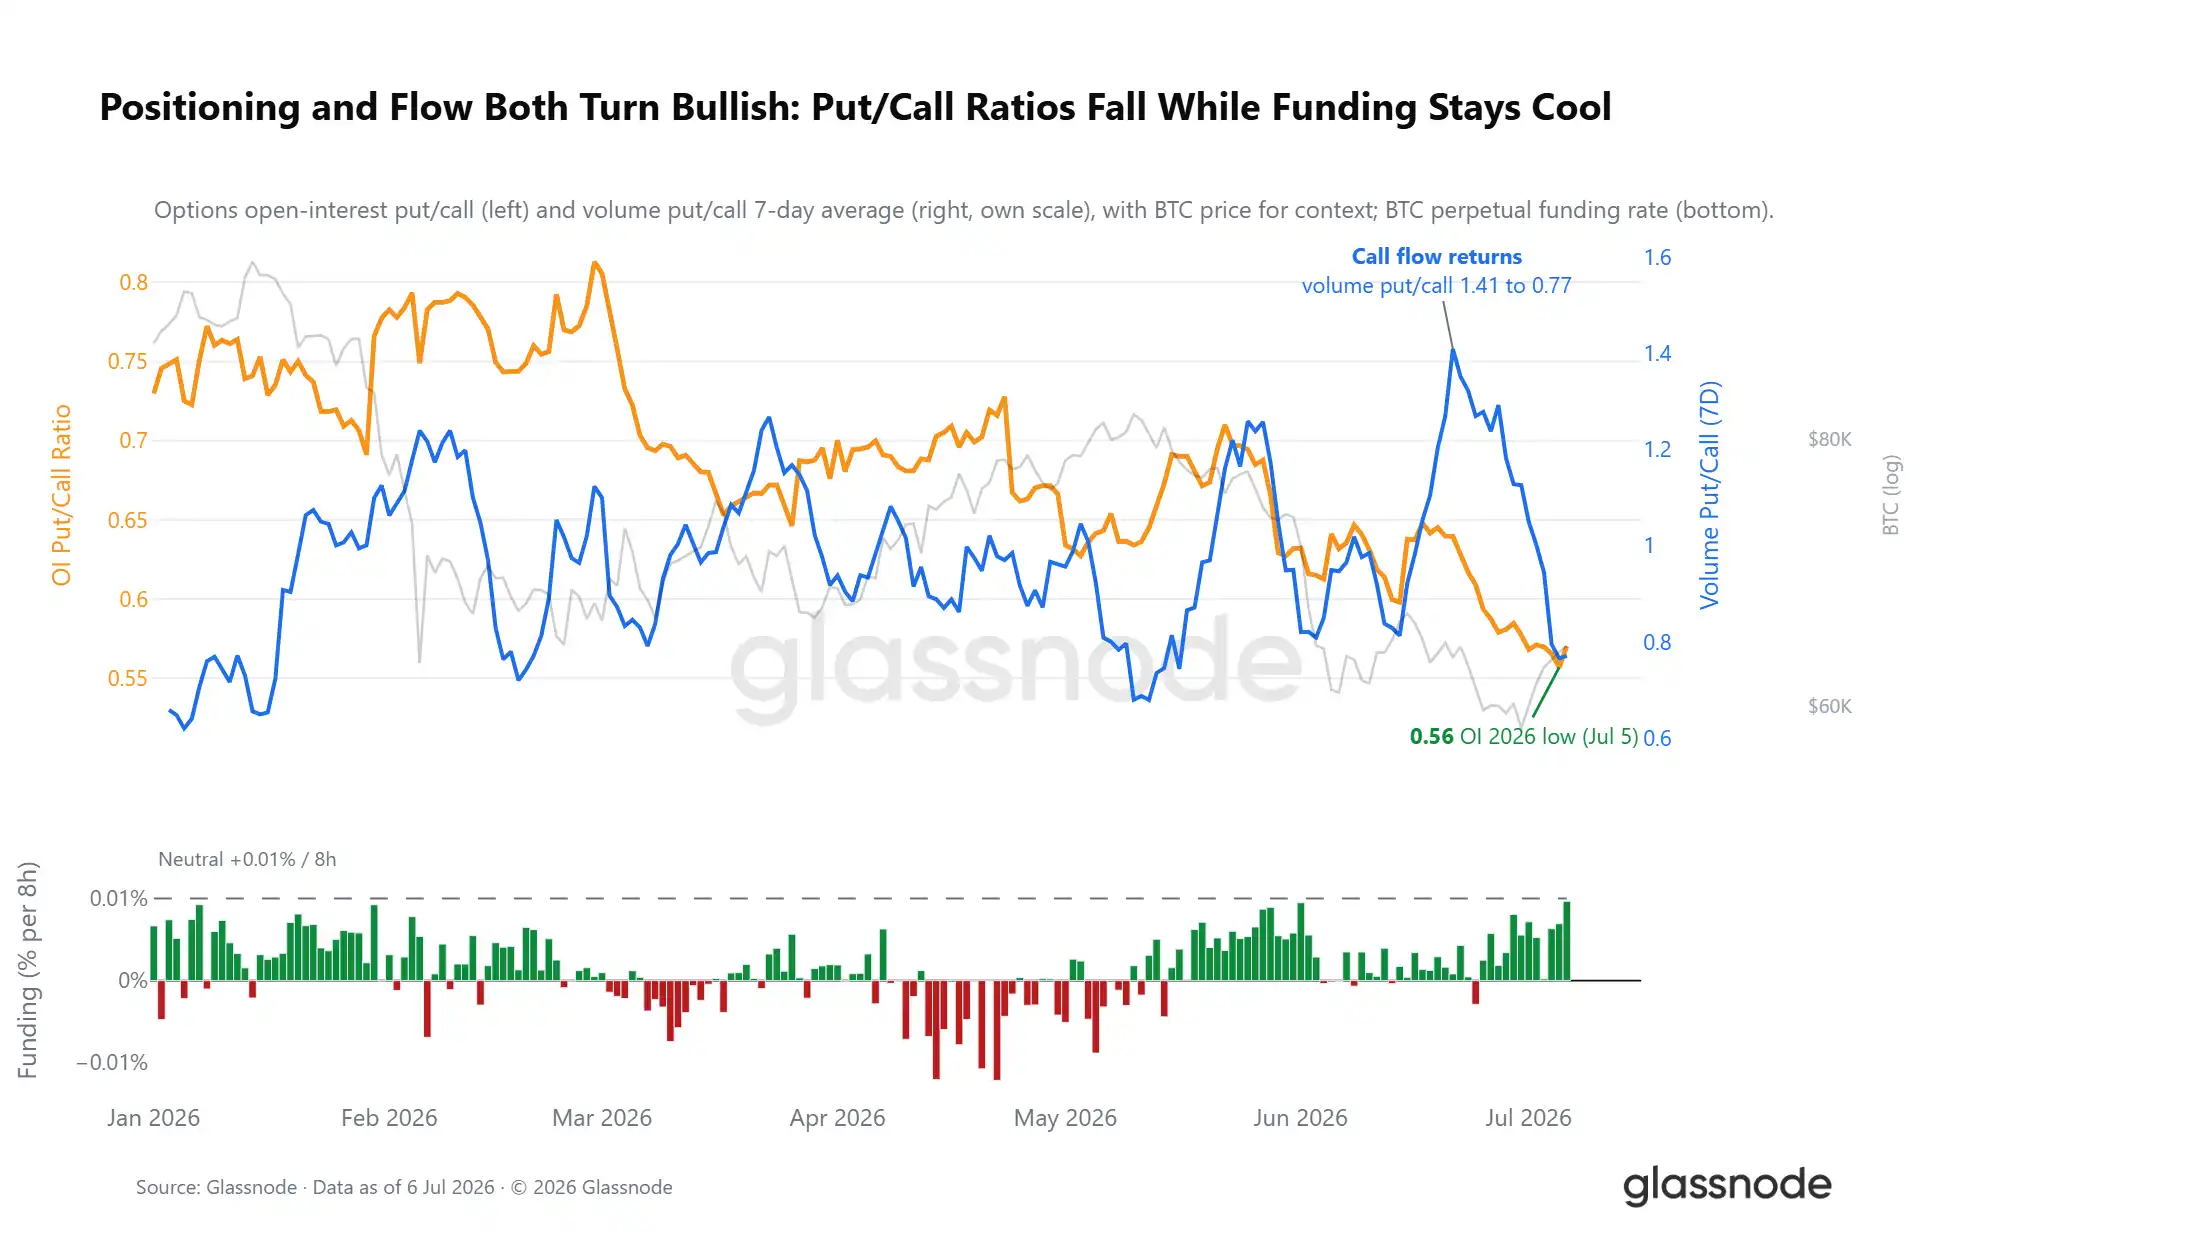
Despite the price action reflecting weak risk sentiment, derivatives positioning structure has already shown a reverse shift. The put/call open interest ratio has dropped to 0.56, the lowest level in 2026, meaning the market currently has one put contract for every two call contracts. Options trading flow corroborates this trend: two weeks ago during Bitcoin's second retest of lows, the market frantically bought puts for hedging, causing the put/call trading ratio to surge sharply; as call buying steadily returned, this ratio quickly declined, even though the spot price has only partially recovered its losses.

Perpetual swap funding rates also support the positioning shift. The average perpetual swap funding rate has long been below the 0.01% long-short equilibrium line, far from levels seen in crowded long trades. The derivatives market has completed its short risk clearance and has turned cautiously bullish overall amid external negative shocks, a stark contrast to the crowded short positioning structure before the previous major decline.
Options Skew Still Prices in Downside Risk

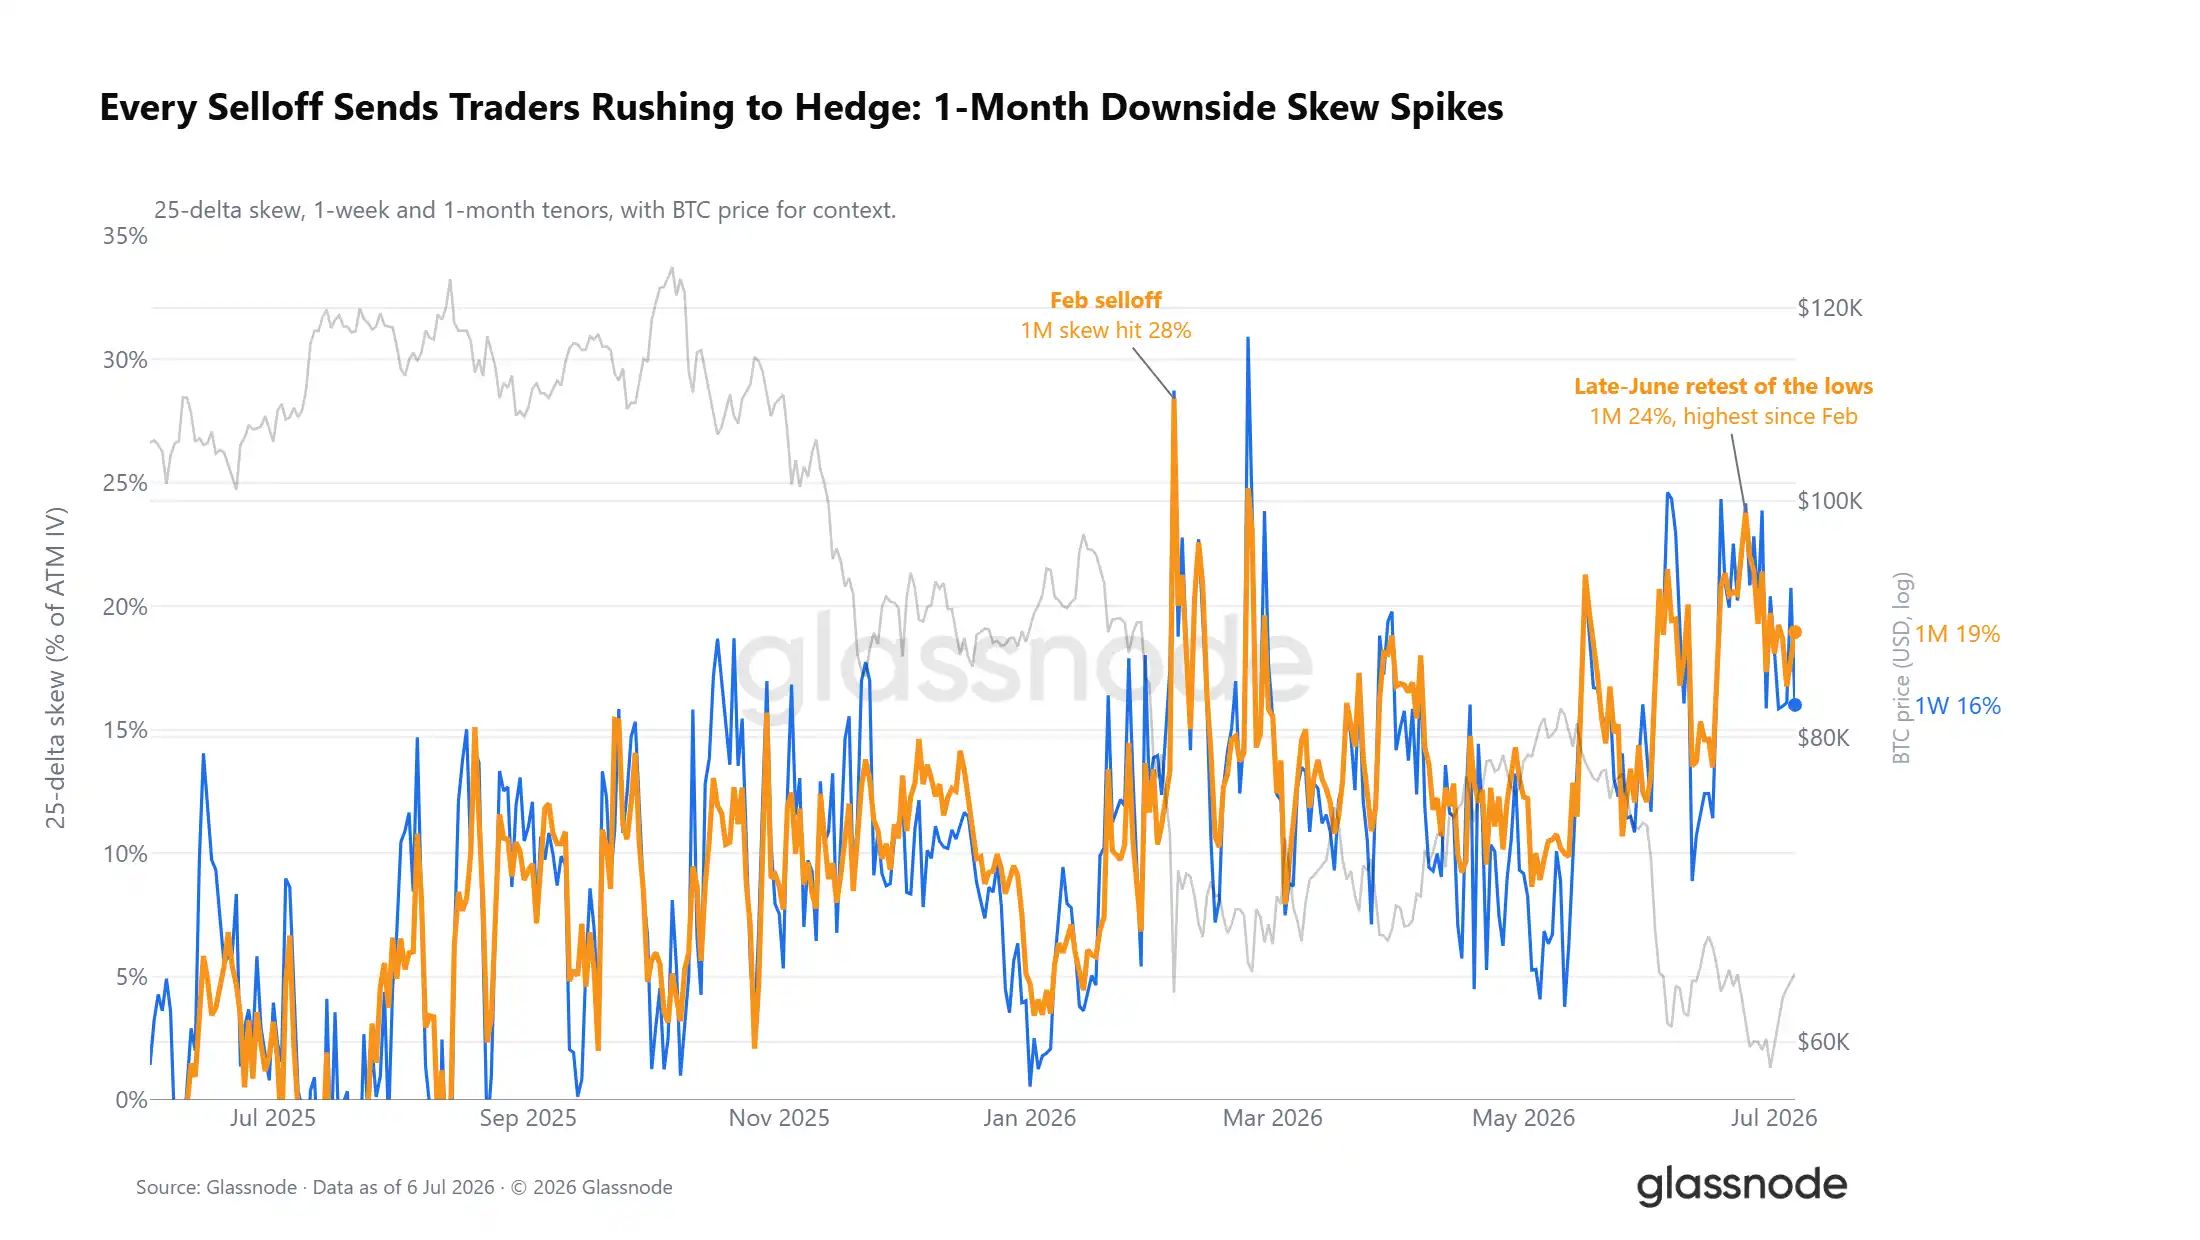
While overall positioning leans bullish, the options volatility skew sends an opposite signal. The 25-delta volatility skew indicator (premium for downside protection relative to upside gain) maintains a premium across all expiration dates. Every sell-off this year has pushed this premium higher, and at the end of June it surged to 24%, marking the strongest defensive sentiment for near-month contracts since the February crash. Even with the market leaning long, traders are still willing to pay a premium to buy downside hedging instruments.
Spot Price Deviates from Max Pain Price

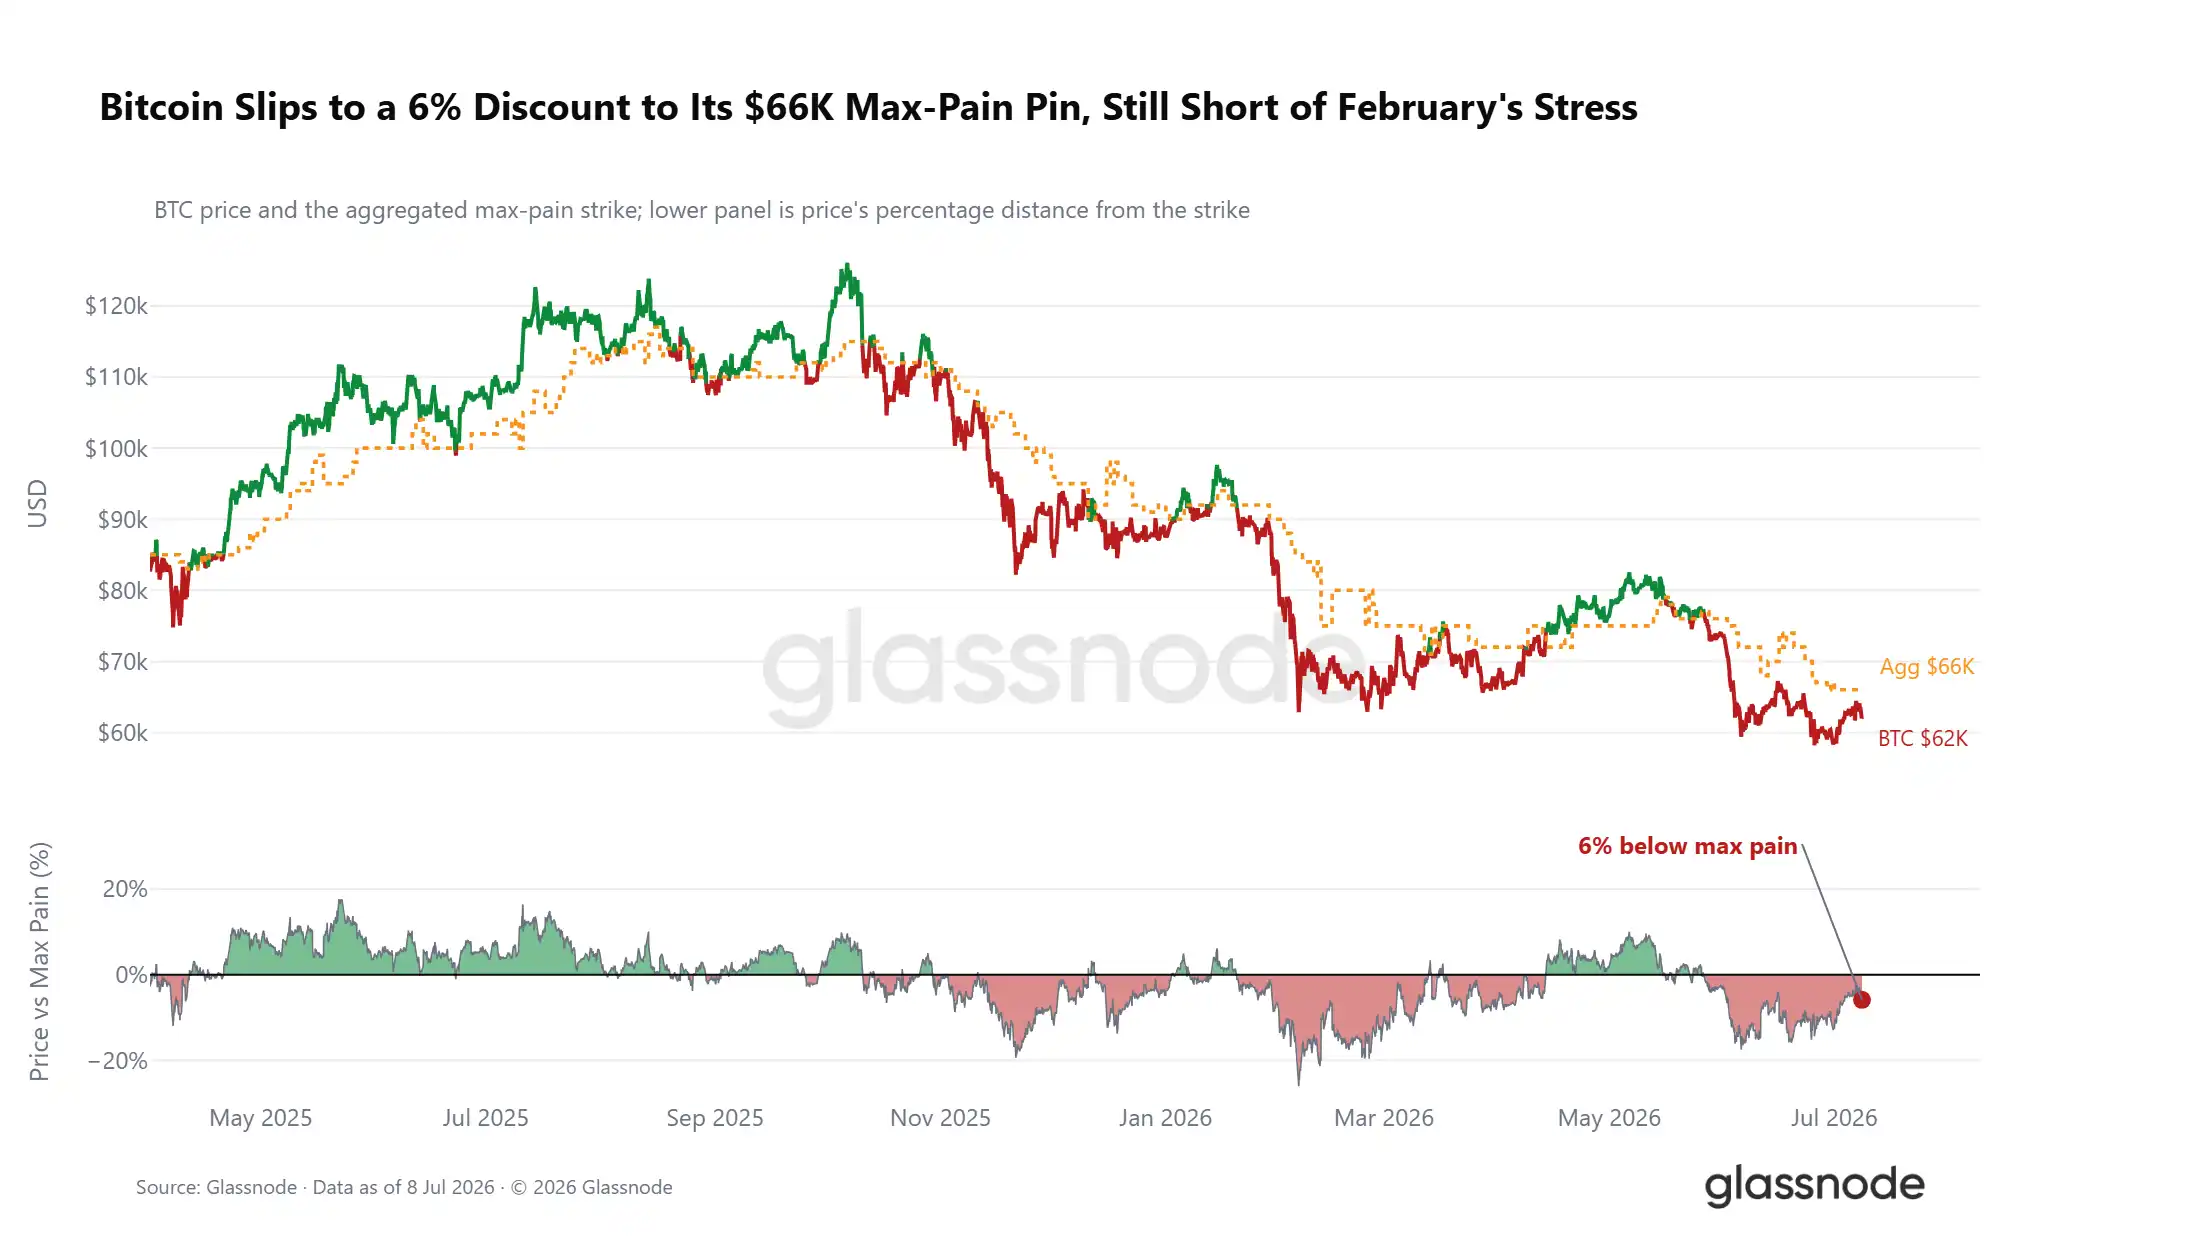
Beyond positioning and volatility skew, the relative position of the spot price to options market structure offers further clues. The current Bitcoin spot price is about 6% below the aggregate market max pain price of $66,000. The max pain price is the strike price at which the most open contracts expire worthless at expiration, and price action tends to gravitate towards this level before expiry.

This week's decline further widened the spread between spot and max pain, but the deviation is far from the extremes of the February crash, only residing in the middle of the 2026 price action range. Throughout the year, the max pain price has consistently acted as a gravitational center for price action, with the spot price oscillating around it, rarely deviating significantly for extended periods. If the price consistently holds above $66,000, short-term market signals would turn optimistic; if the spread widens further, it would reinforce the overall defensive trading sentiment in the options landscape.
Cost of Crash Hedging Continues to Decline

While signals from volatility skew and positioning diverge, the trend in absolute cost of hedging downside risk is clear. With the market's slight rebound, the pricing on the put side of the one-month volatility curve has shifted lower overall, with implied volatility for puts 5% below spot dropping significantly; the lowest pricing points on the volatility curve are concentrated in far out-of-the-money call options.
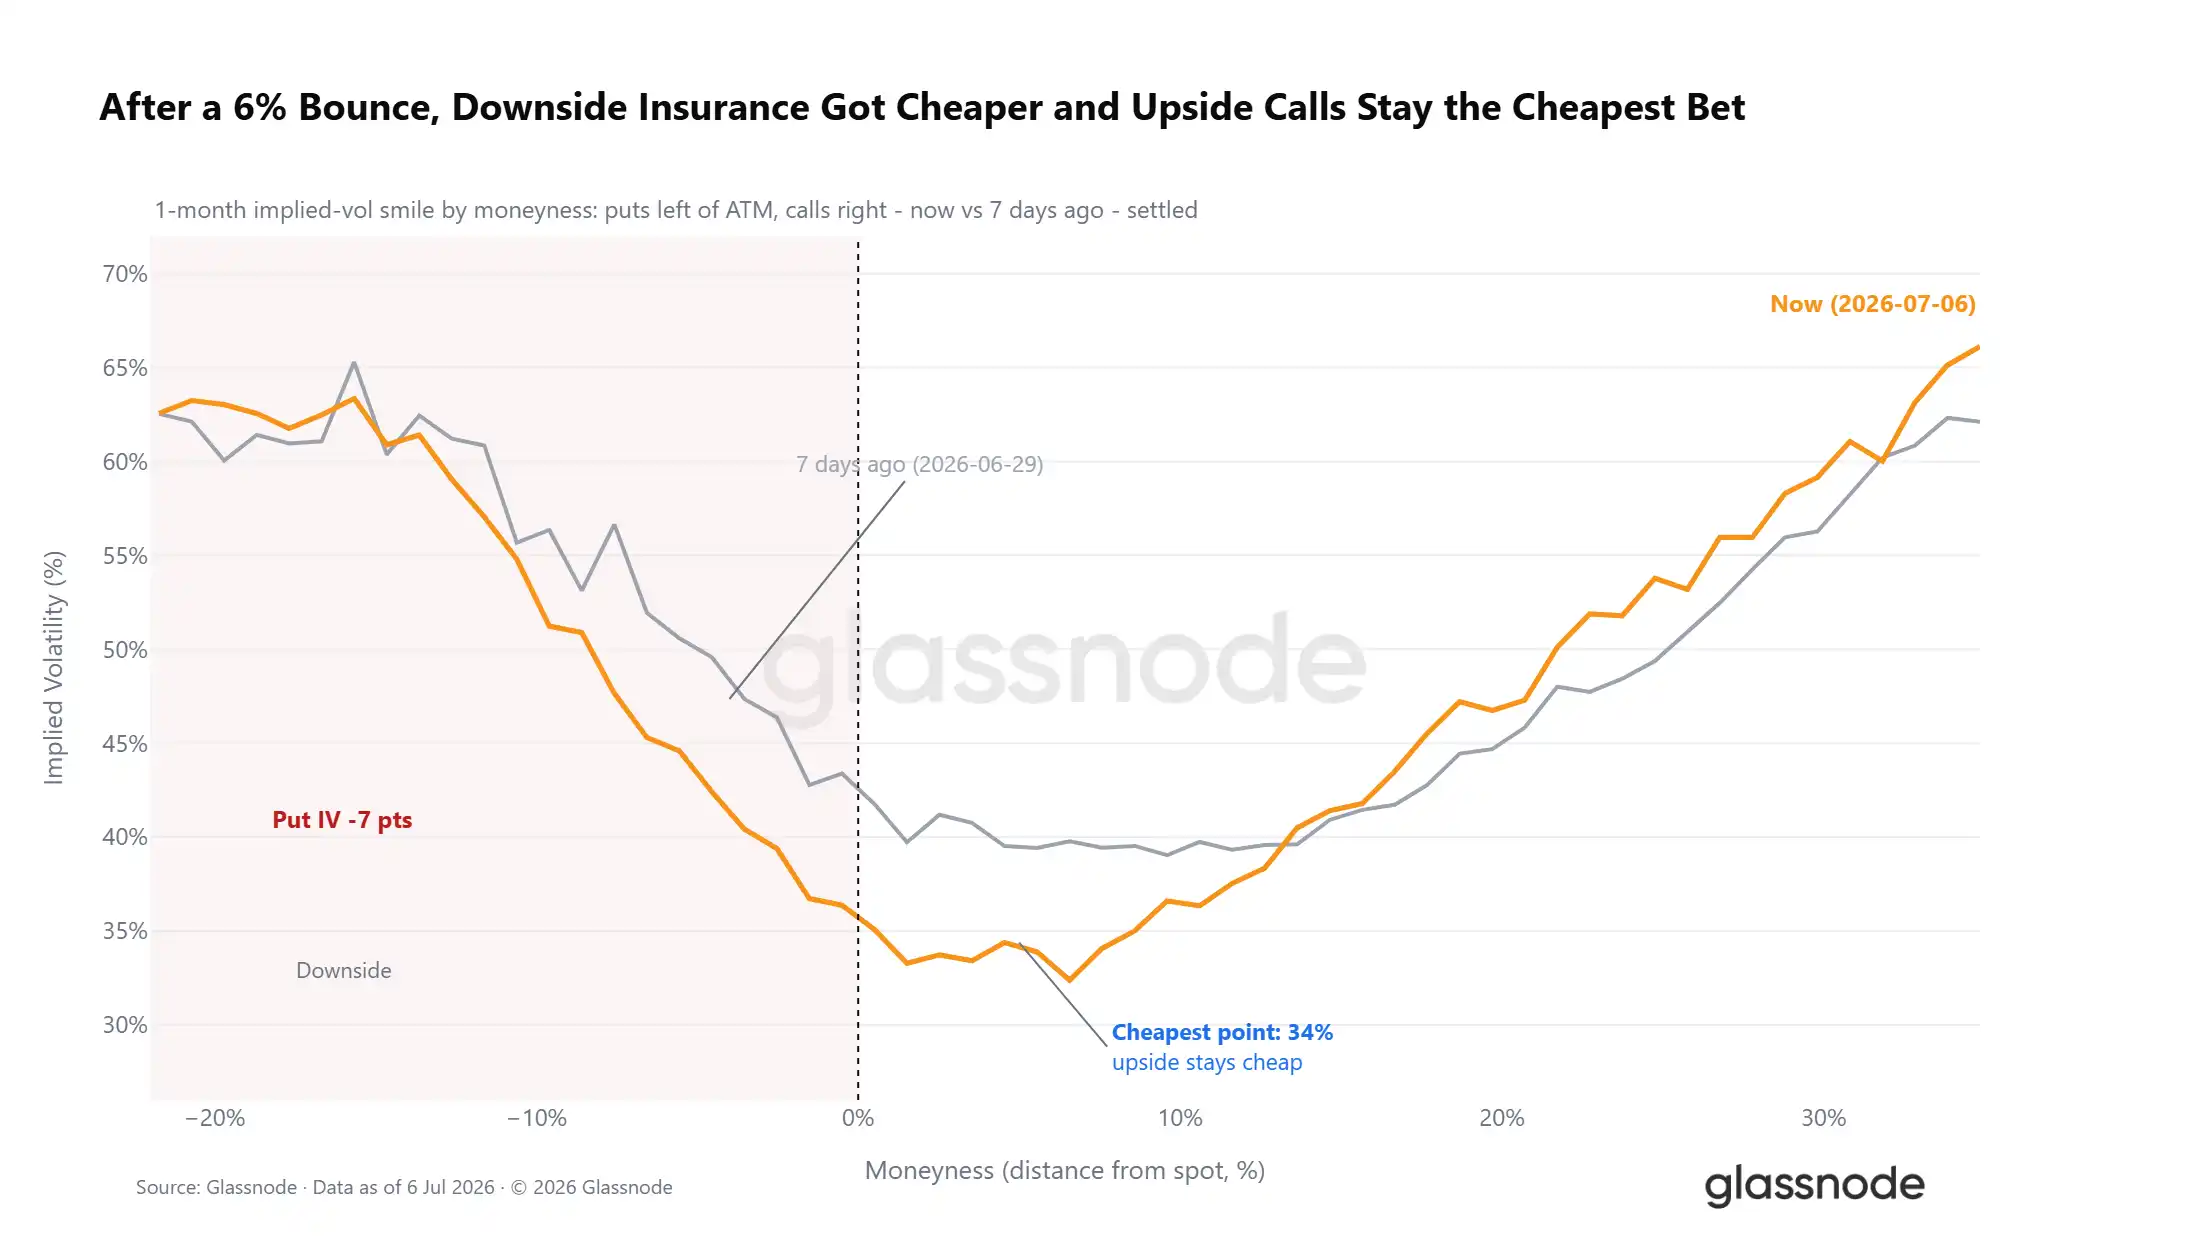
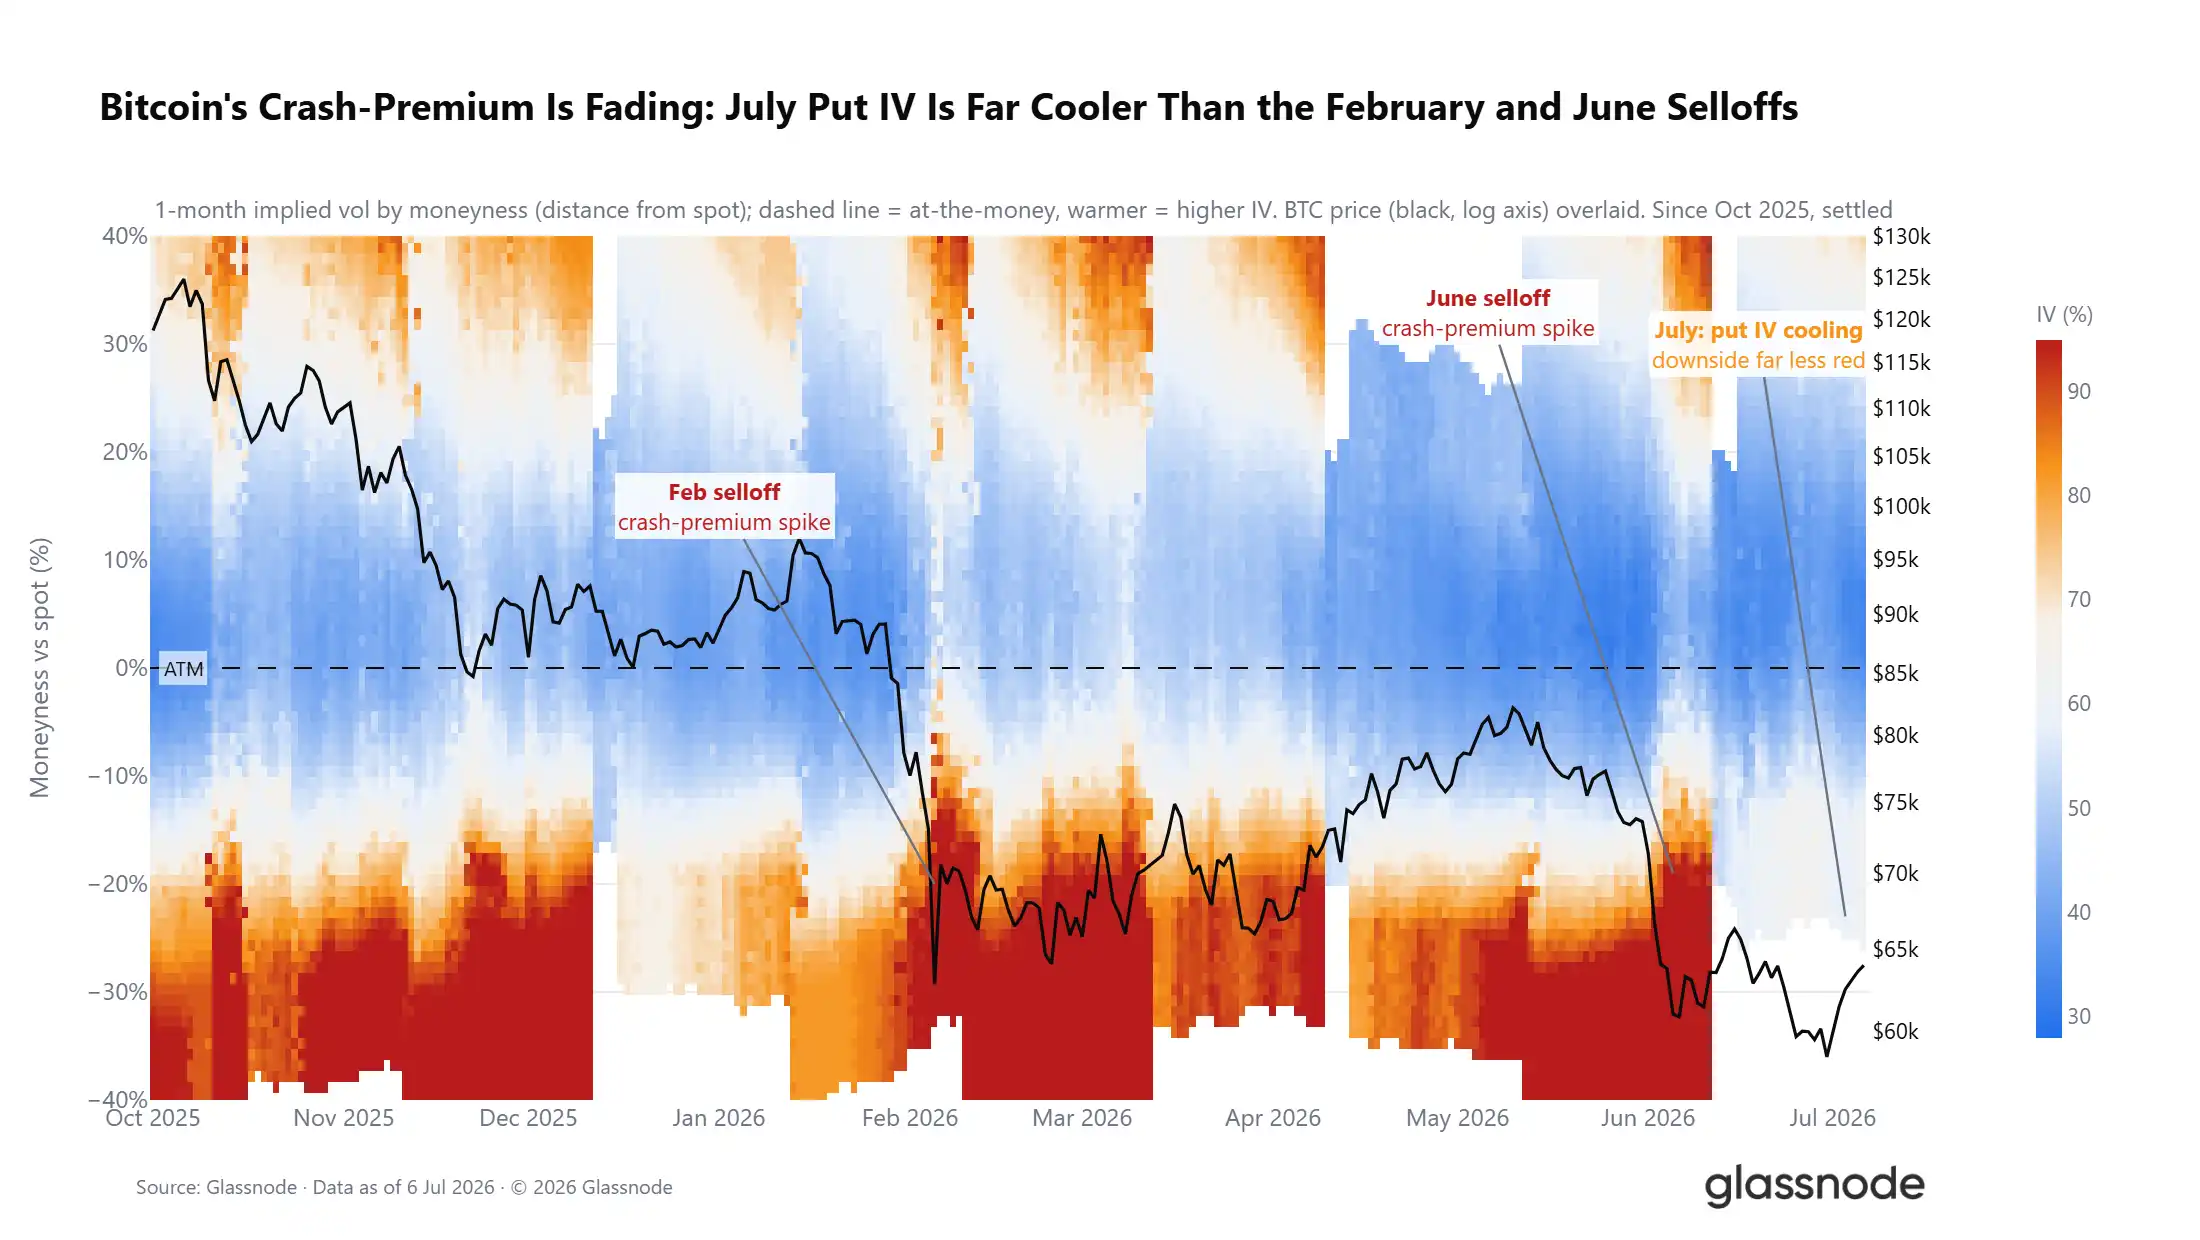
Overall defensive market sentiment persists, but the absolute cost traders pay to hedge against declines has noticeably decreased. Extending the time horizon makes this trend clearer: the volatility premium driven by extreme put hedging demand during the February and June crashes has gradually subsided entering July. The DVOL volatility index has fallen to a 12-month low, as the market enters a low-volatility regime. While cautious sentiment still dominates price action, hedging demand is gradually fading.
Summary

Integrating data from on-chain, off-chain, and derivatives dimensions, the market clearly exhibits late-stage bear market characteristics.

On-chain data shows a prolonged deep undervaluation cycle lasting five months continues, with long-term holder daily stop-loss realization volume rising to $280 million, indicating large-scale coin distribution is underway; however, a sustained decline in this stop-loss indicator is a necessary prerequisite for an effective market reversal.

Regarding off-chain data, ETF outflow scale has narrowed from its June peak but monthly net outflows persist; daily average trading volume is down 80% from the October 2025 peak, reflecting low institutional bullish confidence.

From a derivatives perspective, market positioning has shifted to cautiously bullish, with the put/call ratio hitting a yearly low; however, the volatility skew and options surface continue to price in downside risk.

Synthesizing all indicators, the foundational conditions required for market bottoming are all in place, but the core signals confirming a bottom have not yet appeared. Subsequent price action needs to meet three conditions: continuous cooling of long-term holder stop-loss selling pressure, stabilization of institutional fund flows, and price effectively holding above the true market average. Only on this basis will the probability of a shift into a bull market cycle significantly increase.


Trend Kriptolar

İlgili Sorular

QAccording to the Glassnode article, what are the three key signals that have not yet appeared, which are necessary to confirm a sustained Bitcoin market reversal?

AThe article states that for a sustained reversal, three key signals must appear: 1) A continued cooling-off of long-term holder sell-side pressure (realized losses). 2) A stabilization of institutional capital flows (ETF net flows turning positive or neutral). 3) The price effectively stabilizing above the Realized Price (true market mean).

QWhat does the 'long-term holder realized loss' metric indicate about the current market, and why is its trend crucial for a potential bullish turn?

AThe 'long-term holder realized loss' metric indicates that investors who bought near the cycle peak are capitulating and selling at a loss. This is currently the dominant source of selling pressure. Its trend is crucial because only when this metric shows a clear and sustained decline, signaling that this capitulation is exhausting, will the market have a foundation for a transition to a bullish cycle.

QHow does the performance of US spot Bitcoin ETFs reflect the current institutional sentiment, based on the data presented in the article?

AThe data shows institutional sentiment remains weak. While ETF daily net outflows have moderated from their June peak, they persist on a monthly basis. Furthermore, the average daily trading volume of ETFs has shrunk by approximately 80% compared to the October 2025 peak, indicating a lack of strong institutional buying conviction and participation.

QDespite a shift to a 'cautiously net long' positioning in derivatives, what signal from the options market suggests traders are still defensive?

AThe 25-delta volatility skew remains in positive territory across all maturities, meaning traders are willing to pay a premium for downside protection (put options) relative to upside potential (call options). This indicates that even with a net long bias, the market is still actively hedging against potential price declines.

QWhat is the significance of Bitcoin's price trading below both the Realized Price and the Short-Term Holder Cost Basis for an extended period, as mentioned in the article?

ABitcoin trading below both the Realized Price (the average price at which all coins last moved) and the Short-Term Holder Cost Basis for nearly five months signifies a period of deep undervaluation. Historically, such prolonged periods of accumulation below key on-chain cost bases have formed the foundation for major cycle bottoms, presenting long-term value opportunities.

İlgili Okumalar

The Fall of Zapper: An Act of God or a Human Error?

The Fall of Zapper: A Post-Mortem of a DeFi Pioneer In July 2026, Zapper, a once-dominant DeFi portfolio tracker, announced its shutdown. Born in 2020 from a merger, Zapper capitalized on the DeFi Summer boom, reaching 2 million monthly users and processing over $13B in transactions, backed by $16.5M in funding from investors like Framework Ventures and Coinbase Ventures. Its core "Zap" feature simplified complex multi-step DeFi operations. Despite its early success, Zapper failed to build a sustainable business model. Revenue from DEX aggregation was minimal due to fierce competition, while maintaining its multi-chain data infrastructure was costly. Furthermore, the DeFi landscape shifted: capital consolidated around top protocols, reducing the need for complex portfolio tracking across numerous platforms. Zapper's user base and core demand eroded. The company attempted multiple pivots, including an NFT-based points system, a social app (Chainchat), and plans for a ZAP token protocol. However, these initiatives—often focused on creating new, speculative C端需求 rather than solving existing pain points—ultimately failed. Critics argue Zapper remained trapped in a "blockchain purist" mindset, prioritizing costly, non-revenue-generating features over its competitive DEX aggregator. Unlike competitor DeBank, which successfully pivoted to its Rabby Wallet, Zapper lacked a diversified revenue stream. Its closure highlights the peril for tooling projects that fail to adapt to market shifts and monetize effectively, serving as a cautionary tale for the industry.

Foresight News20 dk önce

The Fall of Zapper: An Act of God or a Human Error?

Foresight News20 dk önce

İşlemler

Spot

Popüler Makaleler

BITCOIN Nedir

HarryPotterObamaSonic10Inu (ERC-20)'yu ve Kripto Alanındaki Yerini Anlamak Son yıllarda, kripto para piyasası, hem ticaret yapanların hem de topluluk etkileşimi ve eğlence değeri arayanların ilgisini çeken meme coin'lerin popülaritesinde bir artış gördü. Bu benzersiz token'lar arasında, kripto para dokusuna kültürel referansları harmanlayan ilginç bir proje olan HarryPotterObamaSonic10Inu (ERC-20) bulunmaktadır. Bu makale, HarryPotterObamaSonic10Inu'nun temel yönlerini, mekanizmalarını, topluluk odaklı ethosunu ve daha geniş kripto manzarasıyla etkileşimini incelemektedir. HarryPotterObamaSonic10Inu (ERC-20) Nedir? Adından da anlaşılacağı gibi, HarryPotterObamaSonic10Inu, Ethereum blok zinciri üzerinde inşa edilen bir meme coin'dir ve ERC-20 standardı altında sınıflandırılmaktadır. Geleneksel kripto paraların pratik kullanılabilirlik veya yatırım potansiyeline odaklandığı durumların aksine, bu token eğlence değeri ve topluluğunun gücü üzerine kuruludur. Proje, bağlı kullanıcıların bir araya gelebileceği, fikirlerini paylaşabileceği ve çeşitli kültürel fenomenlerden ilham alan etkinliklere katılabileceği bir ortam yaratmayı hedeflemektedir. HarryPotterObamaSonic10Inu'nun dikkate değer özelliklerinden biri işlemlerde sıfır vergi olmasıdır. Bu çekici unsur, küçük ölçekli yatırımcıları caydırabilecek ek ücretlerden yoksun olarak ticareti ve topluluk katılımını teşvik etmeyi amaçlamaktadır. Coin'in toplam arzı bir milyar token olarak belirlenmiştir; bu, topluluk içinde önemli bir dolaşım sağlama niyetini göstermektedir. HarryPotterObamaSonic10Inu (ERC-20) Yaratıcısı HarryPotterObamaSonic10Inu'nun kökenleri bir miktar gizemlidir; yaratıcısı hakkında spesifik bilgilerin ne olduğu bilinmemektedir. Bu token'ın geliştirilmesi, belirli bir ekip veya açık bir plan eksikliği ile gerçekleşmiştir; bu durum, meme coin sektöründe oldukça yaygındır. Proje, topluluğunun heyecanı ve katılımına dayalı olarak organik bir şekilde ortaya çıkmıştır. HarryPotterObamaSonic10Inu (ERC-20) Yatırımcıları Dış yatırımlar ve destekler söz konusu olduğunda, HarryPotterObamaSonic10Inu da belirsiz kalmaktadır. Token, bilinen herhangi bir yatırım fonunu veya önemli bir kurumsal desteği listelememektedir. Bunun yerine, projenin can damarı, kolektif eylem ve kripto alanındaki katılım yoluyla büyüme ve sürdürülebilirlik sağlayan temel topluluğudur. HarryPotterObamaSonic10Inu (ERC-20) Nasıl Çalışır? Bir meme coin olarak, HarryPotterObamaSonic10Inu, genellikle varlık değerini yöneten geleneksel çerçevelerin dışında çalışmaktadır. Projenin nasıl çalıştığını tanımlayan birkaç özelliği vardır: Sıfır Vergi İşlemleri: İşlemlerde vergi ücreti olmadan, kullanıcılar gizli maliyet endişesi olmadan token'ı serbestçe alıp satabilirler. Topluluk Etkileşimi: Proje, topluluk etkileşimi üzerine kuruludur ve sosyal medya platformlarını kullanarak heyecan yaratarak katılımı kolaylaştırır. Tartışmalar, içerik paylaşımı ve katılım, projenin erişimini genişletmeye ve destekleyiciler arasında sadakat oluşturmaya yardımcı olan kritik unsurlardır. Pratik Kullanılabilirlik Yok: HarryPotterObamaSonic10Inu'nun mali ekosistem içinde somut bir kullanılabilirlik sunmadığı belirtilmelidir. Daha ziyade, eğlence ve topluluk etkinlikleri için bir token olarak sınıflandırılmaktadır. Kültürel Referans: Token, popüler kültürden unsurları zekice harmanlayarak ilgi çekmektedir ve hem meme meraklıları hem de kripto takipçileriyle bağlantı kurmaktadır. HarryPotterObamaSonic10Inu, meme coin'lerin, daha geleneksel kripto para projelerinden nasıl farklı çalıştığını örneklendirmektedir; bu projeler, utilitarist varlıklar yerine yenilikçi sosyal yapıların bir parçası olarak piyasaya girmektedir. HarryPotterObamaSonic10Inu (ERC-20) Zaman Çizelgesi HarryPotterObamaSonic10Inu'nun tarihi, birkaç dikkate değer kilometre taşı ile işaretlenmiştir: Oluşum: Token, birçok kripto meraklısının hayal gücünü yakalayan bir viral meme'den ortaya çıkmıştır. Spesifik yaratım tarihleri mevcut değildir ve bu onun organik yükselişini vurgulamaktadır. Borsa Listelemeleri: HarryPotterObamaSonic10Inu, topluluğun daha kolay erişim ve ticaret yapabilmesini sağlamak için çeşitli borsalarda yer bulmuştur. Topluluk Katılım İnisiyatifleri: Yarışmalar, sosyal medya kampanyaları ve hayranlar ile destekçilerden içerik üretimini içeren topluluk etkileşimini artırmayı amaçlayan devam eden etkinlikler. Gelecek Genişleme Planları: Projenin yol haritası, kültürel temalarına ilişkin bir NFT koleksiyonu, ticari ürünler ve bir e-ticaret sitesi başlatılmasını içermektedir; bu da topluluğun daha fazla katılımını sağlamayı ve ekosistemine daha fazla boyut kazandırmayı hedeflemektedir. HarryPotterObamaSonic10Inu (ERC-20) Hakkında Kilit Noktalar Topluluk Odaklı Doğası: Proje, kullanıcı katılımını geliştirme önceliği taşır ve böylece kullanıcıların sürecin en önünde yer almasını sağlar. Meme Coin Sınıflandırması: Eğlenceye dayalı kripto paranın doruk noktasıdır ve geleneksel yatırım araçlarından ayrılmaktadır. Bitcoin ile Doğrudan İlişki Yok: Ticker ismindeki benzeliğe rağmen, HarryPotterObamaSonic10Inu ayırt edicidir ve Bitcoin veya diğer yerleşik kripto paralarla herhangi bir ilişkisi yoktur. İşbirliğine Odaklanma: HarryPotterObamaSonic10Inu, sahipleri arasında işbirliği ve hikaye paylaşımı için bir alan oluşturmak üzere tasarlanmıştır ve bu da yaratıcılık ve topluluk bağlarını sağlamaktadır. Gelecek Beklentileri: Başlangıçta belirlendiği temalardan NFTs ve ticari ürünlere genişleme arzusu, projenin dijital kültürde daha ana akıma girebilmesi için bir yol haritası çizmektedir. Meme coin'ler, kripto para topluluğunun hayal gücünü çalmaya devam ederken, HarryPotterObamaSonic10Inu (ERC-20), kültürel bağları ve topluluk merkezli yaklaşımıyla öne çıkmaktadır. Geleneksel bir hizmet odaklı token modeliyle uyumlu olmasa da, özünde destekçileri arasında sağlanan neşe ve dostluğu vurgulayarak, giderek dijitalleşen bir çağda kripto paraların evrilen doğasını göstermektedir. Proje gelişmeye devam ettikçe, topluluk dinamiklerinin blockchain teknolojisi dünyasındaki seyrini nasıl etkilediğini izlemek önemli olacaktır.

2.1k Toplam GörüntülenmeYayınlanma 2024.04.01Güncellenme 2024.12.03

BITCOIN Nedir

BTC Nasıl Satın Alınır

HTX.com’a hoş geldiniz! Bitcoin (BTC) satın alma işlemlerini basit ve kullanışlı bir hâle getirdik. Adım adım açıkladığımız rehberimizi takip ederek kripto yolculuğunuza başlayın. 1. Adım: HTX Hesabınızı OluşturunHTX'te ücretsiz bir hesap açmak için e-posta adresinizi veya telefon numaranızı kullanın. Sorunsuzca kaydolun ve tüm özelliklerin kilidini açın. Hesabımı Aç2. Adım: Kripto Satın Al Bölümüne Gidin ve Ödeme Yönteminizi SeçinKredi/Banka Kartı: Visa veya Mastercard'ınızı kullanarak anında Bitcoin (BTC) satın alın.Bakiye: Sorunsuz bir şekilde işlem yapmak için HTX hesap bakiyenizdeki fonları kullanın.Üçüncü Taraflar: Kullanımı kolaylaştırmak için Google Pay ve Apple Pay gibi popüler ödeme yöntemlerini ekledik.P2P: HTX'teki diğer kullanıcılarla doğrudan işlem yapın.Borsa Dışı (OTC): Yatırımcılar için kişiye özel hizmetler ve rekabetçi döviz kurları sunuyoruz.3. Adım: Bitcoin (BTC) Varlıklarınızı SaklayınBitcoin (BTC) satın aldıktan sonra HTX hesabınızda saklayın. Alternatif olarak, blok zinciri transferi yoluyla başka bir yere gönderebilir veya diğer kripto para birimlerini takas etmek için kullanabilirsiniz.4. Adım: Bitcoin (BTC) Varlıklarınızla İşlem YapınHTX'in spot piyasasında Bitcoin (BTC) ile kolayca işlemler yapın.Hesabınıza erişin, işlem çiftinizi seçin, işlemlerinizi gerçekleştirin ve gerçek zamanlı olarak izleyin. Hem yeni başlayanlar hem de deneyimli yatırımcılar için kullanıcı dostu bir deneyim sunuyoruz.

8.0k Toplam GörüntülenmeYayınlanma 2024.12.12Güncellenme 2026.06.02

BTC Nasıl Satın Alınır

$BITCOIN Nedir

DİJİTAL ALTIN ($BITCOIN): Kapsamlı Bir Analiz DİJİTAL ALTIN ($BITCOIN) Tanıtımı DİJİTAL ALTIN ($BITCOIN), geleneksel değerli metallerin özelliklerini merkeziyetsiz teknolojilerin yeniliği ile birleştirmeyi amaçlayan Solana ağı üzerinde çalışan blockchain tabanlı bir projedir. Bitcoin ile aynı isme sahip olmasına rağmen, genellikle bir değer saklama aracı olarak algılandığı için “dijital altın” olarak anılmaktadır; DİJİTAL ALTIN, Web3 ortamında benzersiz bir ekosistem yaratmak için tasarlanmış ayrı bir tokendir. Hedefi, uygulanabilir bir alternatif dijital varlık olarak kendini konumlandırmaktır, ancak uygulamaları ve işlevleri ile ilgili ayrıntılar hala gelişmektedir. DİJİTAL ALTIN ($BITCOIN) Nedir? DİJİTAL ALTIN ($BITCOIN), Solana blockchain'inde kullanılmak üzere açıkça tasarlanmış bir kripto para tokenidir. Bitcoin'in yaygın olarak tanınan bir değer saklama rolü sağlamasının aksine, bu token daha geniş uygulamalara ve özelliklere odaklanıyor gibi görünmektedir. Dikkate değer yönler şunlardır: Blockchain Altyapısı: Token, yüksek hızlı ve düşük maliyetli işlemleri yönetme kapasitesi ile bilinen Solana blockchain'inde inşa edilmiştir. Arz Dinamikleri: DİJİTAL ALTIN'ın maksimum arzı 100 katrilyon token (100P $BITCOIN) ile sınırlıdır, ancak dolaşımdaki arzı ile ilgili ayrıntılar şu anda açıklanmamıştır. Kullanım Alanı: Kesin işlevler açıkça belirtilmemiş olsa da, token'ın merkeziyetsiz uygulamalar (dApps) veya varlık tokenizasyon stratejileri ile ilgili çeşitli uygulamalar için kullanılabileceğine dair işaretler bulunmaktadır. DİJİTAL ALTIN ($BITCOIN) Yaratıcısı Kimdir? Şu anda, DİJİTAL ALTIN ($BITCOIN) arkasındaki yaratıcıların ve geliştirme ekibinin kimliği bilinmemektedir. Bu durum, merkeziyetsiz finans ve meme coin fenomenleriyle uyumlu olan birçok yenilikçi proje arasında yaygındır. Böyle bir anonimlik, topluluk odaklı bir kültürü teşvik edebilirken, yönetişim ve hesap verebilirlik konusundaki endişeleri artırmaktadır. DİJİTAL ALTIN ($BITCOIN) Yatırımcıları Kimlerdir? Mevcut bilgiler, DİJİTAL ALTIN ($BITCOIN) için bilinen herhangi bir kurumsal destekçi veya önde gelen risk sermayesi yatırımı olmadığını göstermektedir. Proje, geleneksel finansman yolları yerine topluluk desteği ve benimsemeye odaklanan bir eşler arası modelde çalışıyor gibi görünmektedir. Faaliyetleri ve likiditesi esas olarak PumpSwap gibi merkeziyetsiz borsalarda (DEX'ler) yer almakta olup, bu da onun taban hareketine vurgu yapmaktadır. DİJİTAL ALTIN ($BITCOIN) Nasıl Çalışır DİJİTAL ALTIN ($BITCOIN) 'ın operasyonel mekanikleri, blockchain tasarımı ve ağ özellikleri temelinde açıklanabilir: Konsensüs Mekanizması: Solana'nın benzersiz tarih kanıtı (PoH) ile bir hisse kanıtı (PoS) modelini birleştirerek, proje ağın yüksek performansına katkıda bulunan verimli işlem doğrulamasını sağlar. Tokenomik: Belirli deflasyonist mekanizmalar kapsamlı bir şekilde detaylandırılmamış olsa da, geniş maksimum token arzı, henüz tanımlanmamış mikro işlemler veya niş kullanım durumlarına hitap edebileceğini ima etmektedir. Etkileşim: Solana'nın daha geniş ekosistemi ile entegrasyon potansiyeli bulunmaktadır; bu, çeşitli merkeziyetsiz finans (DeFi) platformlarını içermektedir. Ancak, belirli entegrasyonlarla ilgili ayrıntılar belirtilmemiştir. Önemli Olayların Zaman Çizelgesi DİJİTAL ALTIN ($BITCOIN) ile ilgili önemli kilometre taşlarını vurgulayan bir zaman çizelgesi: 2023: Token'ın Solana blockchain'inde ilk dağıtımı, sözleşme adresi ile işaretlenmiştir. 2024: DİJİTAL ALTIN, PumpSwap gibi merkeziyetsiz borsalarda işlem görmeye başladıkça görünürlük kazanır ve kullanıcıların bunu SOL karşısında ticaret yapmasına olanak tanır. 2025: Proje, topluluk odaklı etkileşimlere yönelik potansiyel ilgi ve ara sıra ticaret faaliyetleri görür, ancak şu ana kadar dikkate değer ortaklıklar veya teknik ilerlemeler belgelenmemiştir. Kritik Analiz Güçlü Yönler Ölçeklenebilirlik: Temel Solana altyapısı, yüksek işlem hacimlerini destekleyerek $BITCOIN'in çeşitli işlem senaryolarındaki faydasını artırabilir. Erişilebilirlik: Token başına potansiyel düşük ticaret fiyatı, perakende yatırımcıları çekebilir ve parçalı mülkiyet fırsatları sayesinde daha geniş katılımı kolaylaştırabilir. Riskler Şeffaflık Eksikliği: Kamuya açık olarak bilinen destekçilerin, geliştiricilerin veya bir denetim sürecinin olmaması, projenin sürdürülebilirliği ve güvenilirliği konusunda şüpheler doğurabilir. Piyasa Volatilitesi: Ticaret faaliyeti büyük ölçüde spekülatif davranışa dayanmakta olup, bu da yatırımcılar için önemli fiyat dalgalanmalarına ve belirsizliklere yol açabilir. Sonuç DİJİTAL ALTIN ($BITCOIN), hızla gelişen Solana ekosisteminde ilginç ama belirsiz bir proje olarak ortaya çıkmaktadır. “Dijital altın” anlatısını kullanmaya çalışırken, Bitcoin'in değer saklama rolünden ayrılması, amaçlanan faydasının ve yönetişim yapısının daha net bir şekilde tanımlanması gerekliliğini vurgulamaktadır. Gelecekteki kabul ve benimseme, mevcut belirsizliklerin giderilmesine ve operasyonel ile ekonomik stratejilerinin daha açık bir şekilde tanımlanmasına bağlı olacaktır. Not: Bu rapor, Ekim 2023 itibarıyla mevcut olan sentezlenmiş bilgileri kapsamaktadır ve araştırma döneminin ötesinde gelişmeler yaşanmış olabilir.

169 Toplam GörüntülenmeYayınlanma 2025.05.13Güncellenme 2025.05.13

$BITCOIN Nedir

Tartışmalar

HTX Topluluğuna hoş geldiniz. Burada, en son platform gelişmeleri hakkında bilgi sahibi olabilir ve profesyonel piyasa görüşlerine erişebilirsiniz. Kullanıcıların BTC (BTC) fiyatı hakkındaki görüşleri aşağıda sunulmaktadır.

活动图片