Автор | @Dune
Компиляция | Odaily星球日报(@OdailyChina)
Переводчик | Дин Дан (@XiaMiPP)
Примечание редактора: пока рынок по-прежнему привык использовать «общий объем предложения» для описания мира стейблкоинов, более детализированные данные раскрывают другую реальность. Единый показатель предложения может ответить только на вопрос «сколько», но не может объяснить «кто владеет», «как движется» и «почему остается». Когда мы рассматриваем масштаб предложения, концентрацию владения, скорость обращения в блокчейне и конкретные категории активности на одной карте, мы видим не статичный запас, а динамическую структуру того, как капитал мигрирует, оседает, использует кредитное плечо и переоценивается в цепи.
Такой взгляд важен, потому что он может скорректировать наши интуитивные суждения за последний год. Упадок крипторынка и сильный тренд фондового рынка США образуют яркий контраст. Панические настроения, усиленные продажами китов и откатами цен, легко заставляют поверить, что капитал уходит из криптомира. Но данные в цепи, представленные в этой статье, а также сигналы, недавно释放ленные в финансовом отчете Circle, говорят о том, что средства не обязательно исчезли — они могли быть временно изъяты из активов с высоким волатильным риском. По крайней мере, данные в цепи доказывают, что они участвуют в стимулирующей активности, а не в торговых потребностях.
Каждый ссылается на эту цифру предложения. Она появляется в каждом отчете, каждом звонке о доходах, каждом слушании по политике. Но кроме «объем обращения превышает 3000 миллиардов долларов», что мы на самом деле знаем о стейблкоинах?
Кто ими владеет? Насколько высока концентрация владения? Как быстро они оборачиваются и в каких цепочках в основном активны? Для чего они фактически используются — в качестве ликвидности DeFi, платежного средства или просто «денежного эквивалента» для стоянки капитала?
Meta недавно объявила о планах интеграции платежей сторонними стейблкоинами на своей платформе; OCC (Управление контролера денежного обращения США) одобрило национальные трастовые банковские лицензии для Stablecoin; Payoneer объявила о предоставлении функций стейблкоинов для 2 миллионов предприятий; Anchorage Digital запустила услуги по обеспечению соответствия стейблкоинов для неамериканских банков. Институты и регуляторы ускоряют вход, и им явно нужен ответ не просто в виде цифры предложения.
Мы использовали новый набор данных о стейблкоинах, выпущенный Dune — этот набор данных был разработан Dune в сотрудничестве со Steakhouse Financial — чтобы ответить на некоторые из этих вопросов. Вот что показывают данные.
Панорама предложения
По состоянию на январь 2026 года, полностью разводненный объем предложения 15 крупнейших стейблкоинов в EVM, Solana и Tron достиг 3040 миллиардов долларов, что на 49% больше, чем год назад. USDT (1970 миллиардов долларов) от Tether и USDC (730 миллиардов долларов) от Circle по-прежнему занимают 89% рыночной доли.
С точки зрения распределения по цепочкам, Ethereum несет 1760 миллиардов долларов (58%), Tron — 840 миллиардов долларов (28%), Solana — 150 миллиардов долларов (5%), BNB Chain — 130 миллиардов долларов (4%). Даже при том, что общий объем предложения почти удвоился, эта структура распределения по цепочкам за последний год практически не претерпела заметных изменений.
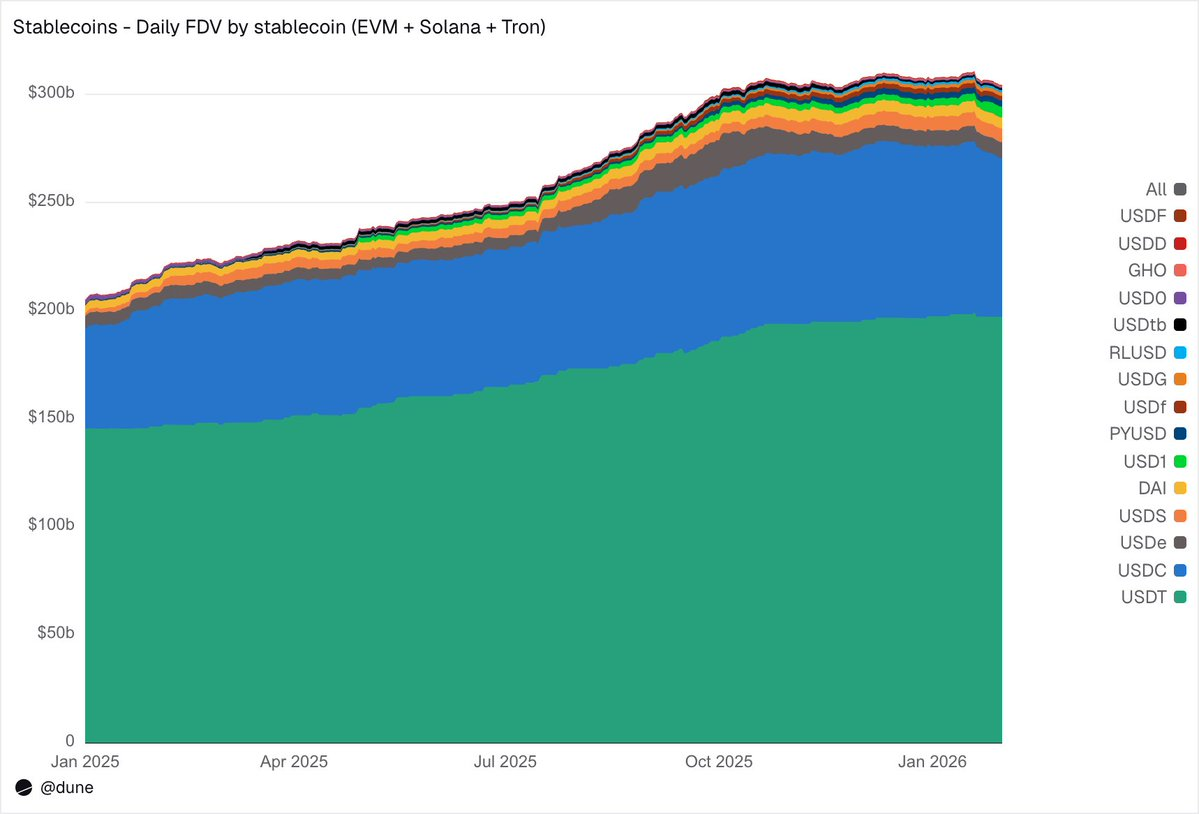
Но под двумя крупнейшими стейблкоинами 2025 год стал годом восхождения претендентов. USDS (Sky/MakerDAO) вырос на 376% до 6,3 миллиарда долларов; PYUSD (PayPal) вырос на 753% до 2,8 миллиарда долларов; RLUSD (Ripple) подскочил с 58 миллионов долларов до 1,1 миллиарда долларов, рост на 1803%; USDG расширился в 52 раза; USD1 вырос с нуля до 5,1 миллиарда долларов.
Конечно, не все претенденты двигались в одном направлении. USD0 упал на 66%; USDe от Ethena в пике октября почти утроился, в итоге за год вырос на 23%. Тем не менее, количество конкурентов в слое под USDT и USDC значительно увеличилось.
Кто ими владеет?
Большинство наборов данных о стейблкоинах могут сказать вам только общий объем предложения. Поскольку наш набор данных отслеживает балансы на уровне кошельков и сочетает их с метками адресов, мы можем ответить на более ключевой вопрос: кто владеет этими стейблкоинами?
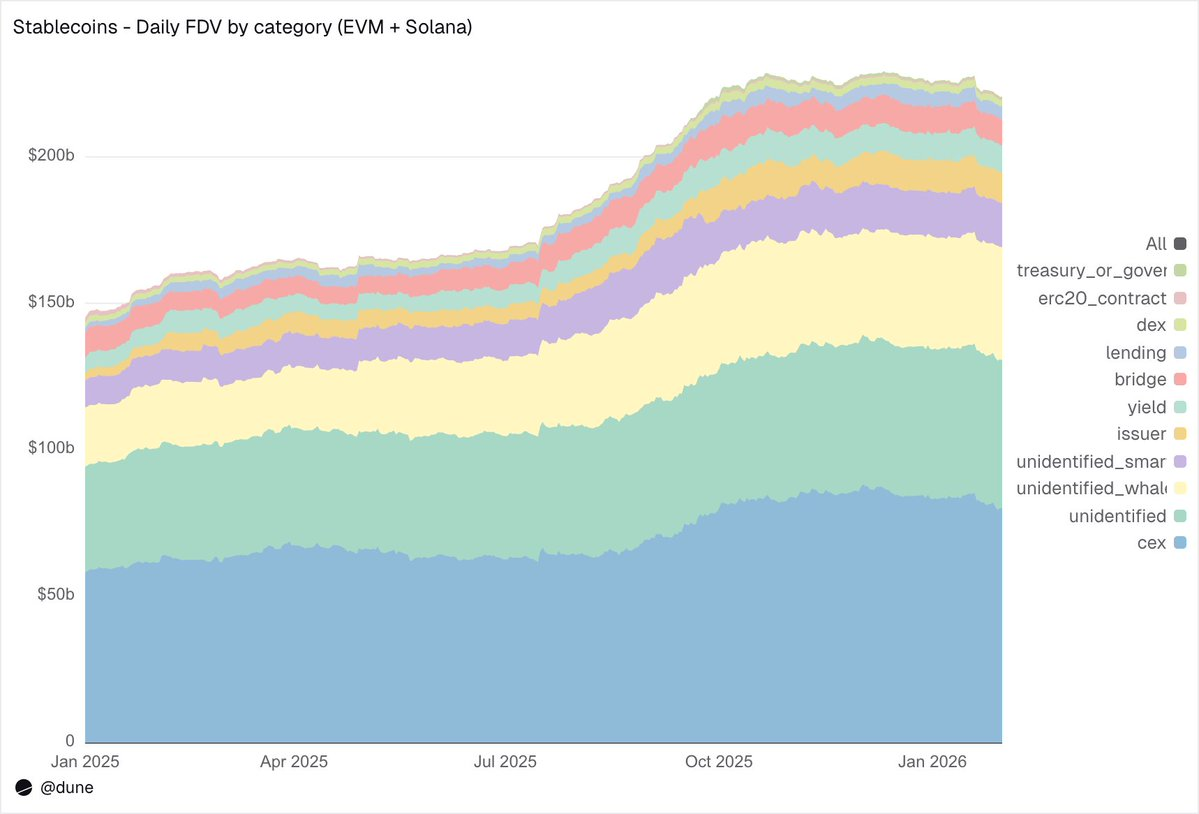
В экосистемах EVM и Solana централизованные биржи в настоящее время являются крупнейшей идентифицированной категорией с объемом хранения 80 миллиардов долларов, что выше, чем 58 миллиардов долларов год назад. Стейблкоины прежде всего остаются инфраструктурой для торговли и расчетов на биржах.
Кошельки китов хранят 39 миллиардов долларов; хранение в протоколах дохода почти удвоилось до 9,3 миллиарда долларов, что отражает рост стратегий дохода в цепи; адреса эмитентов — включая казначейства и контракты чеканки/сжигания — подскочили с 2,2 миллиарда долларов до 10,2 миллиарда долларов, рост в 4,6 раза, что напрямую отражает масштаб поступления нового предложения на рынок.
О качестве меток: лишь 23% объема предложения находится в полностью неидентифицированных адресах. Для данных в цепи это довольно высокий уровень идентификации — и это крайне важно для понимания того, где именно распределены риски стейблкоинов.
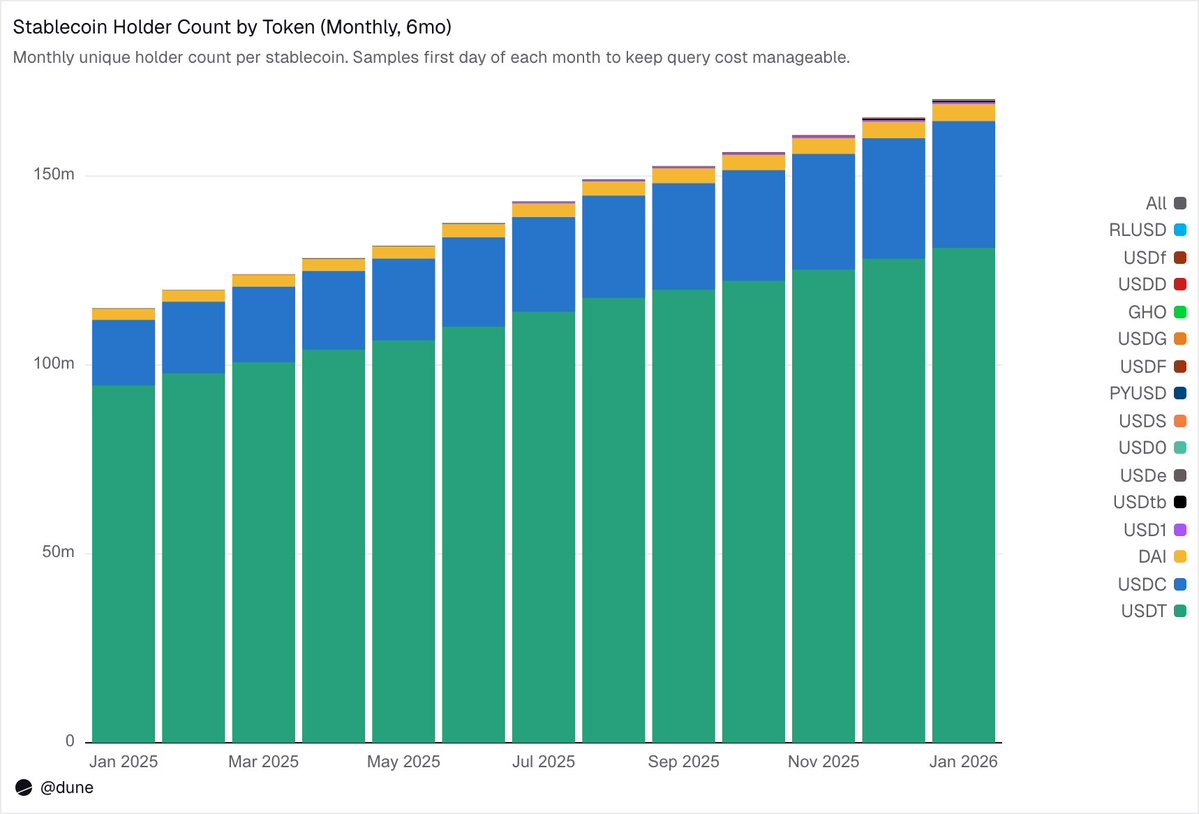
172 миллиона владельцев, но крайне высокая концентрация
По состоянию на февраль 2026 года насчитывается 172 миллиона уникальных адресов, которые владеют по крайней мере одним из этих 15 стейблкоинов. На USDT приходится 136 миллионов, на USDC — 36 миллионов, на DAI — 4,7 миллиона. Распределение этих трех стейблкоинов очень широкое: 10 крупнейших кошельков владеют лишь 23%–26% объема предложения, их HHI (индекс Херфиндаля-Хиршмана, где 0 означает полную децентрализацию, а 1 — единственного владельца) ниже 0,03.
А другие стейблкоины представляют совершенно иную картину. 10 крупнейших кошельков часто контролируют от 60% до 99% объема предложения. Возьмем, к примеру, USDS: хотя его объем обращения составляет 6,9 миллиарда долларов, 90% из них сосредоточены в 10 кошельках (HHI 0,48). Концентрация USDF еще выше: 10 крупнейших адресов владеют 99% предложения (HHI 0,54). Что касается USD0, то здесь ситуация почти экстремальная:同样 99% сконцентрированы в топ-10 кошельках, но HHI достигает 0,84, что означает, что даже внутри этой десятки объем предложения в основном контролируется одним или двумя адресами.
Это не означает, что эти стейблкоины сами по себе имеют дефекты — некоторые проекты запущены недавно, некоторые изначально разработаны для институциональных клиентов. Но это действительно означает, что их цифры «объема предложения» нельзя интерпретировать так же, как USDT или USDC. Концентрация владения напрямую влияет на риск отвязки, глубину ликвидности и на то, представляет ли так называемый «объем предложения» реальный органический спрос или просто отражает поведение по распределению нескольких крупных держателей. Проводить такой анализ можно только тогда, когда у вас есть данные о балансе каждого владельца, а не только агрегированный объем предложения, полученный на основе событий чеканки/сжигания.
Январь 2026 года: объем переводов 10,3 триллиона долларов
В январе 2026 года общая сумма переводов стейблкоинов в экосистемах EVM, Solana и TRON достигла 10,3 триллиона долларов, что более чем в два раза превышает показатель января 2025 года.
Распределение по цепочкам резко контрастирует со структурой предложения: Base лидирует с 5,9 триллионами долларов, хотя его объем предложения составляет лишь 4,4 миллиарда долларов; Ethereum — 2,4 триллиона долларов; Tron — 682 миллиарда долларов; Solana — 544 миллиарда долларов; BNB Chain — 406 миллиардов долларов.
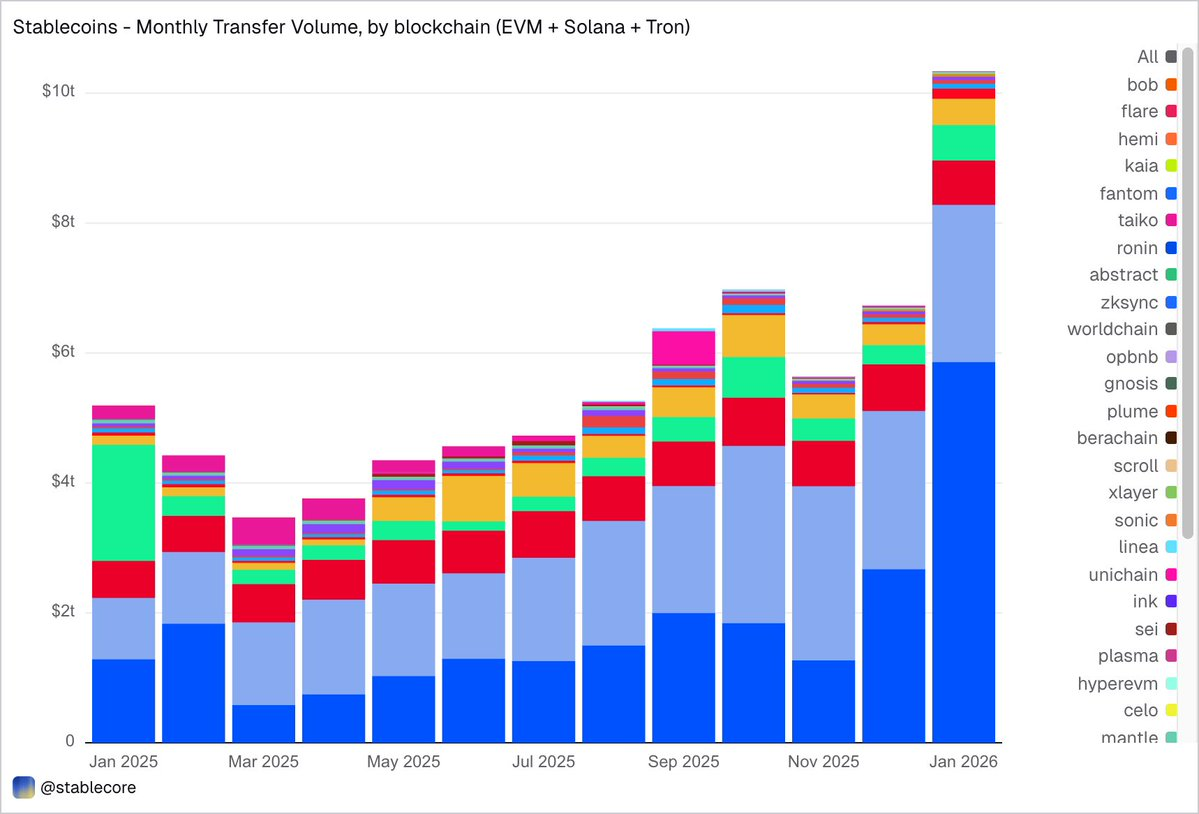
По токенам доминирует USDC с 8,3 триллионами долларов — почти в 5 раз больше, чем у USDT (1,7 триллиона долларов) — хотя его объем предложения составляет лишь около 1/2,7 от последнего. USDC явно обращается быстрее и чаще. DAI — 138 миллиардов долларов, USDS — 92 миллиарда долларов, USD1 — 43 миллиарда долларов.
Важно подчеркнуть, что эти данные намеренно остаются объективными и нейтральными. Этот набор данных не фильтрует заранее «реальную» экономическую активность по какому-то фиксированному стандарту, поэтому общая сумма может включать движения, вызванные автоматизированными действиями, такими как арбитраж, боты, внутренняя маршрутизация и т.д. Мы не встраиваем суждения в данные, а предоставляем объективный взгляд, позволяя пользователям самостоятельно выбирать способ фильтрации — будь то исключение бот-транзакций, идентификация органического использования или определение более реалистичных стандартов измерения торговой активности.
Чем на самом деле занимаются стейблкоины?
Именно здесь真正 проявляется преимущество детализации этого набора данных. Переводы не просто помечаются как «сумма», а классифицируются по различным типам активности на основе механизма триггера в цепи. Это означает, что мы знаем не только «10 триллионов долларов переместилось», но и «почему это перемещение произошло».
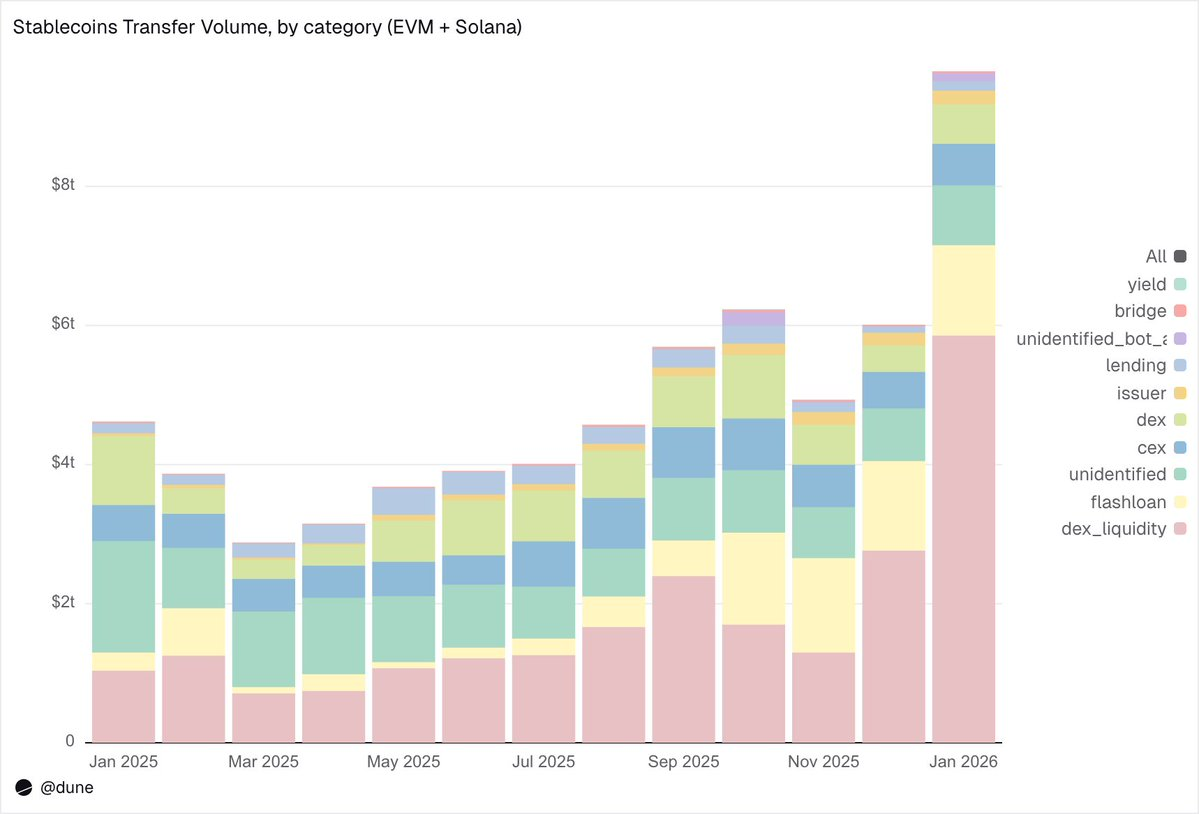
1. Рыночная инфраструктура (торговля на DEX и ликвидность)
- Предоставление и изъятие ликвидности на DEX: 5,9 триллиона долларов — крупнейший сценарий использования, отражающий роль стейблкоинов как базового актива для маркет-мейкеров в цепи.
- Обмен на DEX: 3,76 триллиона долларов — прямая торговая активность на автоматических маркет-мейкерах.
Вместе они показывают, что стейблкоины прежде всего являются торговым залоговым обеспечением и инфраструктурой ликвидности. Интересно, что объем торгов больше сосредоточен на стимулируемом майнинге ликвидности и активной оптимизации капитала, а не на чистой торговой потребности.
2. Кредитное плечо и эффективность капитала (кредитование + flash-кредиты)
- Flash-кредиты (заимствование и возврат): 1,3 триллиона долларов — автоматизированные циклы арбитража и ликвидации.
- Кредитная активность (вклады, выдача кредитов, погашение, изъятие): 1,37 триллиона долларов — представляет уровень краткосрочной эффективности капитала и структурированного кредитования в цепи.
3. Каналы входа/выхода (CEX и мосты)
- Движение на CEX — внесение (2,24 триллиона долларов), вывод (2,24 триллиона долларов), внутренние переводы (1,51 триллиона долларов): итого 5,99 триллиона долларов.
- Ввод/вывод через мосты: 280 миллиардов долларов — показывает функцию стейблкоинов как канала расчетов между кросс-чейн и централизованными платформами.
4. Уровень эмиссии (денежные операции)
- Операции эмитента — чеканка (280 миллиардов долларов), сжигание (200 миллиардов долларов), ребалансировка привязки (230 миллиардов долларов) и другие операции: итого 1,06 триллиона долларов, что почти в 5 раз больше, чем 420 миллиардов долларов год назад.
5. Протоколы дохода
- Активность в протоколах дохода: 27 миллиардов долларов — небольшой объем, но имеет важное значение в структурированных стратегиях и управлении активами в цепи.
В целом, 90% объема переводов проходят через идентифицированные категории активности, предоставляя нам детализированный вид на всех уровнях всего стека в цепи.
Скорость обращения: один токен, разные миры
Дневная скорость обращения (объем транзакций, деленный на объем предложения), возможно, самый упускаемый показатель в анализе стейблкоинов. Он показывает, используется ли стейблкоин активно в качестве средства обмена или просто хранится.
Среди анализируемых нами токенов снова выделяются USDC и USDT, но с разными характеристиками.
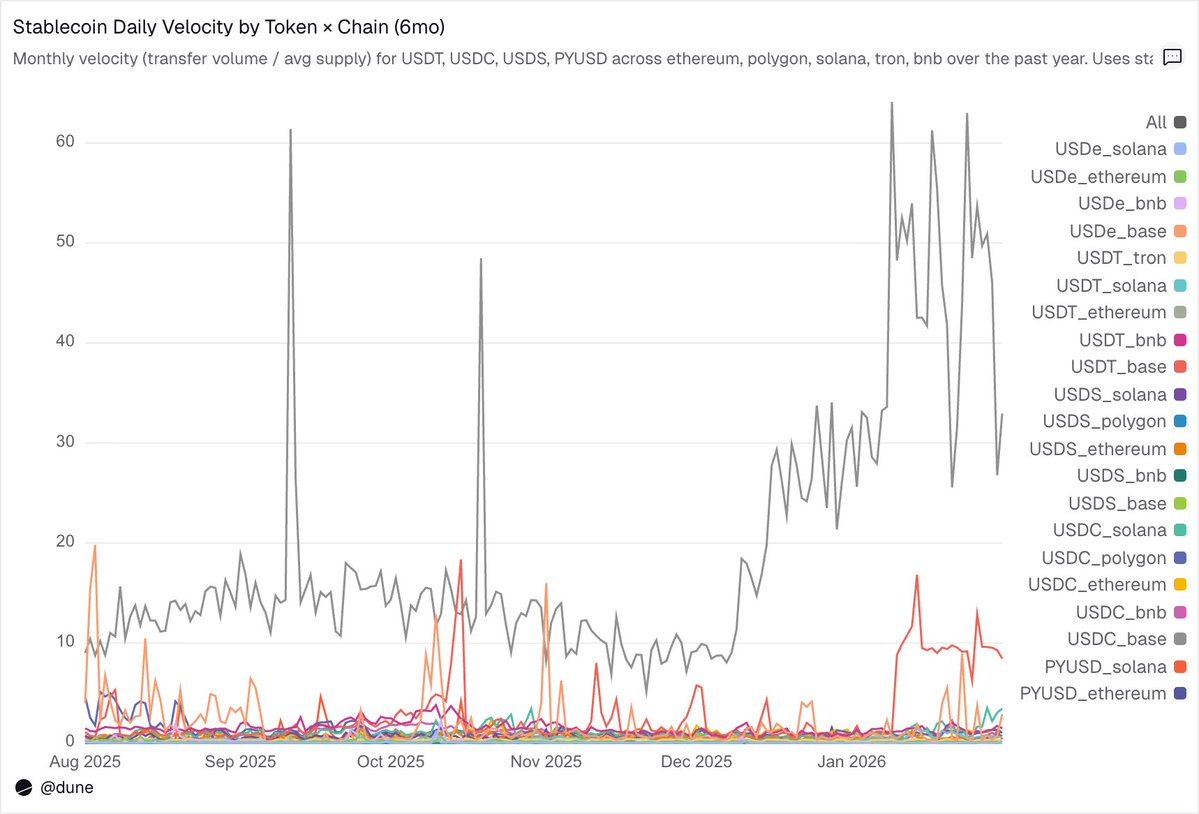
USDC имеет самую высокую скорость обращения в L2 и Solana. На Base дневная скорость обращения USDC достигает ошеломляющих 14 раз — это невероятная цифра, driven высокой частотой DeFi-активности; на Solana и Polygon около 1 раза; на Ethereum также достигает 0,9 раза, почти весь объем предложения движется ежедневно.
USDT быстрее всего на BNB Chain и Tron. На BNB Chain достигает 1,4 раза, отражая активную торговлю; на Tron — 0,3 раза, объем торгов низкий, но необычно стабильный, что соответствует его роли основного канала для трансграничных платежей. А на Ethereum USDT составляет лишь 0,2 раза, более 1000 миллиардов долларов объема предложения в основном простаивает.
USDe и USDS движутся медленнее, но это сделано намеренно. Дневная скорость обращения USDe на Ethereum составляет всего 0,09 раза; USDS — 0,5 раза. Оба являются стейблкоинами, ориентированными на доход: USDe обычно стейкуется в sUSDe для получения дохода от дельта-нейтральной стратегии Ethena; USDS депонируется в механизм сберегательной процентной ставки Sky для получения субсидированного дохода протокола. Таким образом, значительный объем предложения остается в сберегательных контрактах, таких как кредитные рынки Aave, или в структурированных циклах дохода. Низкая скорость здесь не недостаток, а особенность — эти активы designed для накопления дохода, а не для частого обращения.
Различия между цепочками часто важнее, чем сам токен. Тот же PYUSD на Solana имеет дневную скорость обращения 0,6 раза, что в четыре раза больше, чем на Ethereum (0,1 раза). Один и тот же токен в разных экосистемах демонстрирует совершенно разные модели использования.
Объем предложения и объем переводов рассказывают часть истории, а скорость обращения соединяет их — она показывает, является ли стейблкоин в данной цепочке активной инфраструктурой или спящим капиталом.