Южная Корея может быть ближе, чем ожидалось, к запуску собственного стейблкоина! Поскольку разговоры о токене, обеспеченном воной, набирают обороты, страна становится одним из самых пристально наблюдаемых рынков.
Вот почему.
Южная Корея – Один из крупнейших в мире розничных рынков
Учитывая, что уже участвуют более 18 миллионов граждан, криптотрейдинг в Южной Корее является быстроразвивающимся и ориентированным на розничных инвесторов. В разные моменты их активность соперничала с традиционными фондовыми рынками!
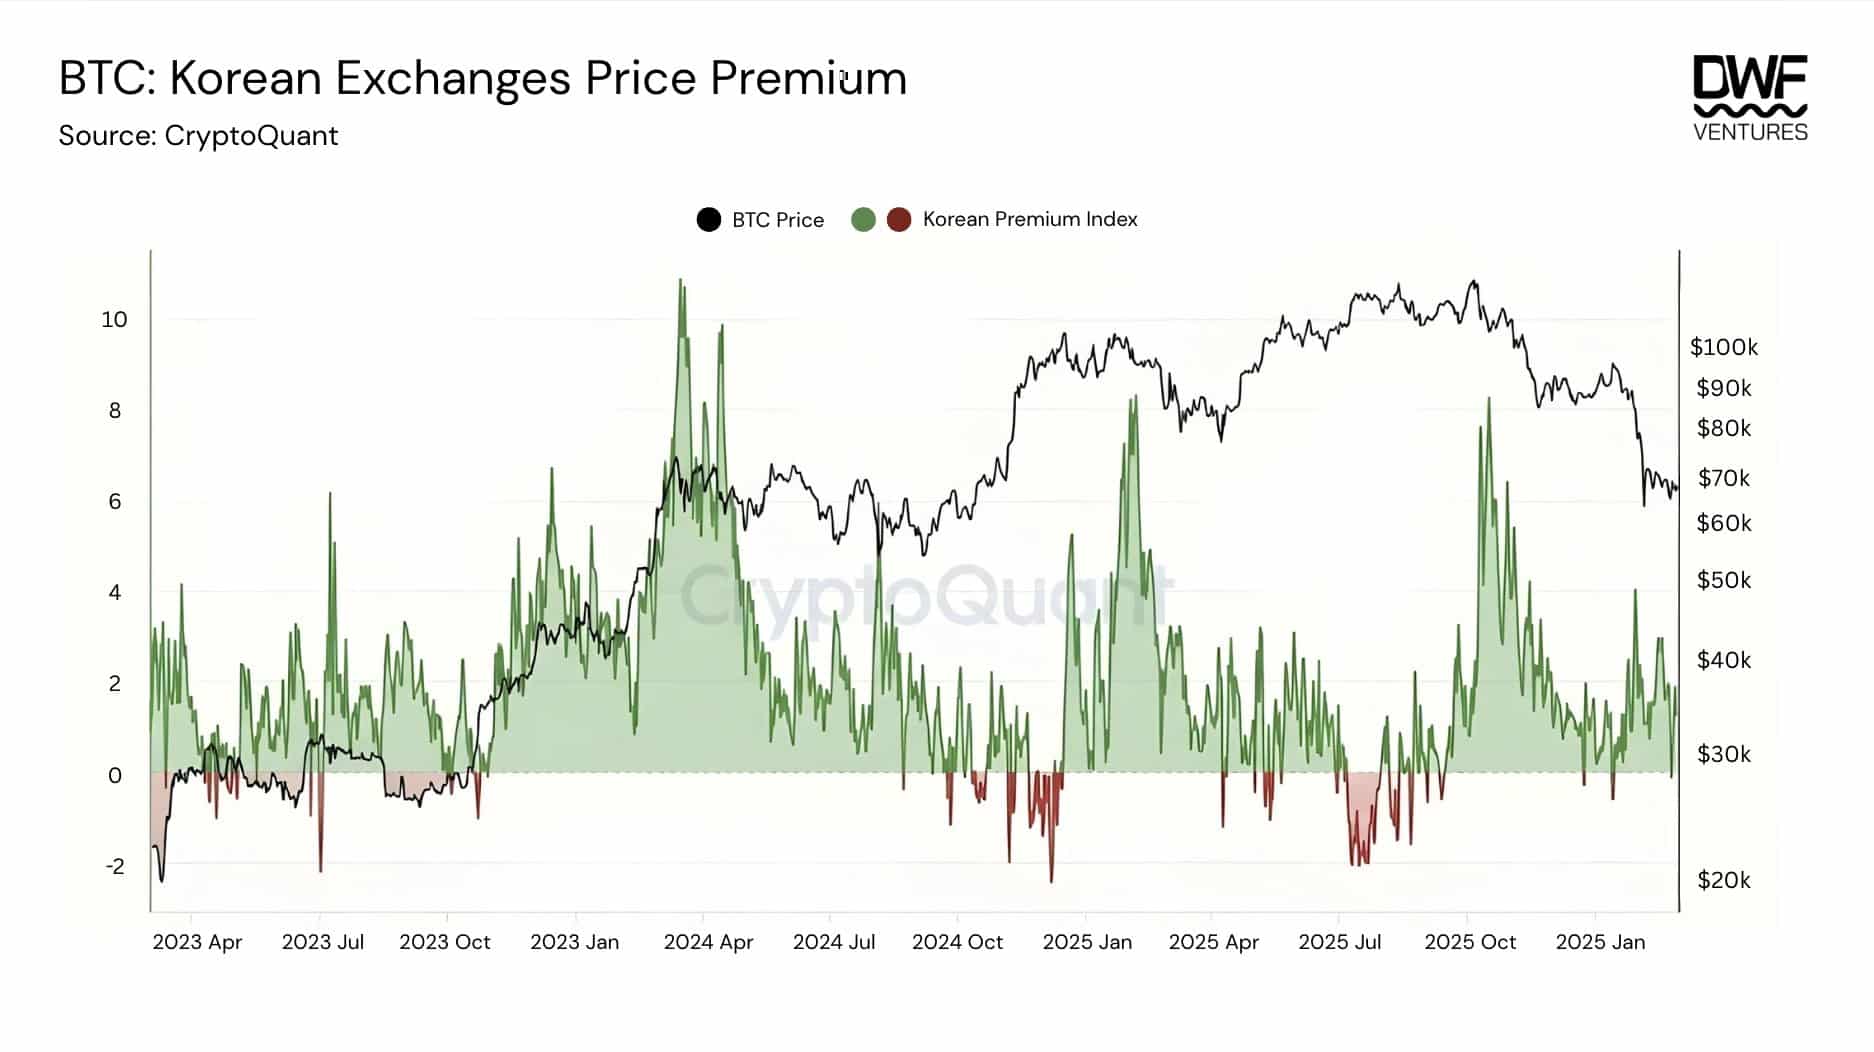

Однако этот спрос не всегда был эффективным. «Кимчи-премия», когда активы торгуются по более высоким ценам на местных биржах, ясно показывает разрыв между внутренним и глобальным рынками. Здесь присутствуют как местный спрос, так и ограниченная гибкость движения капитала.
Именно здесь стейблкоин, привязанный к воне, начинает обретать смысл. Местная альтернатива может снизить зависимость от стейблкоинов, номинированных в долларах США, и улучшить ликвидность в воновых торговых парах. В то же время это также способствует более быстрому расчету.
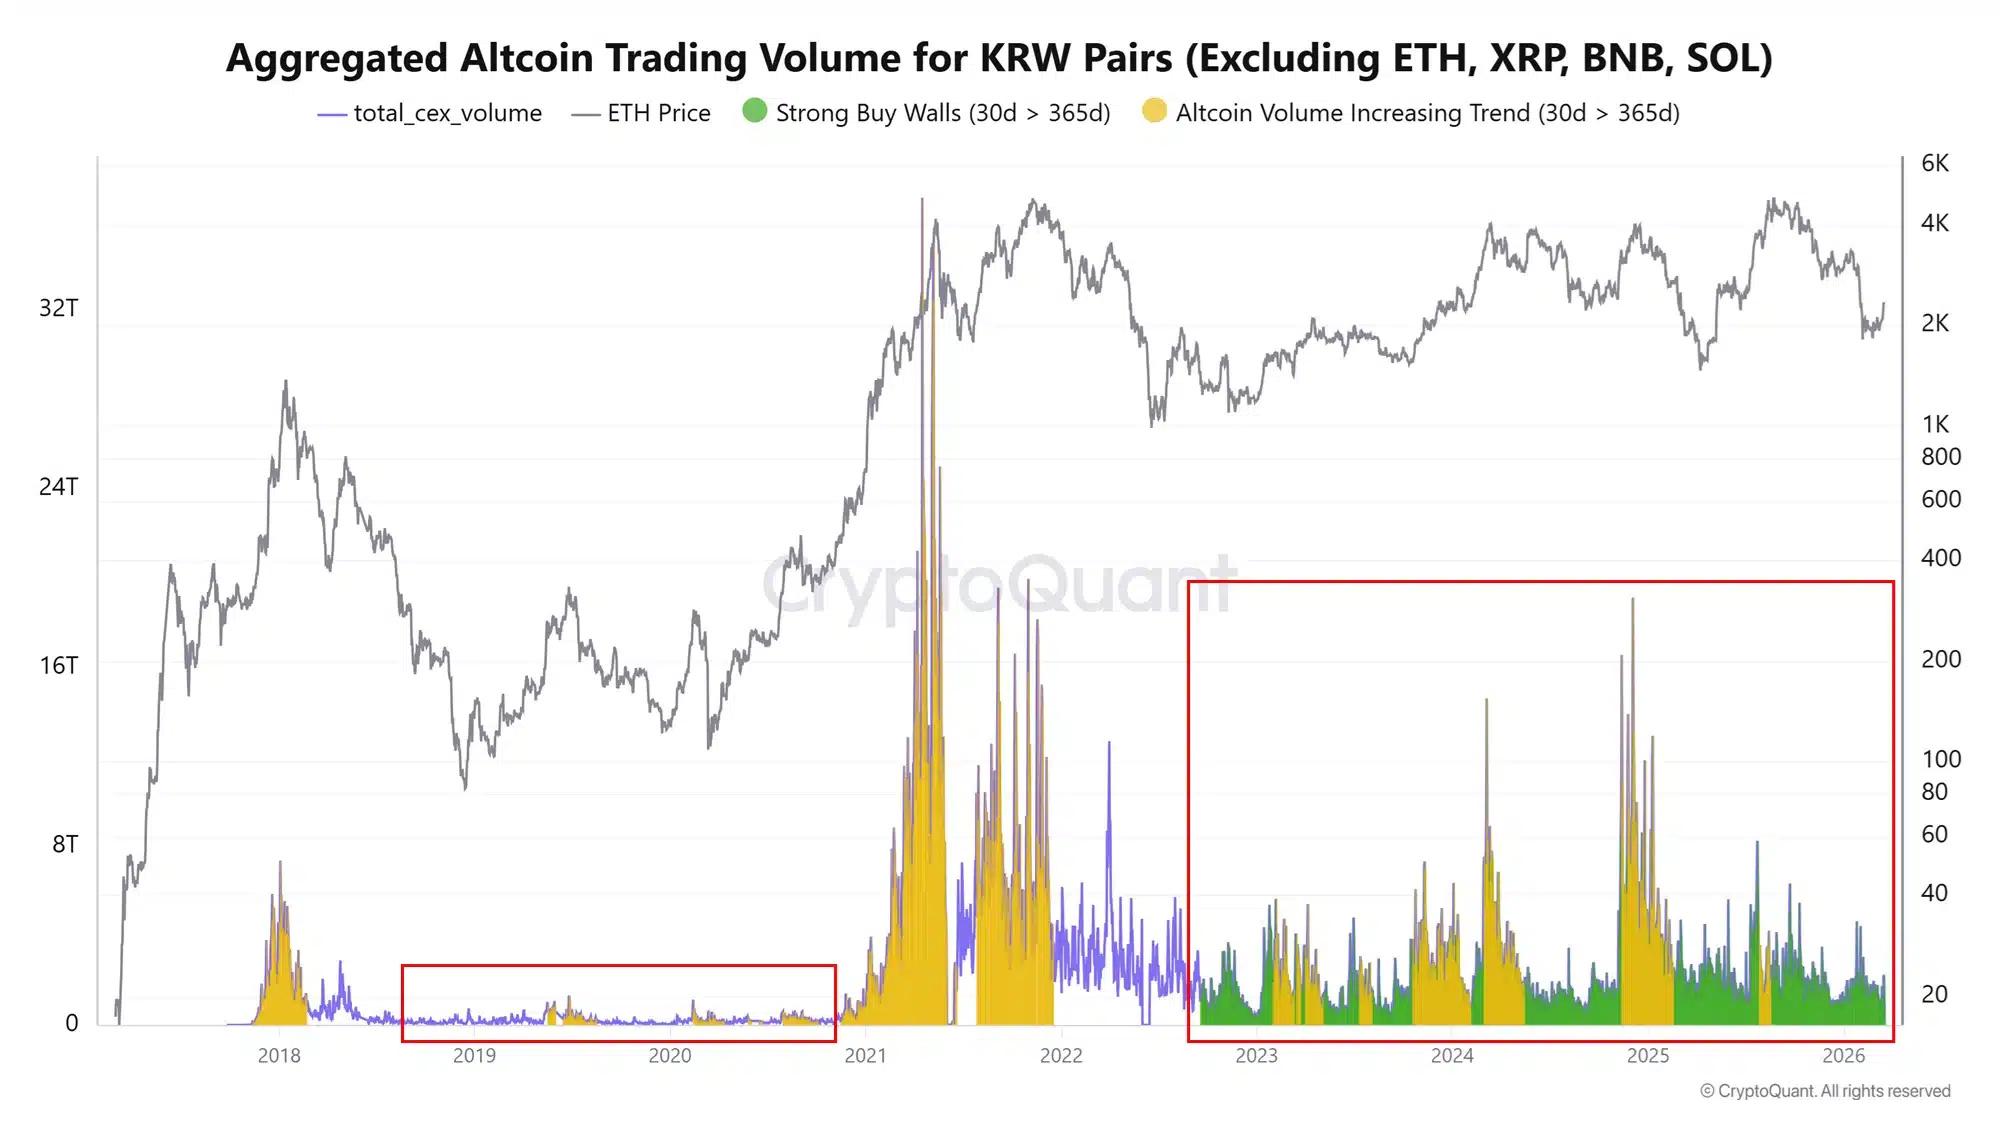

И вот что интересно; это не только розничный рынок. Крупные игроки на корейских биржах годами поглощали давление со стороны продавцов, создавая хорошую стену поддержки, которая сохраняет ликвидность.