Ethereum eyes $2.7K, but will weak demand stop ETH’s gains?

ambcryptoОпубликовано 2026-03-24Обновлено 2026-03-24

Введение

Ethereum (ETH) faces mixed signals as it attempts to reclaim the $2,000 level. While the weekly chart shows a bullish structure, with key Fibonacci support at $2,147, the daily trend remains bearish. A potential rally toward $2,770–$3,049 is possible if Bitcoin strengthens and reaches $83k–$89k. However, weak demand, indicated by a declining OBV, and the threat of profit-taking near the $2,353–$2,400 realized price zone may limit gains. Despite $80.2 million in recent liquidations, ETH's unrealized profit ratio has turned positive, though momentum remains uncertain.

Ethereum [ETH] saw $80.2 million in liquidations in the past 24 hours, with $65.6 million being long liquidations. These numbers were relatively tame compared to the $1.1 billion in ETH liquidations on the 31st of January.

That did little to lighten the mood around the leading altcoin. Crypto and stock markets were in the same boat of extreme despair after recent losses.

The Ethereum whales’ unrealized profit ratio climbed back into positive territory again as prices pierced the $2k level. While this seemed to suggest bullish momentum can build, AMBCrypto highlighted the $2,353 level as the aggregate realized price.

In other words, the $2.4k area could arrest any potential rally, as ETH holders might exit the market at breakeven, given the extremely fearful conditions. The longer-term trends gave a mixed picture.

The bullish long-term swing structure of ETH

Source: ETH/USDT on TradingView

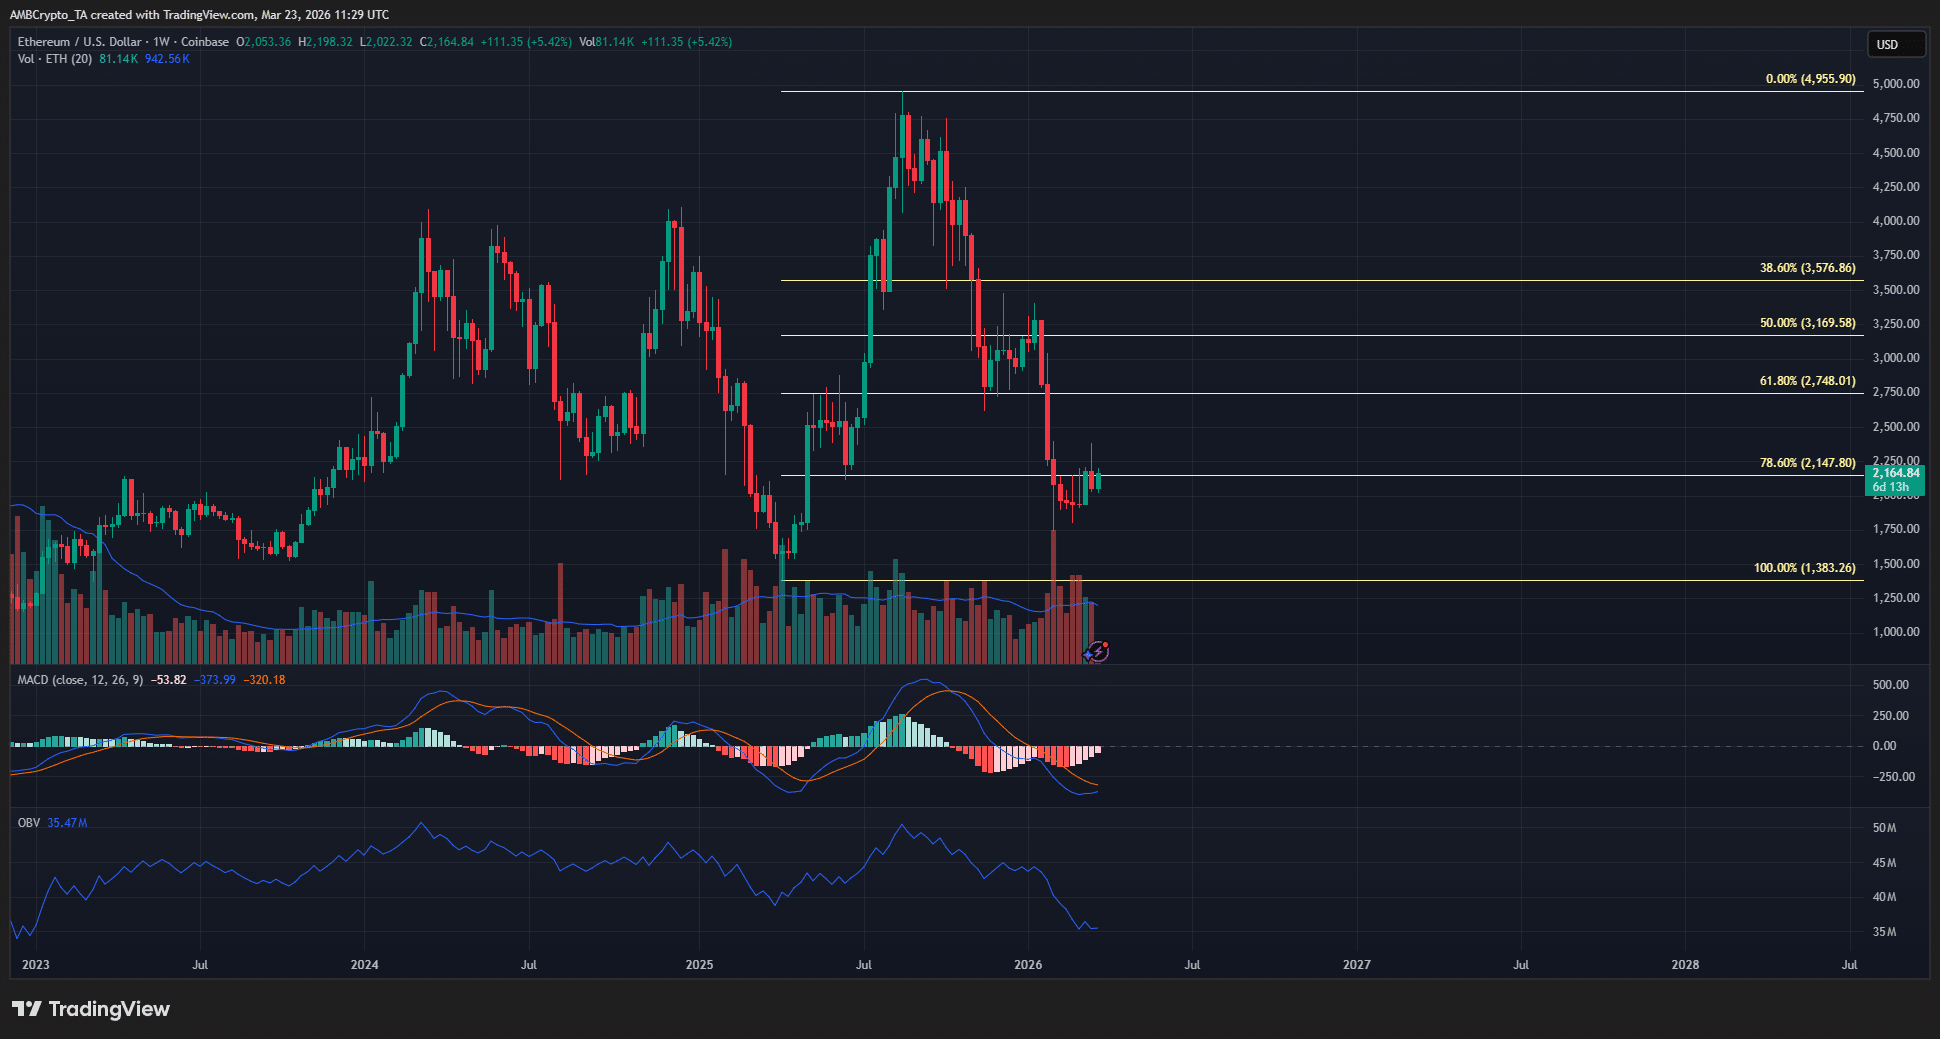
On the weekly timeframe, ETH has a bullish swing structure. Based on the 2025 rally from $1,383 to $4,955, a set of Fibonacci retracement levels was plotted. It showed that the 78.6% level was at $2,147.

The ETH bulls have been fighting to reclaim this retracement level as support since losing it in February and were close to rallying the price back above it.

One concern was that the OBV had made a lower low compared to April 2025. At the same time, the MACD was yet to form a bullish crossover, a sign that higher timeframe momentum has not begun to change.

Source: ETH/USDT on TradingView

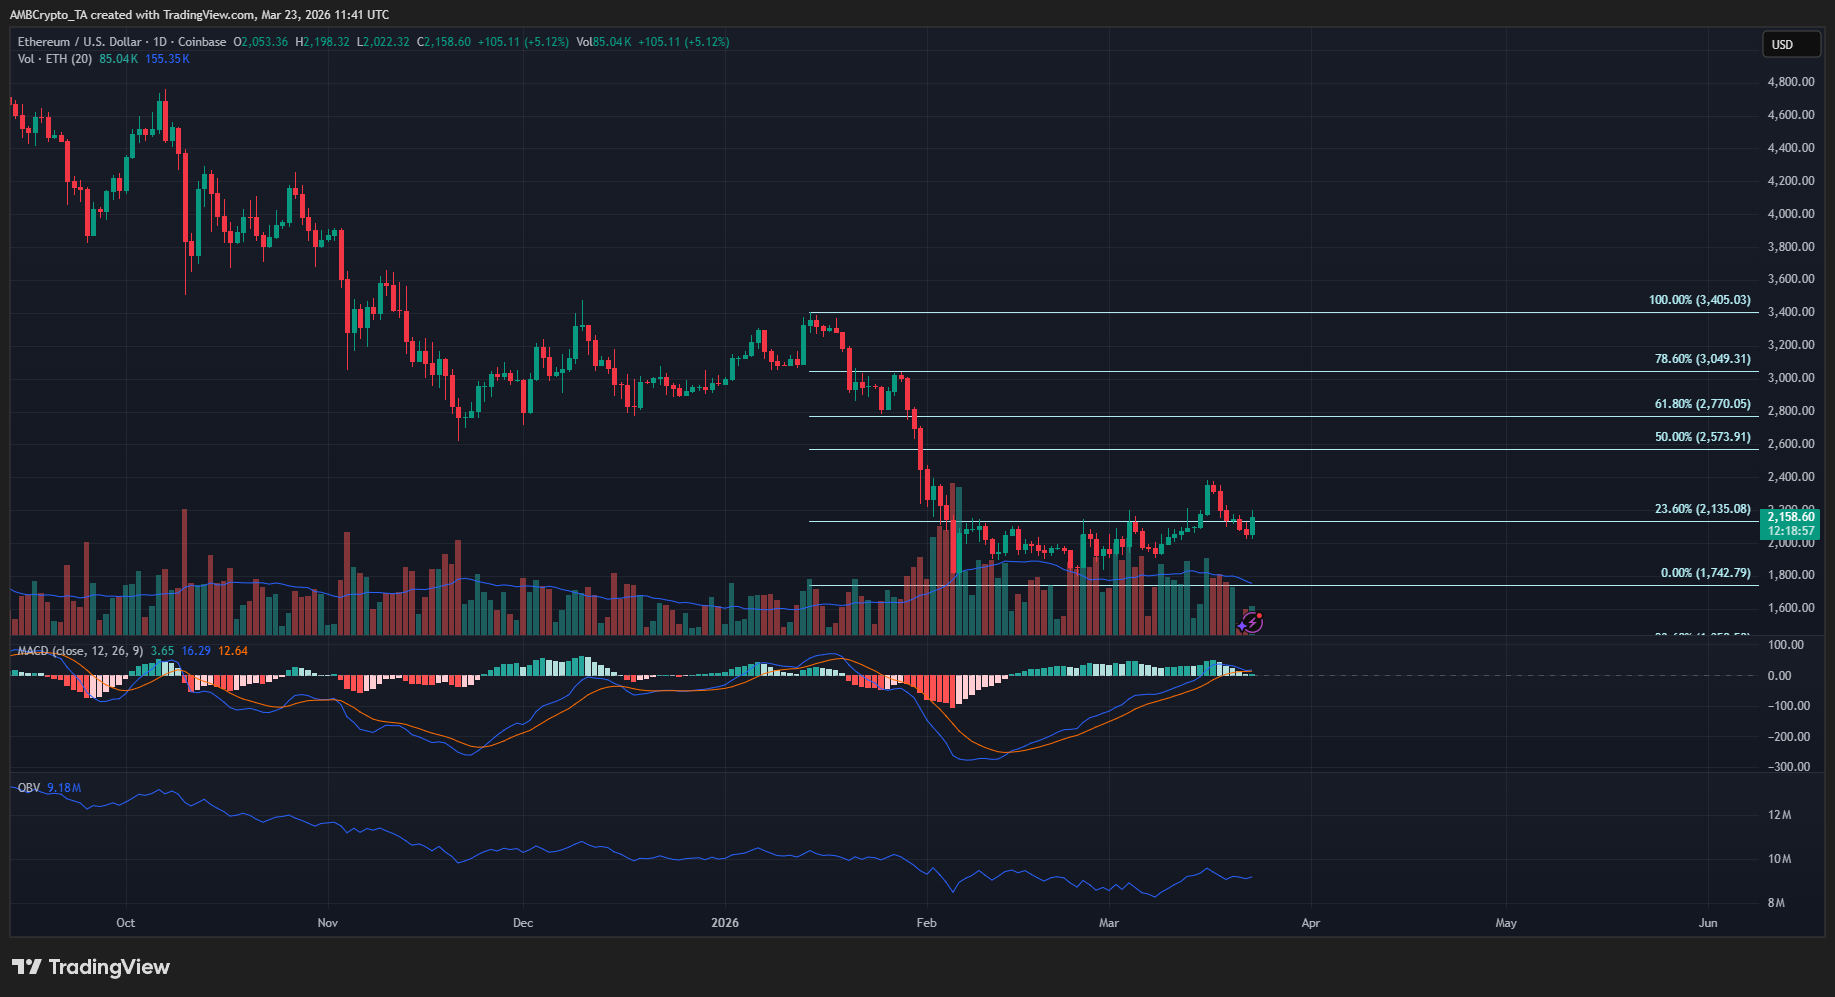
Meanwhile, the 1-day structure was bearish, and the H4 swing structure was bullish. These were conflicting signs, unlike Bitcoin [BTC], which was bearish on both the weekly and daily timeframes.

Which way should Ethereum investors and traders anticipate the price to go?

Ethereum tends to follow Bitcoin, and the leading crypto has a bearish long-term trend. In the coming weeks, a rally toward $83k-$89k was possible. This could take Ethereum toward the $2,770-$3,049 Fibonacci golden pocket on the daily timeframe.

Therefore, a sustained Bitcoin rally could push ETH toward $2.5k-$2.7k. This was the optimistic scenario. A lack of strong demand, as the OBV’s weekly timeframe lower low hints at, could severely curtail any Ethereum rally.

Investors should also remember the aggregate realized price and the threat of profit-taking if a rally materializes.


Final Summary

  • Ethereum gave mixed signals on multiple timeframes. Its bullish weekly and bearish daily charts posed a challenge for investors.
  • A rally toward $3k is possible, but it depends on Bitcoin climbing above $80k in the coming weeks and a shift in crypto market sentiment.

Связанные с этим вопросы

QWhat was the total amount of Ethereum liquidations in the past 24 hours, and how much of that were long liquidations?

AThe total Ethereum liquidations in the past 24 hours were $80.2 million, with $65.6 million of that being long liquidations.

QWhat key price level did AMBCrypto identify as the aggregate realized price, which could act as a barrier to a rally?

AAMBCrypto identified the $2,353 level as the aggregate realized price, suggesting the $2.4k area could arrest any potential rally.

QOn which timeframe does Ethereum have a bullish swing structure, and what is the significant Fibonacci retracement level mentioned?

AEthereum has a bullish swing structure on the weekly timeframe. The significant Fibonacci retracement level mentioned is the 78.6% level at $2,147.

QAccording to the article, what two conflicting technical indicators on the weekly chart suggest a potential weakness in a rally?

AThe two conflicting indicators are the On-Balance Volume (OBV), which made a lower low compared to April 2025, and the MACD, which was yet to form a bullish crossover.

QWhat is the optimistic price target for Ethereum's potential rally, and what does it depend on?

AThe optimistic price target for Ethereum is a rally toward $2.5k-$2.7k. This depends on a sustained Bitcoin rally toward $83k-$89k and a shift in overall crypto market sentiment.

Похожее

Торговля

Спот
Фьючерсы

Популярные статьи

Как купить S

Добро пожаловать на HTX.com! Мы сделали приобретение Sonic (S) простым и удобным. Следуйте нашему пошаговому руководству и отправляйтесь в свое крипто-путешествие.Шаг 1: Создайте аккаунт на HTXИспользуйте свой адрес электронной почты или номер телефона, чтобы зарегистрироваться и бесплатно создать аккаунт на HTX. Пройдите удобную регистрацию и откройте для себя весь функционал.Создать аккаунтШаг 2: Перейдите в Купить криптовалюту и выберите свой способ оплатыКредитная/Дебетовая Карта: Используйте свою карту Visa или Mastercard для мгновенной покупки Sonic (S).Баланс: Используйте средства с баланса вашего аккаунта HTX для простой торговли.Третьи Лица: Мы добавили популярные способы оплаты, такие как Google Pay и Apple Pay, для повышения удобства.P2P: Торгуйте напрямую с другими пользователями на HTX.Внебиржевая Торговля (OTC): Мы предлагаем индивидуальные услуги и конкурентоспособные обменные курсы для трейдеров.Шаг 3: Хранение Sonic (S)После приобретения вами Sonic (S) храните их в своем аккаунте на HTX. В качестве альтернативы вы можете отправить их куда-либо с помощью перевода в блокчейне или использовать для торговли с другими криптовалютами.Шаг 4: Торговля Sonic (S)С легкостью торгуйте Sonic (S) на спотовом рынке HTX. Просто зайдите в свой аккаунт, выберите торговую пару, совершайте сделки и следите за ними в режиме реального времени. Мы предлагаем удобный интерфейс как для начинающих, так и для опытных трейдеров.

1.2k просмотров всегоОпубликовано 2025.01.15Обновлено 2025.03.21

Как купить S

Sonic: Обновления под руководством Андре Кронье – новая звезда Layer-1 на фоне спада рынка

Он решает проблемы масштабируемости, совместимости между блокчейнами и стимулов для разработчиков с помощью технологических инноваций.

2.2k просмотров всегоОпубликовано 2025.04.09Обновлено 2025.04.09

Sonic: Обновления под руководством Андре Кронье – новая звезда Layer-1 на фоне спада рынка

HTX Learn: Пройдите обучение по "Sonic" и разделите 1000 USDT

HTX Learn — ваш проводник в мир перспективных проектов, и мы запускаем специальное мероприятие "Учитесь и Зарабатывайте", посвящённое этим проектам. Наше новое направление .

1.8k просмотров всегоОпубликовано 2025.04.10Обновлено 2025.04.10

HTX Learn: Пройдите обучение по "Sonic" и разделите 1000 USDT

Обсуждения

Добро пожаловать в Сообщество HTX. Здесь вы сможете быть в курсе последних новостей о развитии платформы и получить доступ к профессиональной аналитической информации о рынке. Мнения пользователей о цене на S (S) представлены ниже.

活动图片