Bitcoin (BTC) starts the second week of December above $90,000 as “Santa rally” talk begins.
BTC price action focuses on a key resistance area in the low $90,000 region, but traders still see another dip coming.
Federal interest-rate decision week hangs over risk assets despite broad consensus that a cut will result.
The Fed decision will decide the fate of a Santa rally for stocks, analysis agrees.
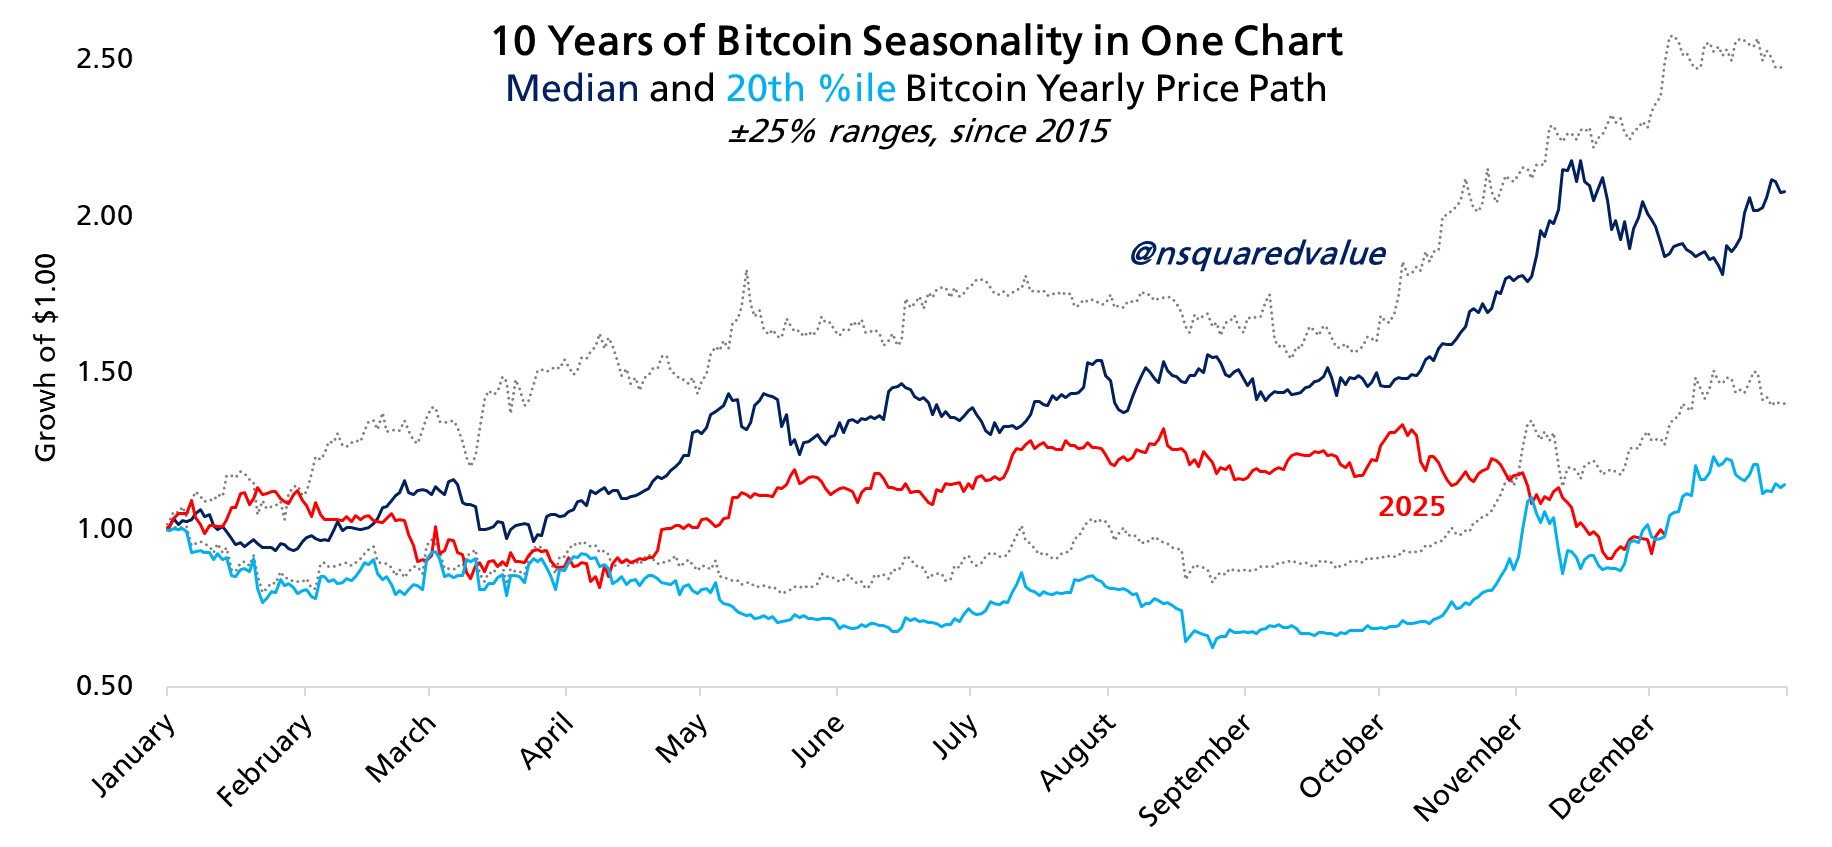
For Bitcoin, seasonality suggests that this year’s “bear market” bottom timing could echo 2022.
Open interest and leverage stay muted in what could be light at the end of the tunnel for the bulls.
Fibonacci level becomes key BTC price floor
Bitcoin price volatility made a comeback into the weekly close — a pattern seen increasingly often this quarter.
After dipping to near $87,000, BTC/USD managed a weekly close around the $90,000 mark before further erratic moves on lower time frames, data from Cointelegraph Markets Pro and TradingView confirms.
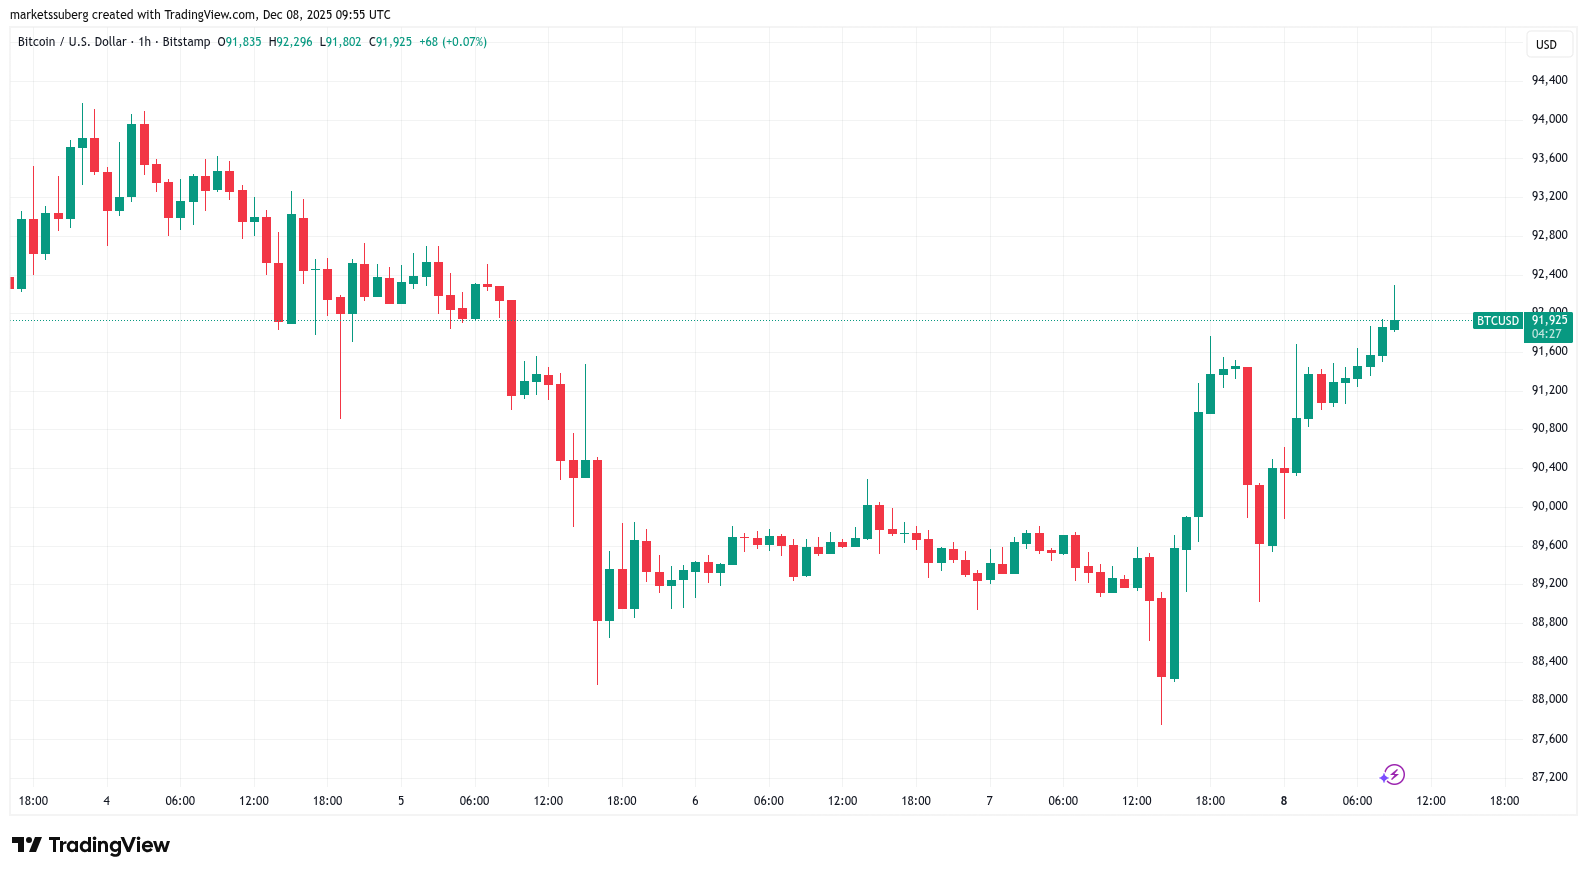
Traders thus stayed wary of fakeout moves in both directions.
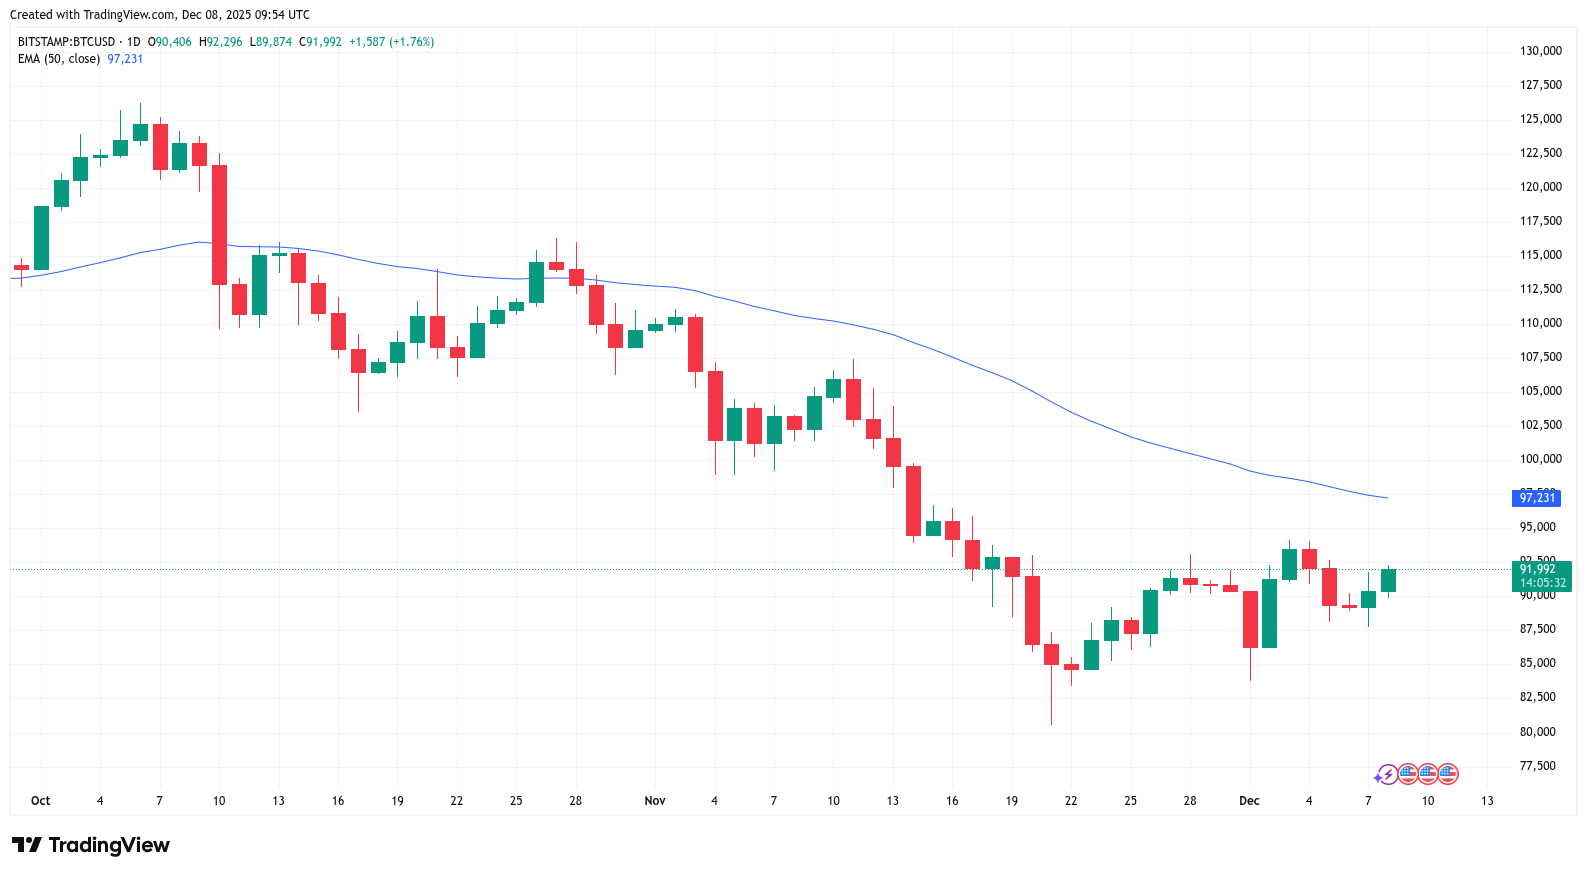
In his latest X thread on BTC, trader CrypNuevo eyed the 50-day exponential moving average (EMA) as a potential retest target.
“For shorts, I'm looking for a 1D50EMA retest and I'm thinking that it'll adjust around $95.5k and be the range highs,” he forecast.
CrypNuevo said that Bitcoin lacked a “clear base” for going long, with the low $80,000 zone still on the table.
“Some liquidations in both directions but slightly more to the upside in the zone between $94.5k-$95.3k. If price gets there first, I'll be looking for short signals to a potential low $80's retest,” he added alongside charts of exchange order-book liquidity data.
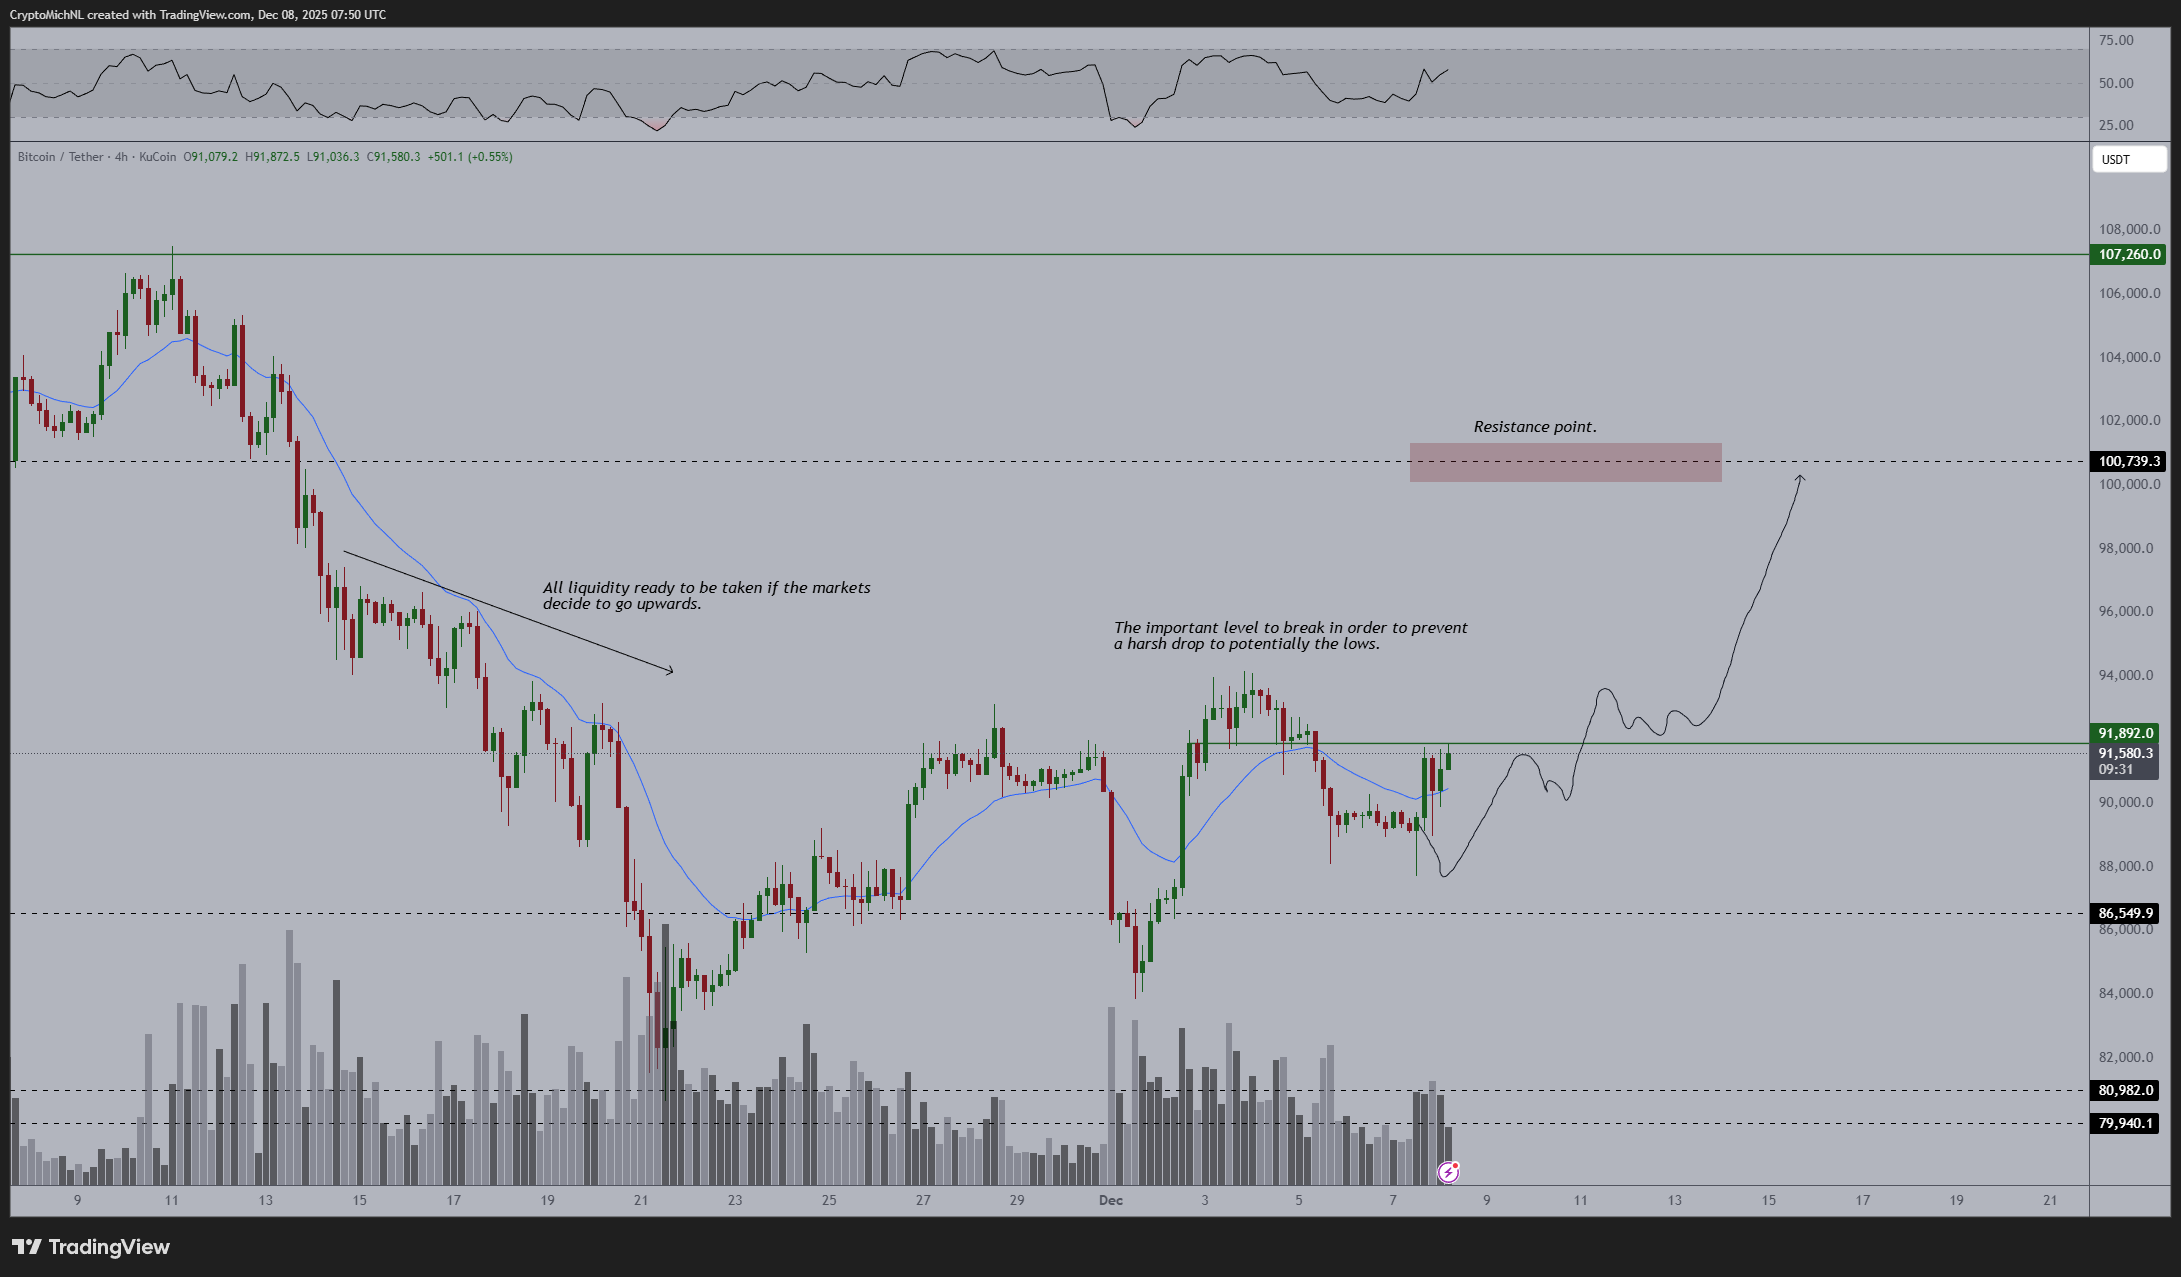
Crypto trader, analyst and entrepreneur Michaël van de Poppe was more hopeful, referring to “intense” pressure among Bitcoin buyers at local lows.
“Given that there's such an intense buying pressure taking place, I would assume we'll be breaking upwards and holding above $92K in the coming days,” he told X followers Monday.
“That would result in a rally towards $100K pre-2026.”
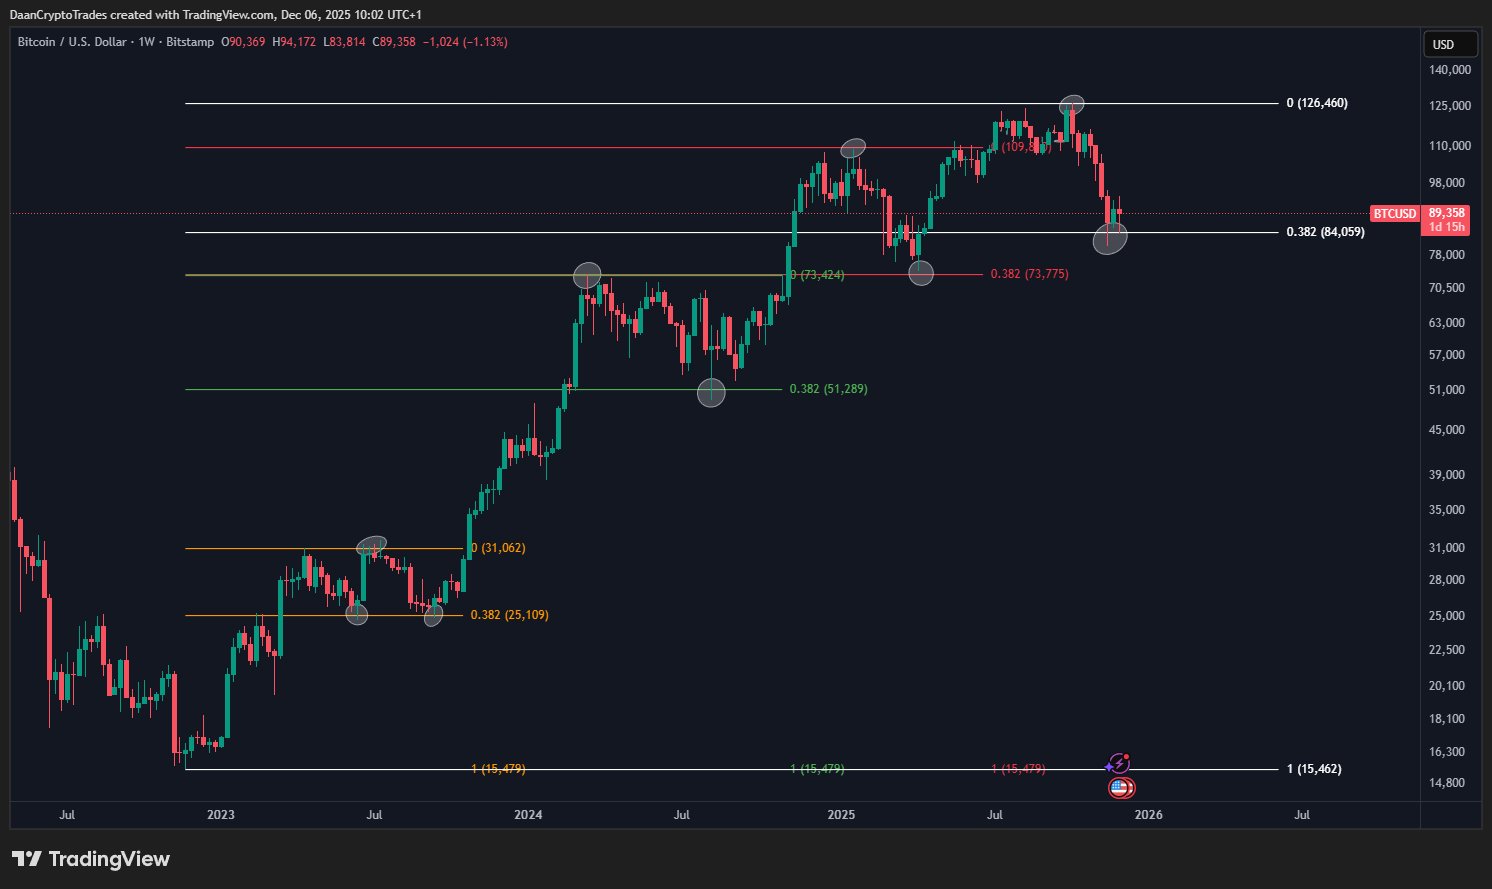
To the downside, trader Daan Crypto Trades used Fibonacci retracement levels to flag bulls’ line in the sand. This stands at $84,000, a level that saw a retest to start December.
“Still holding on to that .382 area from the entire bull market so far,” he wrote in accompanying analysis.
“I think this is a key area for the bulls to defend. It's also pretty much the last major support before testing the April lows again, which would break this high timeframe market structure.”
FOMC week sees Fed caught short on labor market
Little by way of US macroeconomic data releases this week means that the focus is purely on the Federal Reserve.
On Wednesday, the Federal Open Market Committee (FOMC) will meet to decide interest-rate changes, and markets are betting on a 0.25% cut.

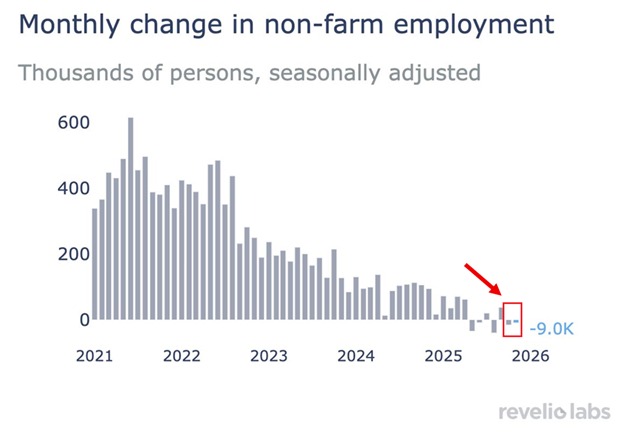
Recent jobs data points to deterioration in the labor market — and hence more of a need to lower rates. Analysis sees the Fed pinned between a rock and a hard place as inflation remains a problem that would be exacerbated by a cut.
“Nonfarm payrolls have now posted 5 declines over the last 7 months, the worst streak in at least 5 years,” trading resource The Kobeissi Letter wrote in part of a weekend X post on US employment data.
“Deterioration of the job market is accelerating.”
Analytics resource Mosaic Asset Company struck a more optimistic tone, seeing an ideal combination of tailwinds for risk assets.
“With inflation above target, the economy holding up fine, and the S&P 500 near all-time highs, the Fed looks set to cut rates for a third consecutive meeting,” it summarized in the latest edition of its regular newsletter, “The Market Mosaic.”
Mosaic added that it “can’t imagine more bullish conditions to help drive the stock market than rate cuts into loose financial conditions with the economy showing signs of continued growth which supports the earnings outlook.”
On FOMC day, meanwhile, markets will watch Fed Chair Jerome Powell for signals over future policy trajectory as he delivers a speech and takes press questions after the rate announcement.
This weekend, Kobeissi described Powell’s dismissal of “stagflation” risks at the May 2024 FOMC press conference as “the day the Fed lost control.”
May 4th, 2024: The day the Fed lost control.
— The Kobeissi Letter (@KobeissiLetter) December 6, 2025
Fed Chair Powell responds to concerns about stagflation, "I don't see the stag or the flation."
18 months later, inflation is still at 3%+ and the labor market is at its weakest level since the pandemic.
Own assets. pic.twitter.com/gpBdXnfH7Y
Santa rally buzz gets Fed proviso
If stocks are in for a perfect cocktail of bullish catalysts to round out the year, crypto commentators are already discussing the odds of the “Santa rally” spilling over.
The Santa rally is real, but the timing is all over the place.
— Mister Crypto (@misterrcrypto) December 6, 2025
Will we get a Santa rally this year? 👇 pic.twitter.com/YnsAjXqBbx
As Cointelegraph reported, crypto has vastly underperformed stocks in Q4, with the S&P 500 just inches from new all-time highs.
Network economist Timothy Peterson notes that the stars tend to align for Bitcoin more often than not into year end.
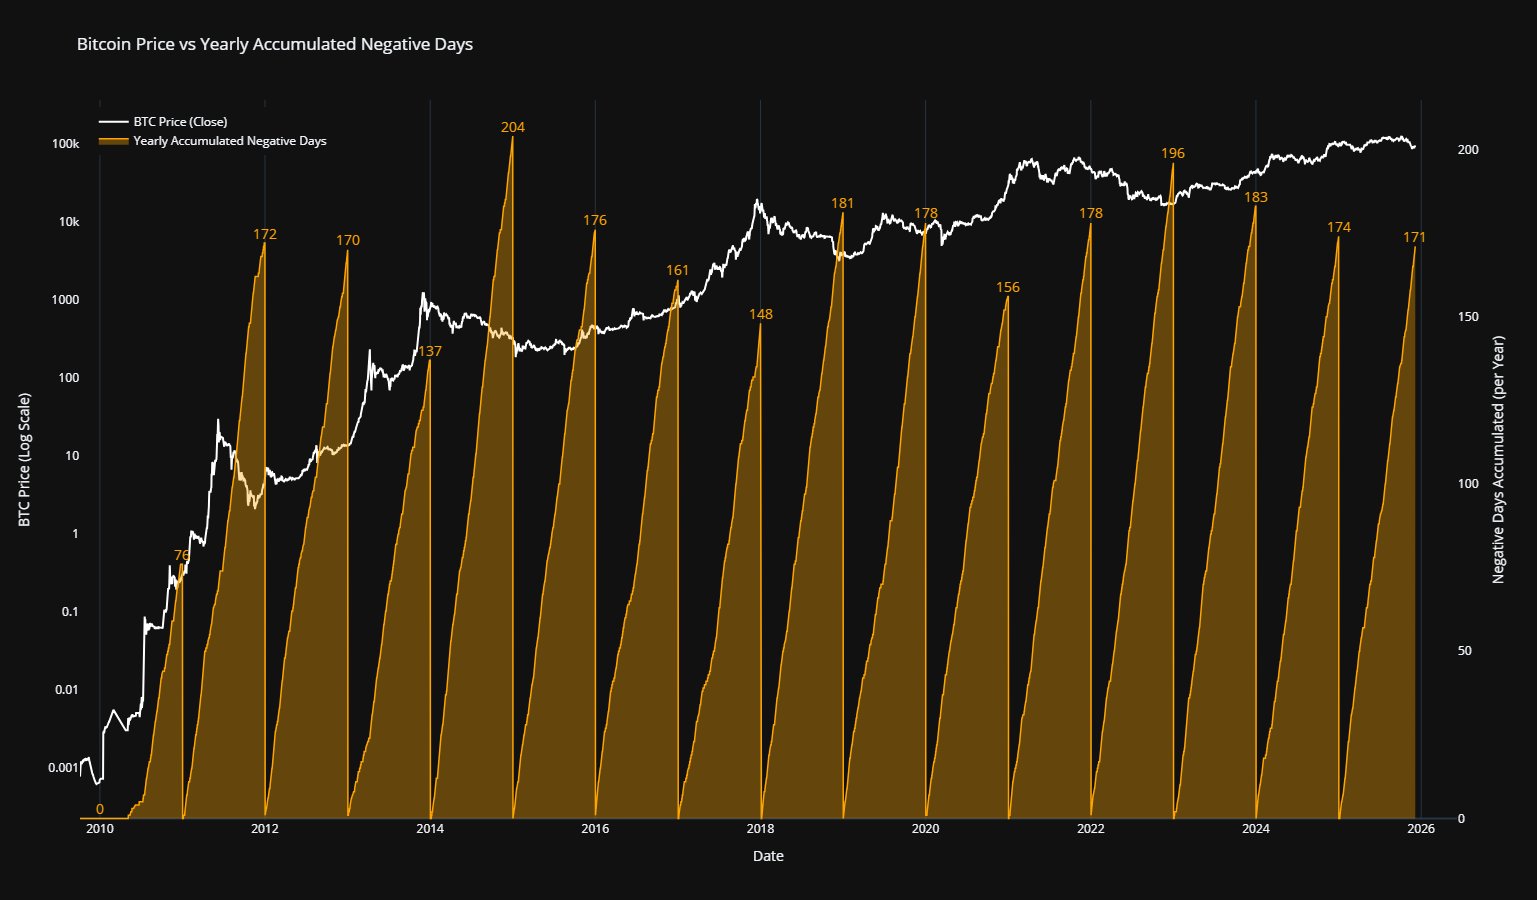
Among those taking the opposite side, however, is Joao Wedson, founder and CEO of crypto analytics platform Alphractal. BTC/USD, he argued, is due a “sideways” end to 2025.
“Every year, Bitcoin spends an average of 170 days in negative territory,” Wedson explained alongside a chart of accumulated negative BTC price trading days.
“In 2025, it has already accumulated 171 negative days — which strongly suggests this year is likely to close in a sideways price range. If a deeper drop is coming, it will most likely happen in 2026.”
Earlier, Cointelegraph reported on the Santa outcome still being at the mercy of the Fed.
“The pullback in the S&P 500 from late October into November happened alongside falling odds for another rate cut this month. Recent comments from key Fed officials helped drive odds for a cut back higher, which also sparked a recovery in the stock market,” Mosaic Asset Company agreed.
Is $89,000 the new $16,000 for Bitcoin?
When it comes to Bitcoin price cycles and seasonality, the latest data gives bulls reason to stay confident on the outlook.
Uploaded to X this weekend by Peterson, a comparison between BTC/USD this year and in 2022-23 suggests that a long-term price bottom should be either complete or around the corner.
In late 2022, Bitcoin put in a multiyear low of $15,600 as it bottomed out after a brutal bear market in which it lost 80% versus old all-time highs.
Its rebound set in as soon as 2023 began, and if history were to repeat, hodlers may have just weeks to wait until upward momentum returns.
“$89,000 is the new $16,000,” Peterson summarized.
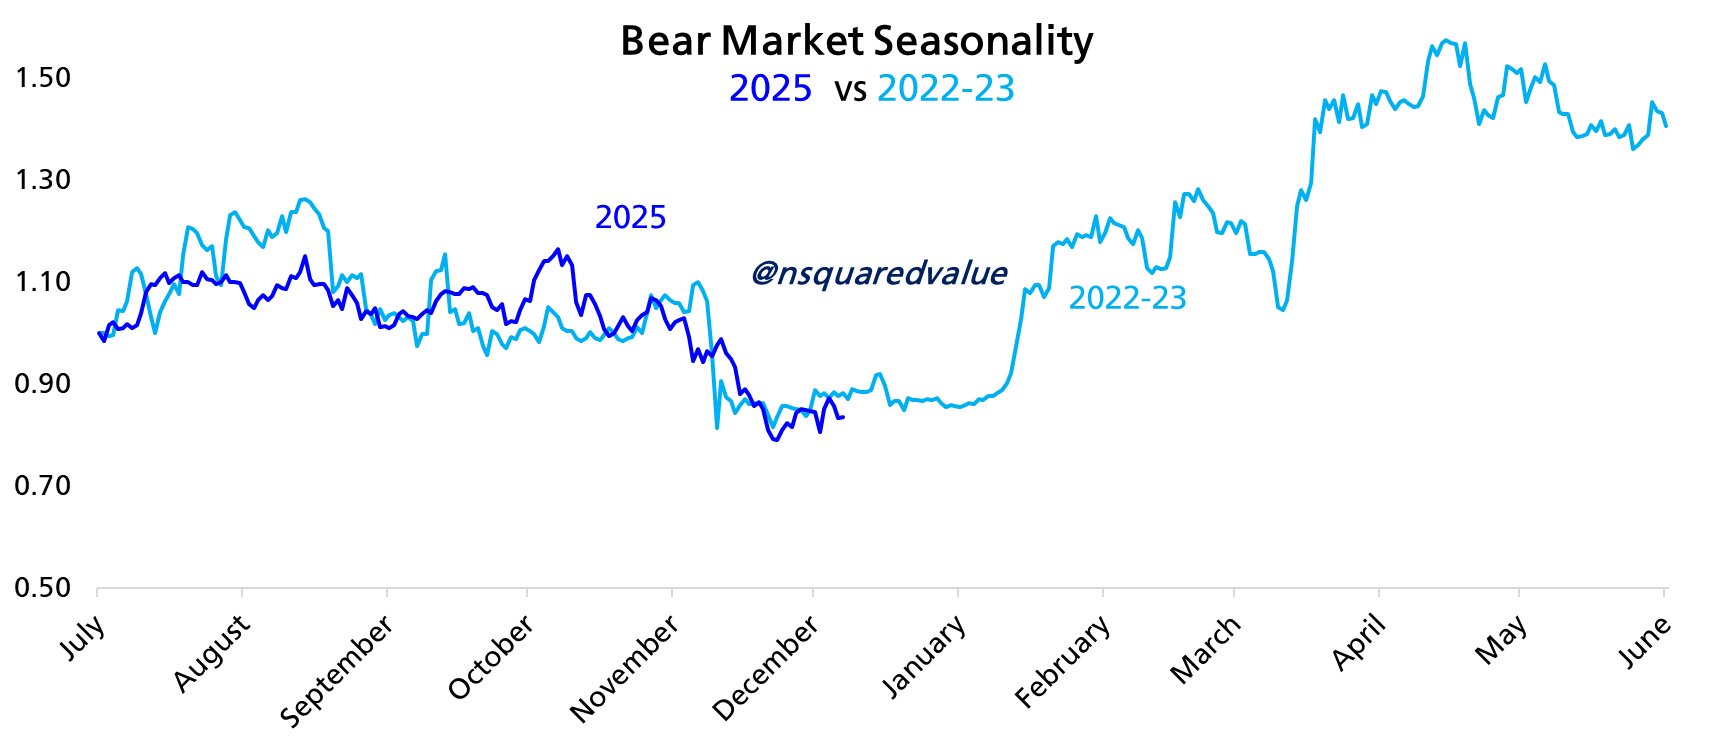
As Cointelegraph reported, comparisons to 2022 have become more frequent since October, when Bitcoin abruptly abandoned its successive run of new all-time highs to dive 36% over a six-week period.
In late November, Peterson said that the price correlation with 2022 had reached 98% on monthly timeframes.
Open interest spells out Bitcoin “apathy”
An encouraging signal from Bitcoin derivatives markets is keeping a full-on market rally possible.
Related: Bitcoin profit metric eyes 2-year lows in 'complete reset:' BTC analysis
New data from onchain analytics platform CryptoQuant confirms that open interest (OI) across Bitcoin exchanges has dropped to its lowest levels since April, when BTC/USD traded at $75,000.
“This decline typically reflects two things: 1) investor capitulation, or 2) investor apathy,” contributor COINDREAM commented in one of CryptoQuant’s “Quicktake” blog posts Monday.
“Historically, periods of apathy and low participation have often marked attractive buy-the-dip opportunities.”
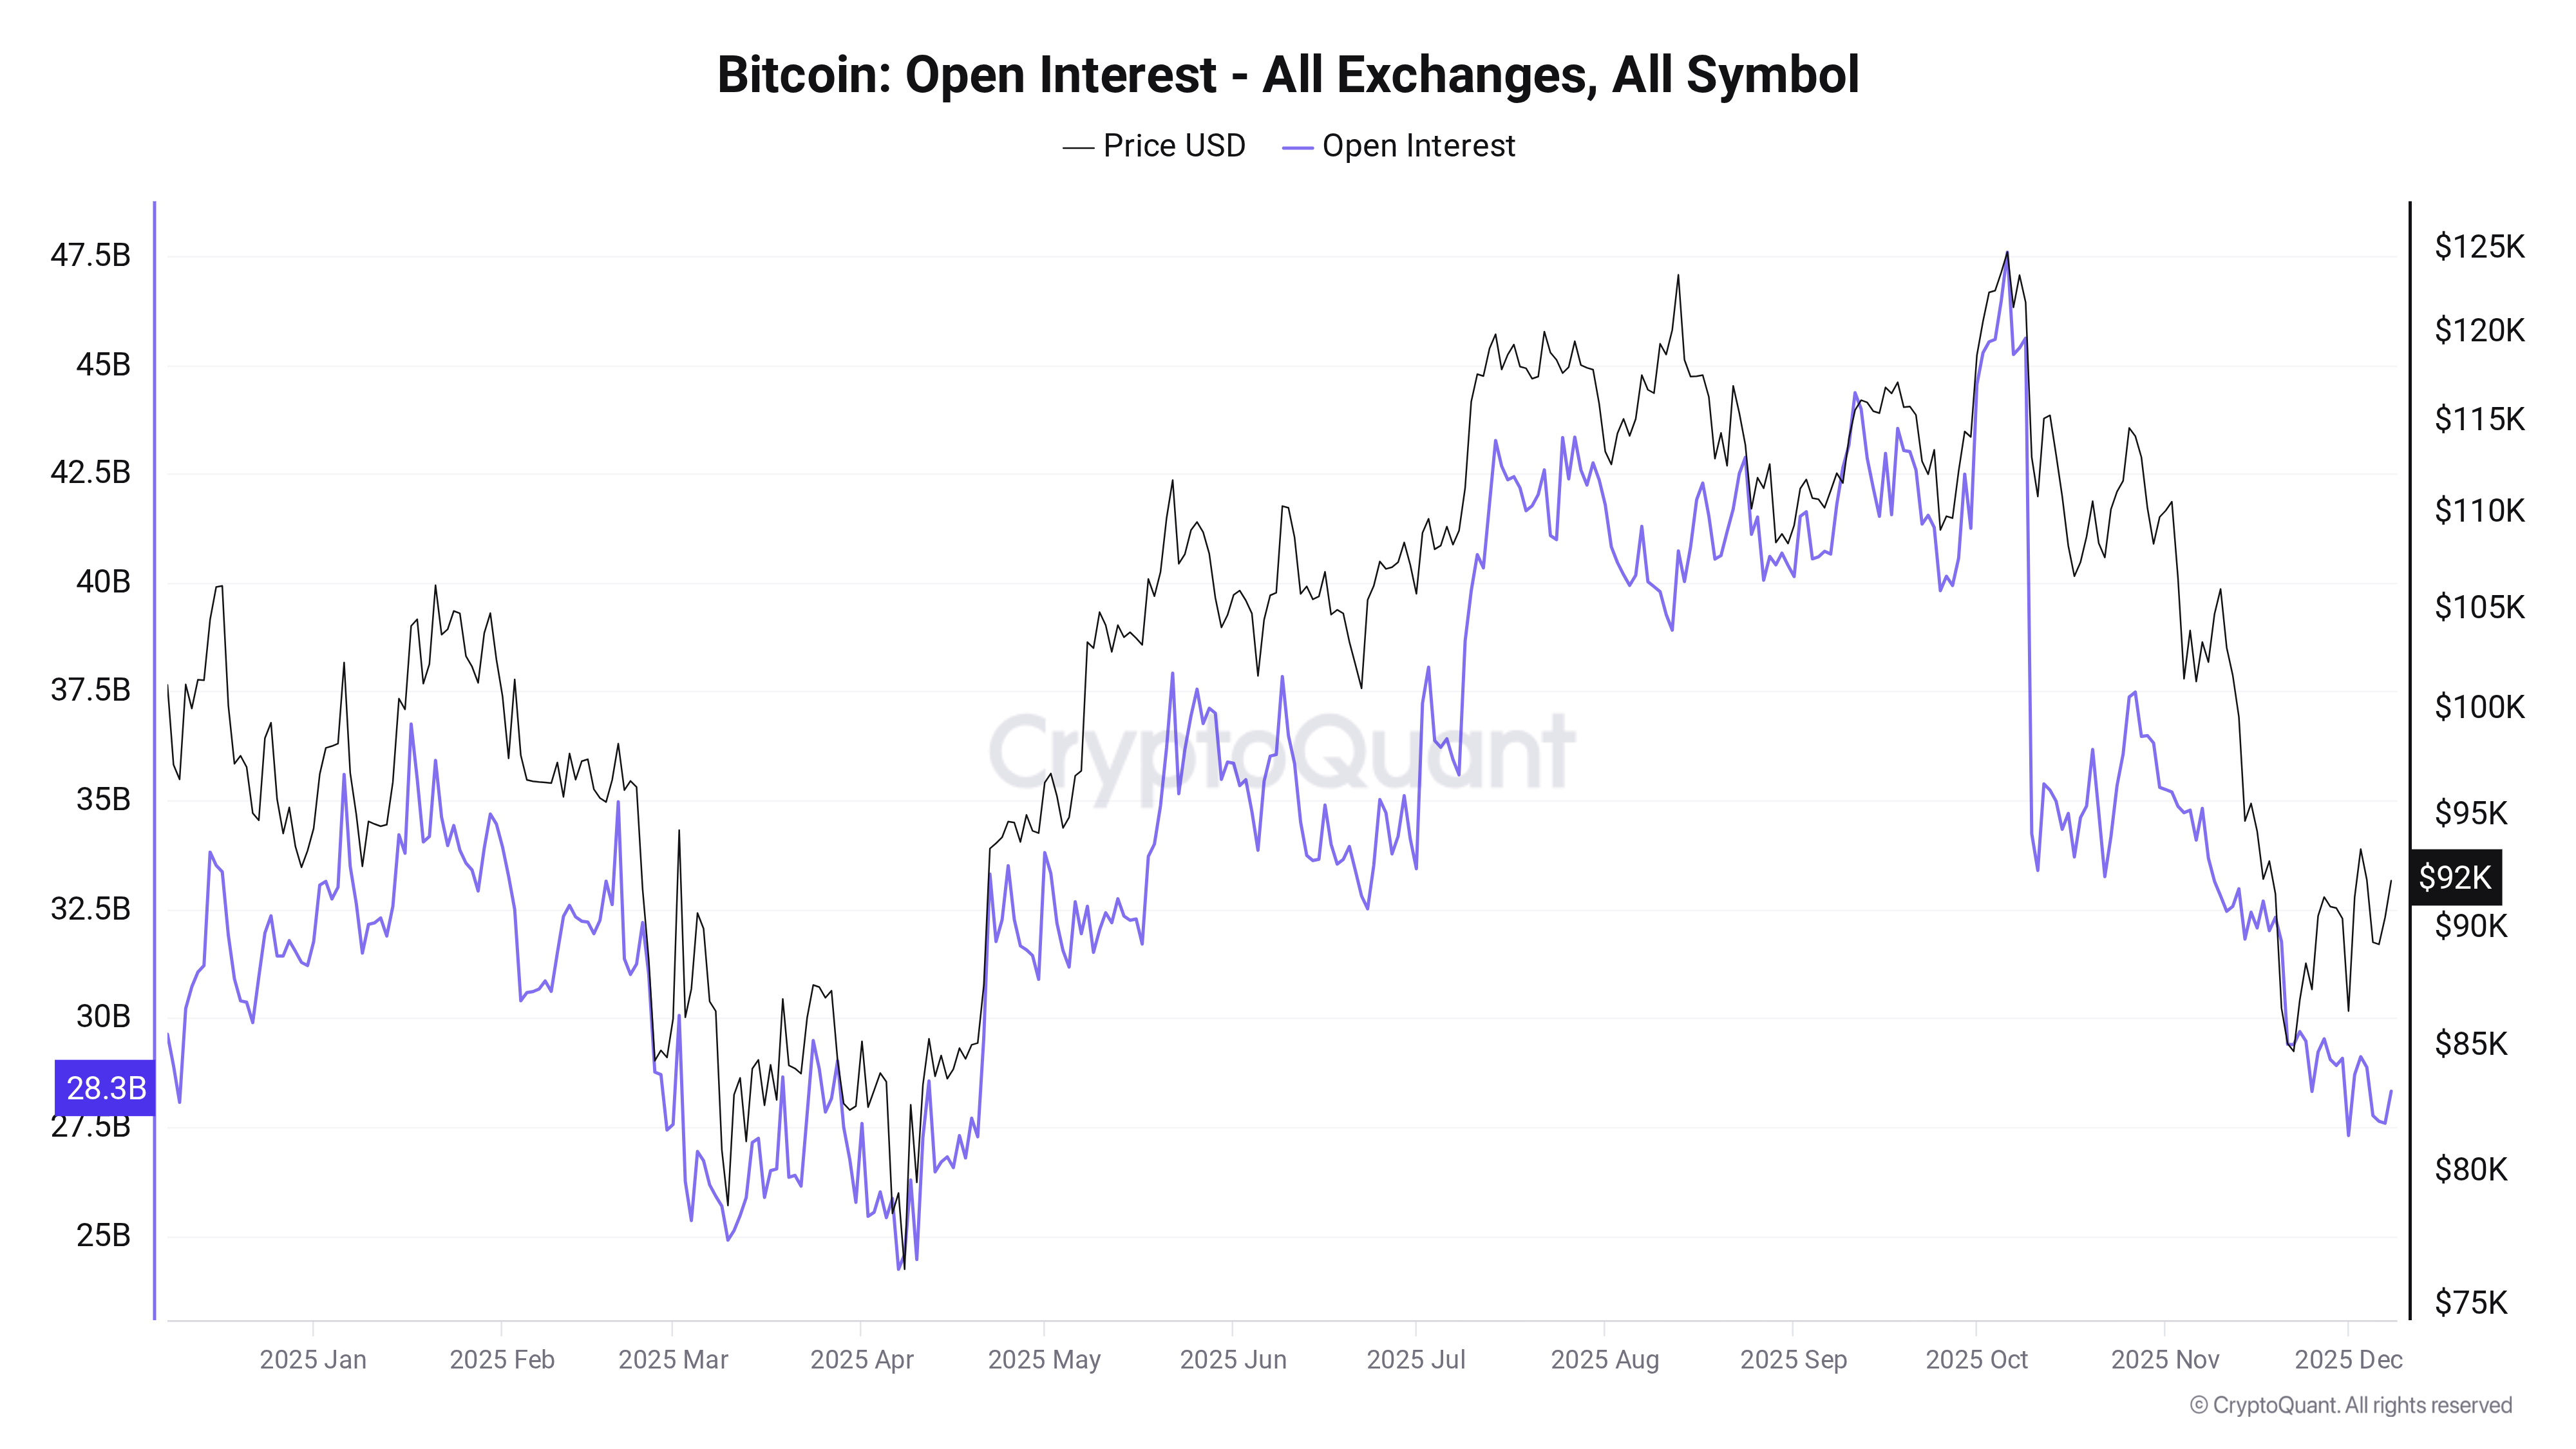
COINDREAM noted that despite the modest BTC price rebound versus recent lows of $80,500, traders have not been tempted to deploy leverage.
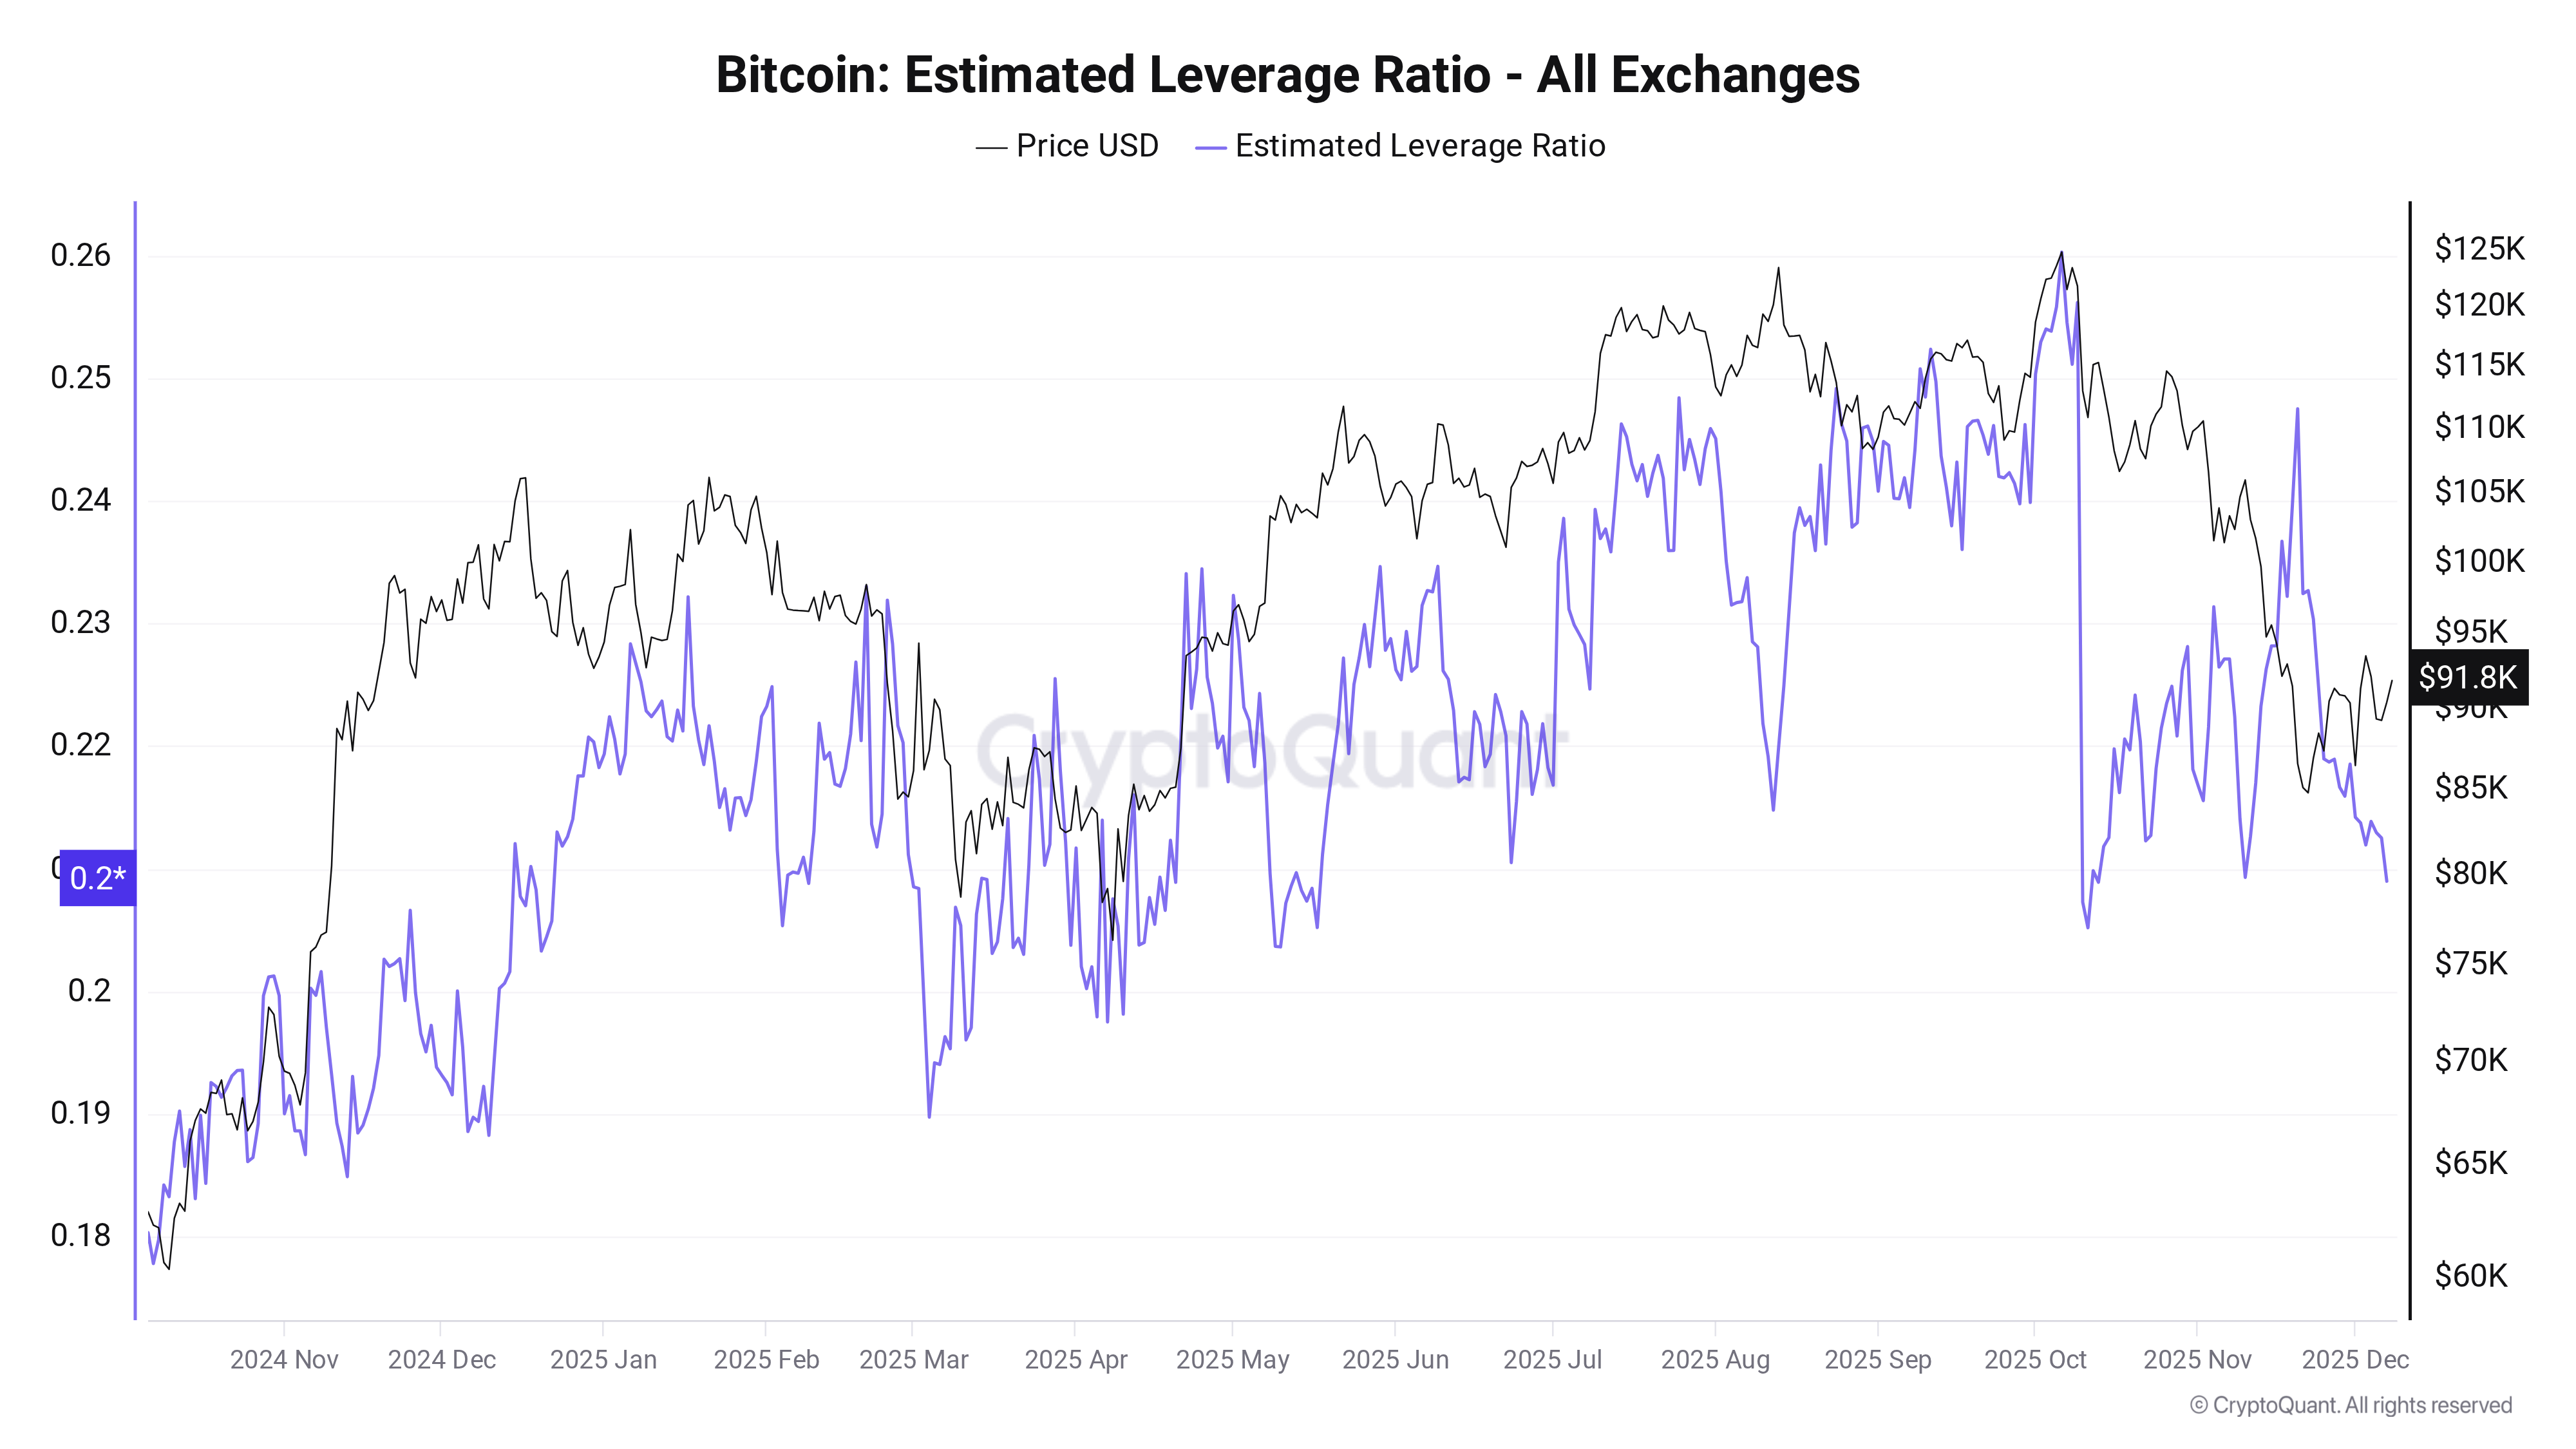
“Excessive leverage usually acts as a drag on market direction. However, as prices have recently rebounded, leverage levels have normalized, reducing systemic risk,” it continued.
CryptoQuant’s estimated leverage ratio metric, which divides OI by BTC reserves, has declined significantly since mid-November.
This article does not contain investment advice or recommendations. Every investment and trading move involves risk, and readers should conduct their own research when making a decision.