Bitcoin's ‘bear flag pattern’ targets $67K as BTC spot demand slumps

cointelegraphОпубликовано 2025-12-09Обновлено 2025-12-09

Введение

Bitcoin (BTC) is showing bearish signals with analysts warning of a potential drop toward $67,000. A bear flag pattern has formed on the daily chart, and a break below $90,000 could trigger a 25% decline. Weak spot buying, negative cumulative volume delta (CVD), and outflows from Bitcoin ETFs indicate reduced demand and increased selling pressure. While some analysts suggest a possible bottom near $74,000–$77,000, low trading volume and macroeconomic uncertainty are limiting upward momentum. Recent ETF outflows and fading institutional interest suggest continued caution among investors.

Bitcoin (BTC) price action has painted bearish continuation patterns on its daily chart, which may propel BTC to new lows, according to analysts.

Key takeaways:

  • A sharp decline in spot buying and weakening ETF demand suggests that the upside may be limited.

  • Bitcoin’s bear flag pattern on the daily time frame targets $67,000 BTC price.

BTC price could bottom at $66,000

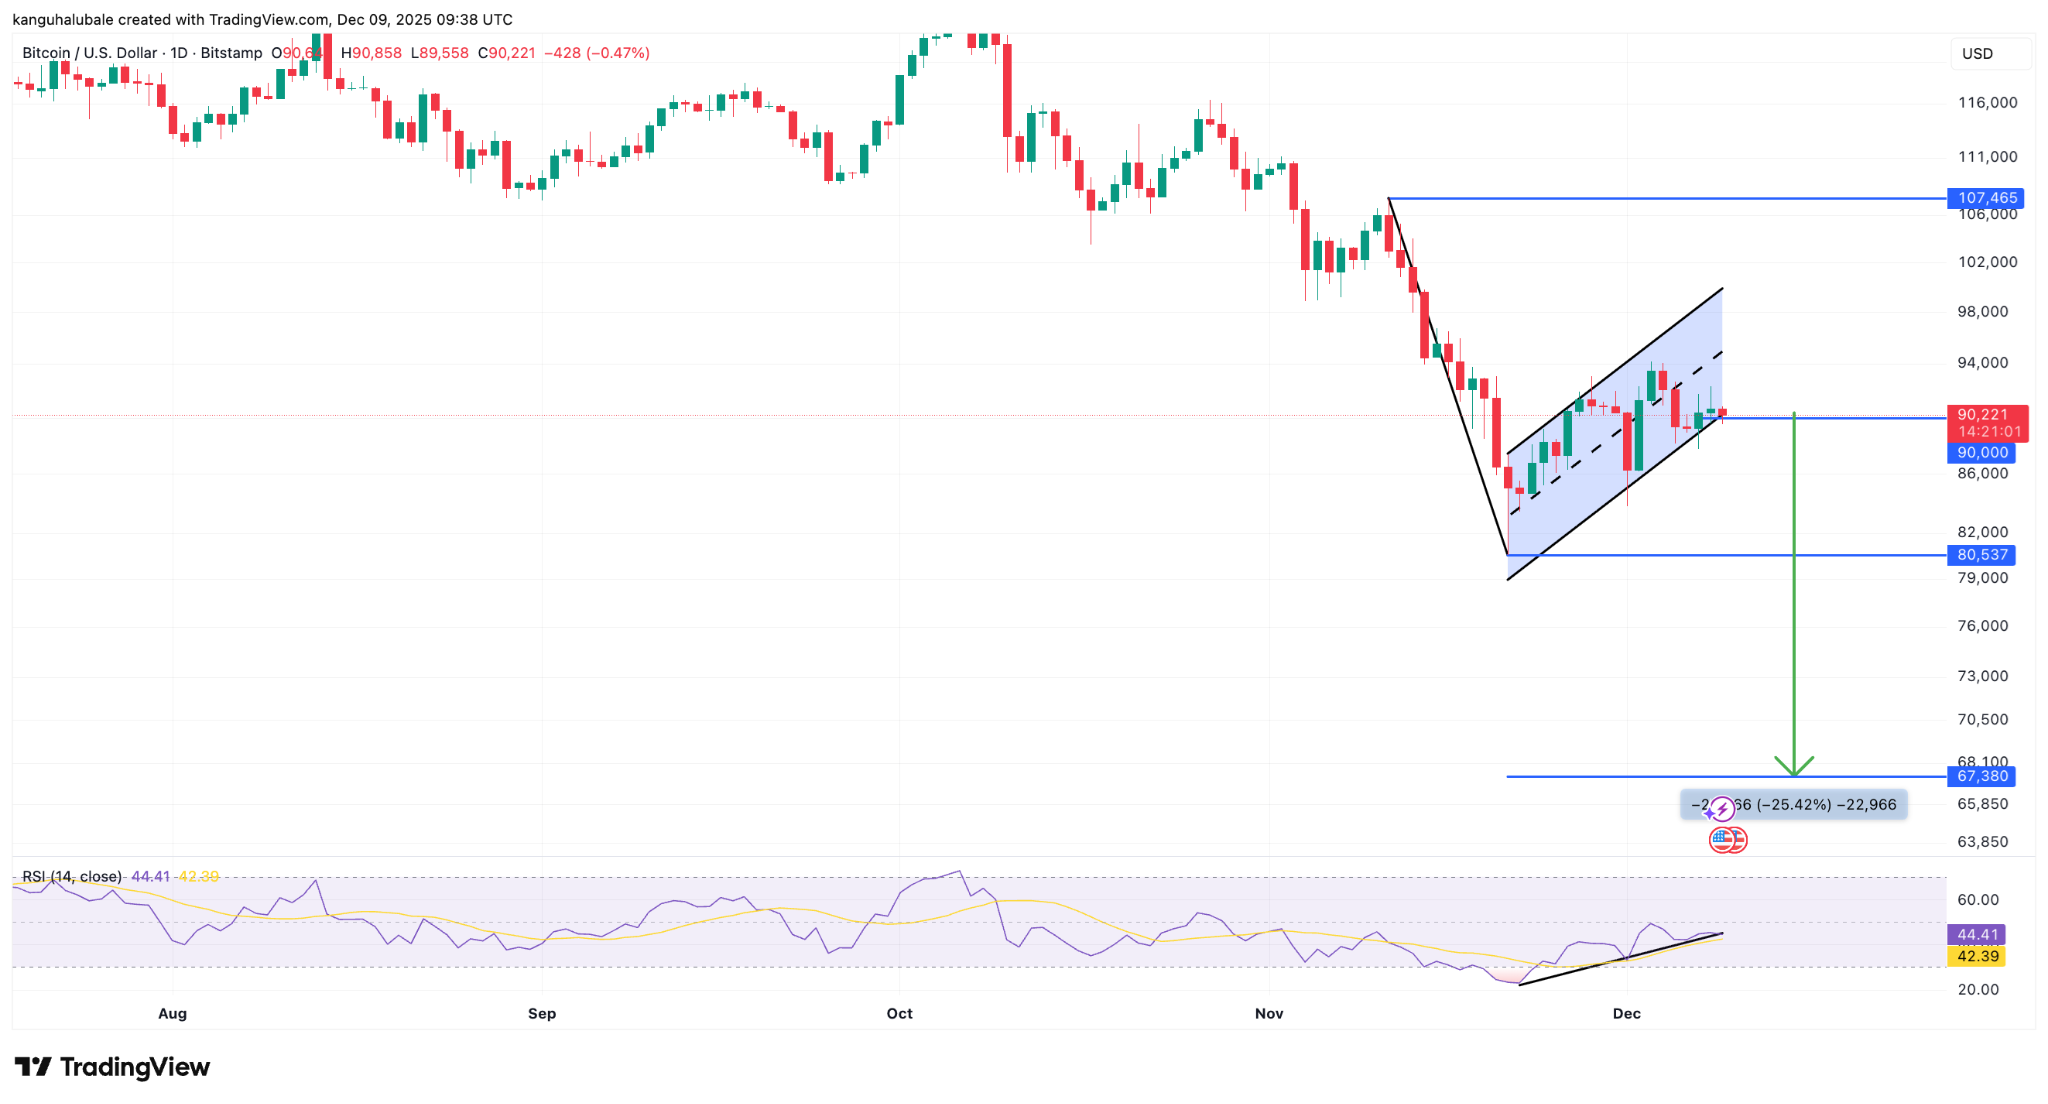
The BTC/USD pair has formed a bear flag on the daily chart, as shown in the figure below. This bear flag formed following Bitcoin’s drop from $107,000 highs on Nov. 11, and the recent rebound was rejected from the flag’s upper boundary around $93,000.

Related: Bitcoin retail inflows to Binance ‘collapse’ to 400 BTC record low in 2025

A daily candlestick close below the flag’s lower boundary at $90,000 may open the way for a drop toward the measured target of the pattern at $67,380, or around the 2021 price top. This would represent a 25% drop from the current price.

BTC/USD daily chart. Source: Cointelegraph/TradingView

“Indicators (MACD and RSI) were extremely oversold, and this movement allows them to cool off so we can continue our downtrend,” said trader Roman in a Tuesday post on X, referring to Bitcoin’s consolidation inside the flag.

Pseudonymous analyst Colin Talks Crypto said that although a move down would be the expected outcome from the flag’s validation, the $74,000-$77,000 zone “would be the likeliest bottom,” adding:

“I would also expect a powerful rebound if such a level is reached.”

Meanwhile, crypto trader Aaron Dishner said that BTC price is likely to revisit $92,200, then near $98,000 under the upper bear flag line, before continuing the downtrend.

“Volume remains too weak to drive higher highs.”

As Cointelegraph reported, Bitcoin’s failure to successfully retest the yearly open above $93,000, caused by macroeconomic uncertainty, liquidations and stagnant spot ETF flows, is causing traders to retreat from Bitcoin.

Bitcoin could drop due to weaker demand

Bitcoin’s ability to push past the yearly open above $93,000 appears limited due to the absence of buyers.

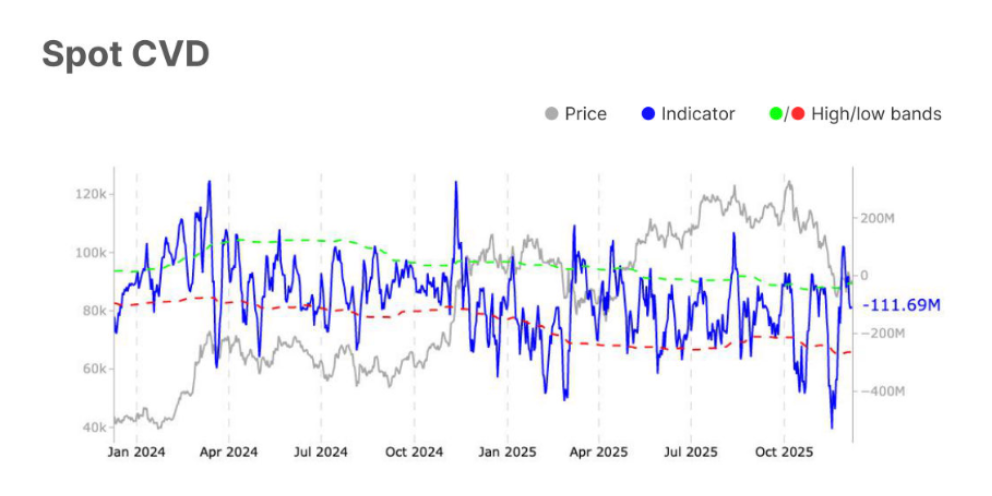
Bitcoin’s spot cumulative volume delta (CVD), an indicator that measures the net difference between buying and selling trade volumes, shows net spot buying on exchanges remains negative even after Bitcoin’s recent rebound.

Bitcoin’s Spot CVD weakened from -$40.8 million to -$111.7 million over the last week, “pointing to stronger underlying sell pressure,” Glassnode said in its latest Market Impulse report, adding:

“This sharp drop signals a clear rise in aggressive selling, suggesting softer buyer conviction and a short-term tilt toward bearish sentiment.”
Bitcoin spot CVD. Source: Glassnode

Spot Bitcoin ETF demand slowed down last week, flipping from a $134.2 million inflow to a $707.3 million outflow, the market intelligence provider wrote, adding:

“The shift points to profit-taking or softer institutional demand, reflecting a more cautious tone as investors reassess positioning.”

These investment products experienced another $60 million in outflows on Monday, according to data from Farside Investors.

As Cointelegraph reported, Bitcoin’s recent rebound could be a bull trap, with some analysts predicting as low as $40,000 over the coming months.

This article does not contain investment advice or recommendations. Every investment and trading move involves risk, and readers should conduct their own research when making a decision.


Похожее

Champion! Huobi HTX Tops the Industry with $583.7M Net Asset Inflow Over the Past 30 Days

In the competitive crypto industry, fund flows reveal true user trust. According to Defillama data on December 5, Huobi HTX recorded a net inflow of $583.7M over the past 30 days, ranking first among all centralized exchanges (CEXs). This reflects growing user confidence in the platform’s security, transparency, and product offerings. Huobi HTX has maintained steady growth in total assets and spot trading volume, forming a positive cycle of asset safety, user growth, and capital inflow. Key factors behind this performance include enhanced asset proof mechanisms—with 38 consecutive months of published Merkle Tree Proof of Reserves (PoR) and 100%+ reserve ratios for major assets—alongside improved C2C trading features such as a "100% compensation" policy and a streamlined user experience. The platform’s earn products, including Huobi Earn, also saw significant growth, with increases in both user participation and asset deposits for tokens like USDD, ETH, and TRX. Users are increasingly choosing Huobi HTX for its reliable yields, ease of use, and strong security measures during market volatility. As a long-established exchange founded in 2013, Huobi HTX has strengthened its compliance and risk management frameworks, reinforcing its reputation for safety and transparency. The net inflow milestone underscores its position as a trusted platform where users choose to securely store and grow their digital assets.

深潮1 мин. назад

Champion! Huobi HTX Tops the Industry with $583.7M Net Asset Inflow Over the Past 30 Days

深潮1 мин. назад

From 'Stablecoin First Stock' to 'Ankle Cut' in Stock Price: Why Circle Quickly Fell from the Spotlight into a Revaluation Cycle

From "Stablecoin Unicorn" to "Ankle-Cut" Stock Price: Why Circle Quickly Fell from Its Peak into a Revaluation Cycle Circle, the issuer of the USDC stablecoin, experienced a dramatic stock price decline shortly after its IPO in June, dropping from an initial peak of around $260 to approximately $88. This reflects a broader market shift from hype-driven optimism to a more rational reassessment of the stablecoin industry. Multiple factors contributed to this sharp correction. Initially, the stock was significantly overvalued due to market enthusiasm for the "first stablecoin stock" and the high-interest environment that boosted the appeal of its reserve-backed revenue model. As early investors took profits and sentiment cooled, a price correction was inevitable. Increased competition is also pressuring Circle. While USDC is the world's second-largest dollar stablecoin, it faces growing challenges from new stablecoin projects and digital dollar initiatives from traditional financial institutions. The sector is shifting from an oligopoly to intense competition, raising investor concerns about USDC's future growth certainty. Furthermore, macroeconomic interest rate trends pose a fundamental risk to Circle's business model. Its core revenue comes from interest earned on the cash and short-term U.S. Treasuries backing USDC. Expectations that the Federal Reserve may begin a rate-cutting cycle could directly compress this income. Rising operational and distribution costs further squeeze profitability. Analysts hold divergent views on Circle's future. Firms like Mizuho have turned bullish, upgrading the stock and suggesting the sell-off related to its post-IPO lockup expiration may have created a buying opportunity. They point to USDC's continued adoption by mainstream financial institutions. Conversely, analysts at firms like Susquehanna remain pessimistic, maintaining an "Underperform" rating. They warn that lower future interest rates and potential underperformance in USDC growth could continue to pressure the stock price and have lowered their price target. The upcoming end of the post-IPO lockup period, which restricts insiders from selling shares, has added near-term selling pressure, but this is viewed by some as a temporary overhang. Circle's recent Q3 earnings report, which beat expectations for both revenue and profit, shows that these fundamental concerns have not yet materialized, leaving the company's trajectory highly dependent on future interest rates and its ability to maintain and grow USDC's market share amidst fierce competition.

cointelegraph_中文2 мин. назад

From 'Stablecoin First Stock' to 'Ankle Cut' in Stock Price: Why Circle Quickly Fell from the Spotlight into a Revaluation Cycle

cointelegraph_中文2 мин. назад

Торговля

Спот
Фьючерсы
活动图片