«Импульс Биткоина набирает обороты», но вот уровни цены BTC, за которыми все еще нужно следить
Участники рынка Биткоина (BTC) считают, что годовое открытие выше $93 000 особенно важно по мере приближения еженедельного закрытия.

Анализ Биткоина определил ключевые уровни цены BTC, за которыми нужно следить перед выходными, с особым вниманием к годовому открытию выше $93 000.
Ключевые моменты:
Определены ключевые уровни цены BTC выше и ниже текущей цены, поскольку BTC готовится к еженедельному закрытию.
Закрытие на недельном таймфрейме выше $93 000 становится еще более важным для подтверждения восстановления рынка.
Данные on-chain выявляют ключевые уровни для наблюдения
Хотя BTC в начале недели отскочил от $84 000 до впечатляющих уровней, бычий настрой был подавлен продавцами, сосредоточенными около годового открытия в $93 000.
Данные CryptoQuant показывают, что текущая цена торговой пары BTC/USD ниже средней цены реализации (стоимостной основы) большинства возрастных групп, что, по словам аналитика Darkfost, указывает на нестабильность рынка.
Darfost написал в пятницу в посте на X: «Первая область, которую мы хотим, чтобы BTC отвоевал, — это цена реализации самых молодых долгосрочных держателей (LTH)», имея в виду стоимость приобретения BTC, удерживается от 6 до 12 месяцев, которая составляет около $97 000.
«Этот уровень знаменует переход между краткосрочными держателями (STH) и LTH», — написал аналитик, добавив:
«Прорыв этого уровня вернет этих инвесторов в зону комфорта, восстановит их ожидания потенциальной прибыли, побудив их продолжать удерживать, а не продавать, что принесет некоторую стабильность».
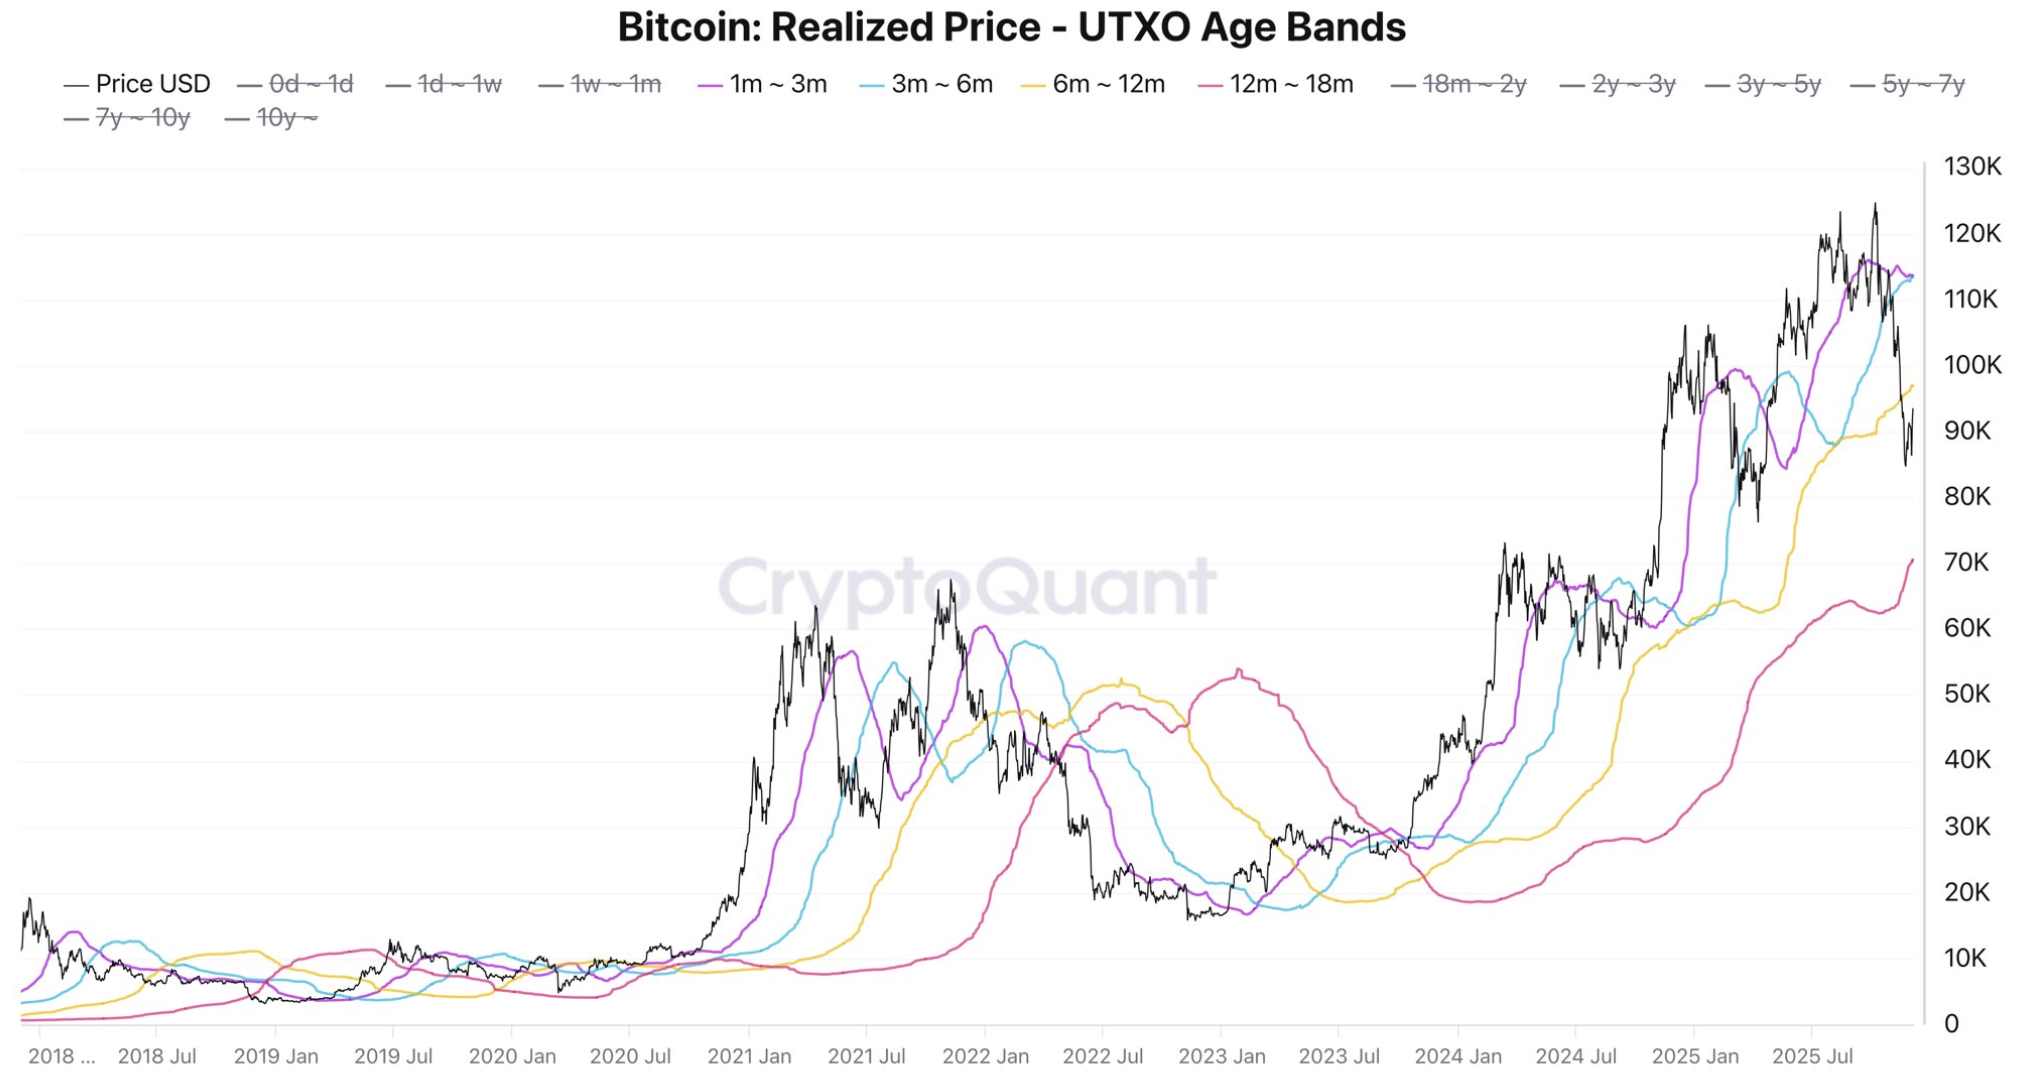
Darkfost добавил, что если не удастся закрыться выше $97 000, то «следует сохранять осторожность».
На стороне поддержки первый крупный уровень поддержки находится на $88 000, что представляет собой нижнюю границу диапазона движения цены BTC на старших таймфреймах, как отметил аналитик Daan Crypto Trades.
$BTC Has retaken the previous range with this bounce.
— Daan Crypto Trades (@DaanCrypto) December 4, 2025
Still a lot of work to do but at least the insane selling has stalled for the time being.
Ideally this doesn't lose that ~$88K region again on the higher timeframes. https://t.co/d2MWZWpixn pic.twitter.com/TszeyRGfyF
Как сообщал Cointelegraph, прорыв и закрытие ниже границы $93 000 на уровне $91 000 подтвердит продолжение нисходящего тренда к $68 000.
Быки BTC должны закрыть неделю выше $93 000
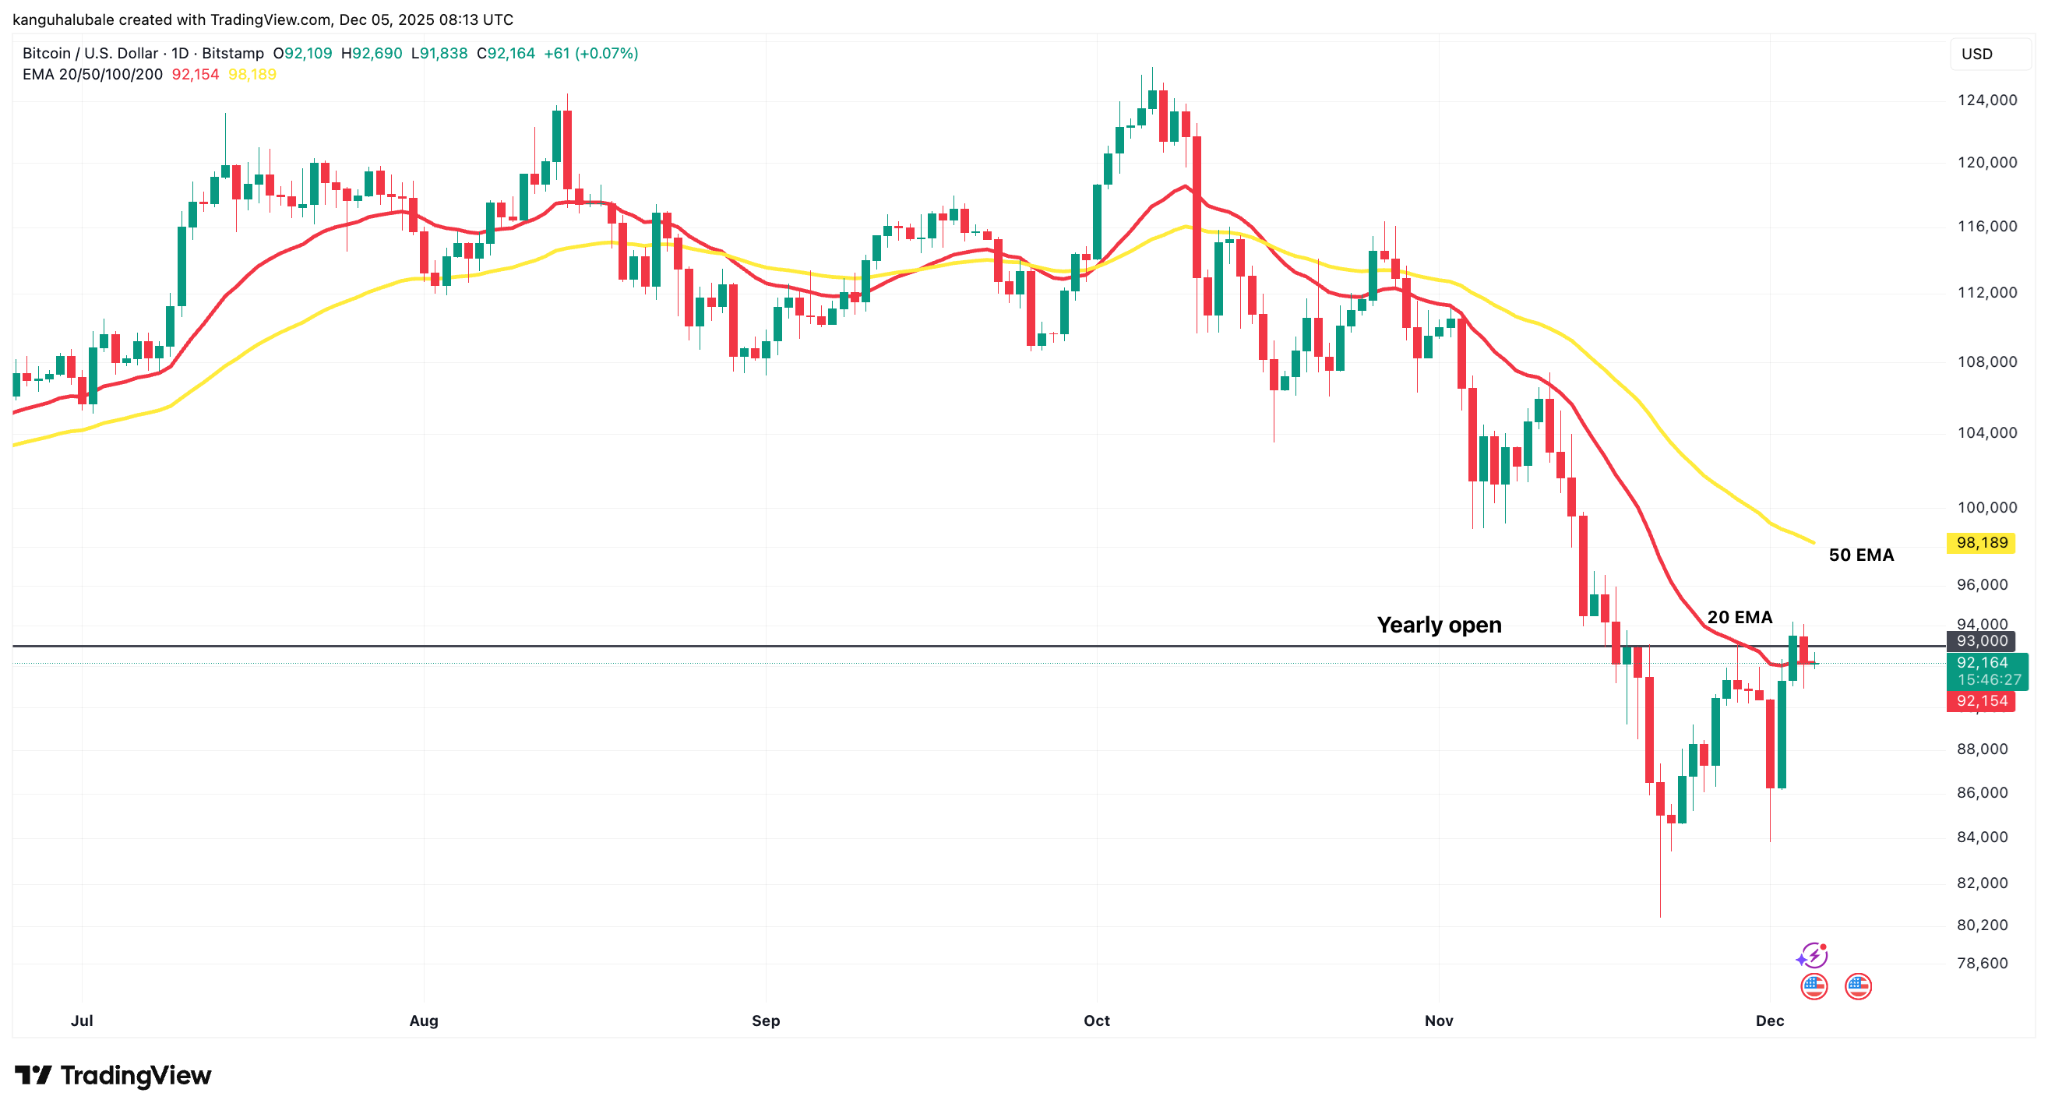
Данные от Cointelegraph Markets Pro и TradingView показывают, что BTC/USD колеблется вниз, изо всех сил пытаясь удержаться на уровне $92 000.
Это указывает на то, что цена по-прежнему находится под давлением и не может пробиться выше годового открытия в $93 000.
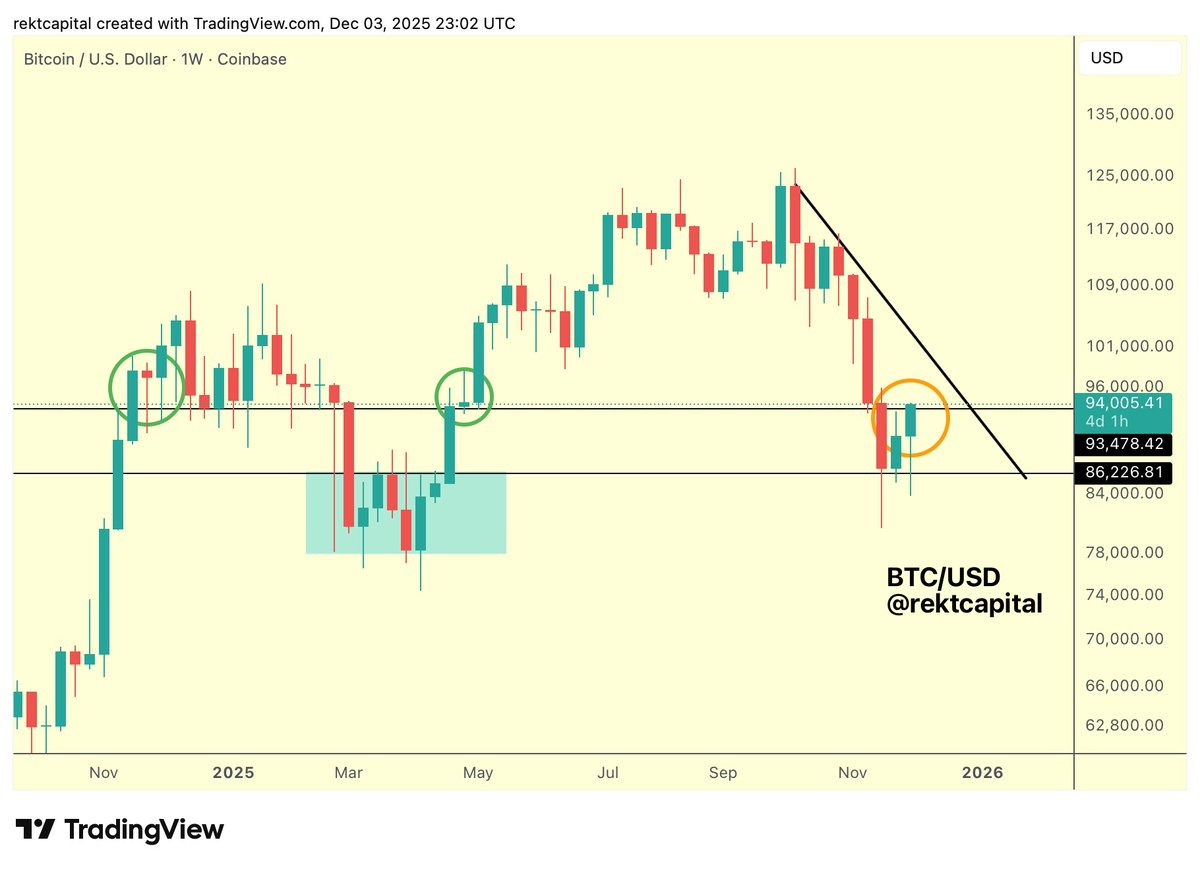
Аналитик Rekt Capital в недавнем посте на платформе X указал, что это совпадает с «сопротивлением в области максимумов $93,5K», добавив:
«Закрытие недели выше $93,5K и повторное тестирование этого уровня в качестве новой поддержки после пробоя (как показано в предыдущих зеленых кружках) подтвердит пробой диапазона».
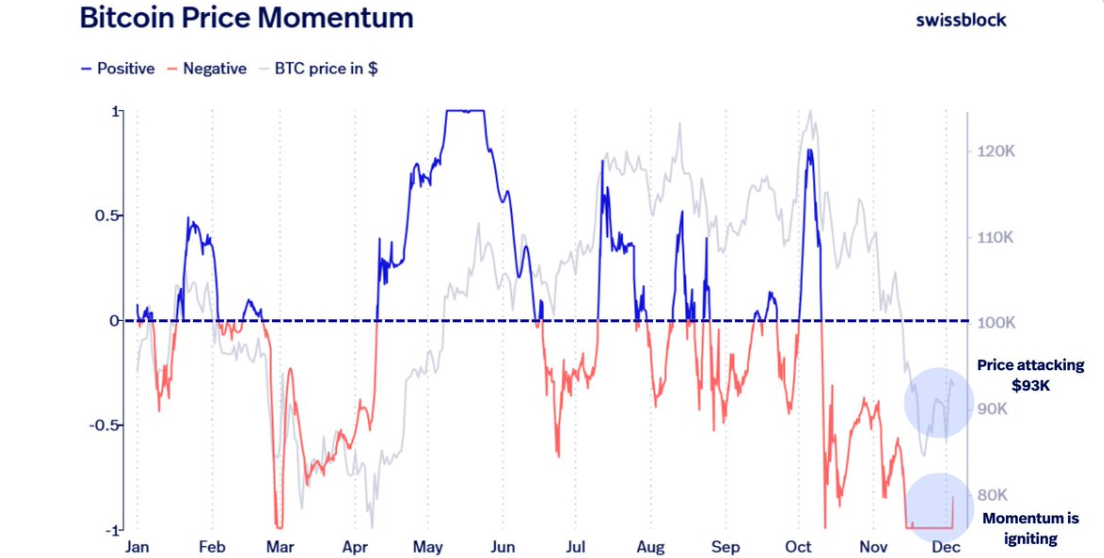
Частный управляющий капиталом Swissblock заявил, что «импульс вновь набирает обороты» по мере того, как BTC пытается закрепиться выше годового открытия в $93 000–93,5 тыс. долларов после нескольких недель полностью негативного состояния.
Swissblock далее заявил, что если BTC сможет удержать $93 000, «следующей краткосрочной целью будет прорыв $95 000».
Другой аналитик, AlphaBTC, указал, что он ожидает отскока цены от текущих уровней, что в последней волне роста приведет к закрытию недели выше текущего годового открытия, которое сейчас выступает в качестве сопротивления.
Как сообщалось Cointelegraph, медленный тренд BTC в декабре может измениться по мере сокращения рычагов и повторного завоевания ключевых технических уровней, что указывает на формирование более стабильной структуры рынка.
Рекомендуем: Сооснователь 21Shares предсказывает: бычий тренд Биткоина (BTC), вероятно, возобновится в следующем месяце, высока вероятность новых максимумов
Эта статья не содержит инвестиционных рекомендаций или советов. Каждое инвестиционное и торговое действие связано с риском, читатели должны провести собственное исследование при принятии решения. Несмотря на то, что мы стремимся предоставлять точную и своевременную информацию, Cointelegraph не гарантирует точность, полноту или надежность любой информации в этой статье. Эта статья может содержать прогнозные заявления, на которые влияют риски и неопределенности. Cointelegraph не несет ответственности за любые убытки или ущерб, возникшие в результате reliance на эту информацию.


