Arbitrum gains 10% as volume spikes – Can ARB break supply zone?

ambcryptoОпубликовано 2026-04-08Обновлено 2026-04-08

Введение

ARB gained 10% in 24 hours, supported by a 40% surge in trading volume exceeding $100 million, indicating strong demand. The token is testing a key supply zone near $0.1031. While the Stochastic RSI suggests potential exhaustion, on-chain data shows whale accumulation reducing supply, and derivatives reflect bullish sentiment with a Long/Short Ratio of 1.6. A break above the resistance could target $1.1, but failure may lead to consolidation. The rally's sustainability depends on continued volume and buying pressure.

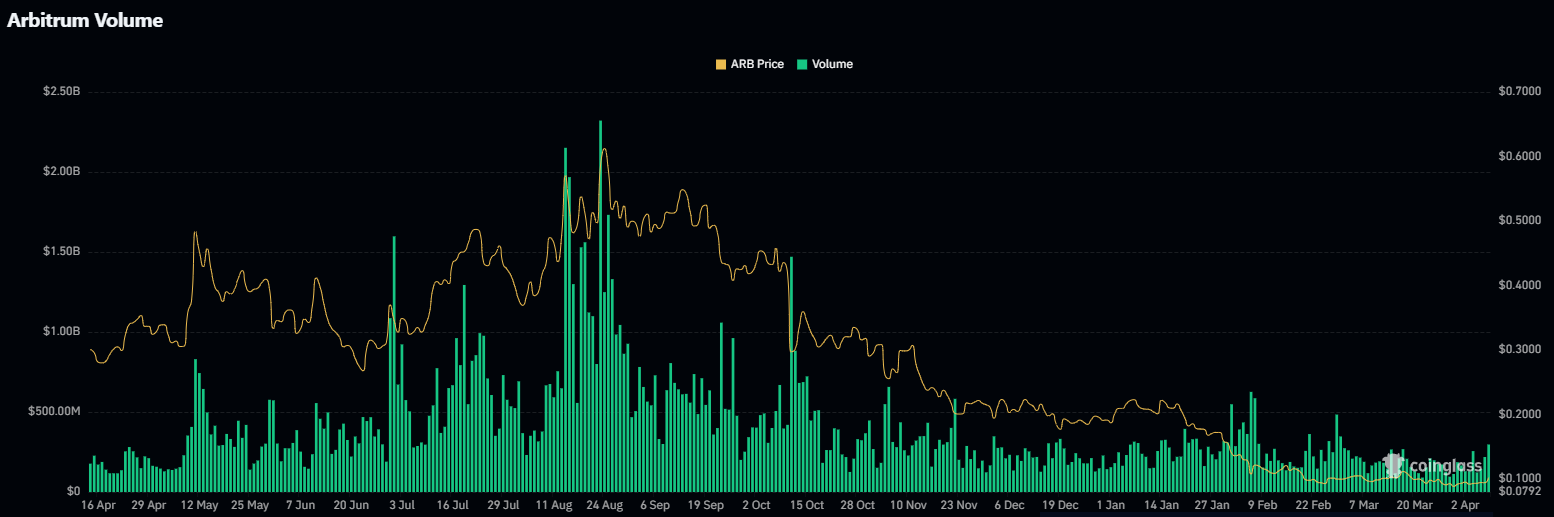
Arbitrum gained momentum as price and activity increased over the past 24 hours.

The token, ARB, rose 10%, supported by a sharp rise in market participation. Trading Volume climbed 40%, crossing $100 million.

That expansion suggested growing demand rather than fading interest. However, the Stochastic RSI signaled caution near current levels.

Is volume driving ARB’s rally?

Trading activity surged alongside price, strengthening the current move. The rise in Trading Volume indicated fresh participation rather than short-lived speculation.

That move aligned with sustained buying pressure, which kept momentum intact despite early signs of exhaustion.

Source: CoinGlass

Can ARB clear its supply zone?

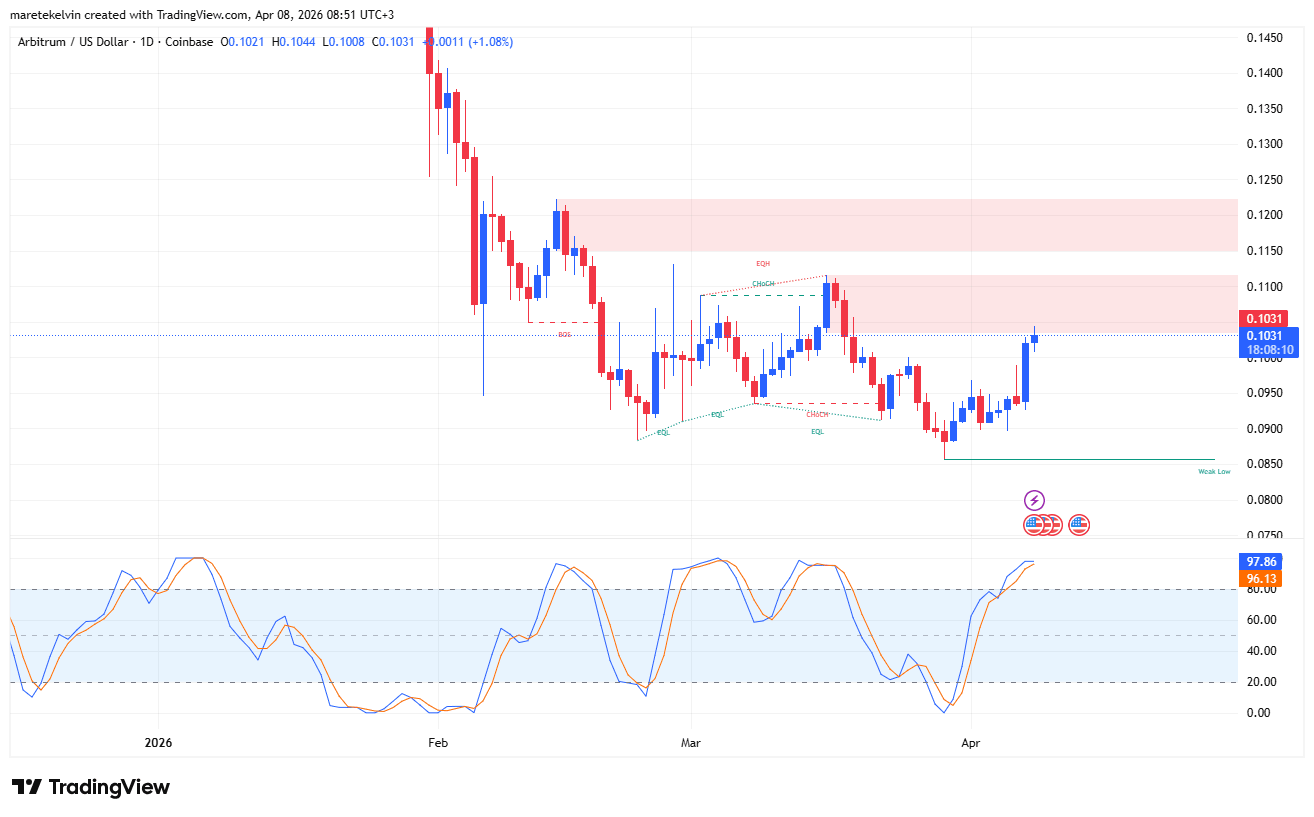
Arbitrum [ARB] tested a key supply zone near $0.1031 on the daily chart. The move followed a strong rally after clearing liquidity clusters during the previous downtrend phase.

Even so, the structure still favored buyers at press time.

However, the Stochastic RSI suggested the rally approached an exhaustion phase. The RSI remained in an oversold region, indicating a potential cooldown.

This left price consolidating near resistance while the market absorbed recent gains.

Source: TradingView

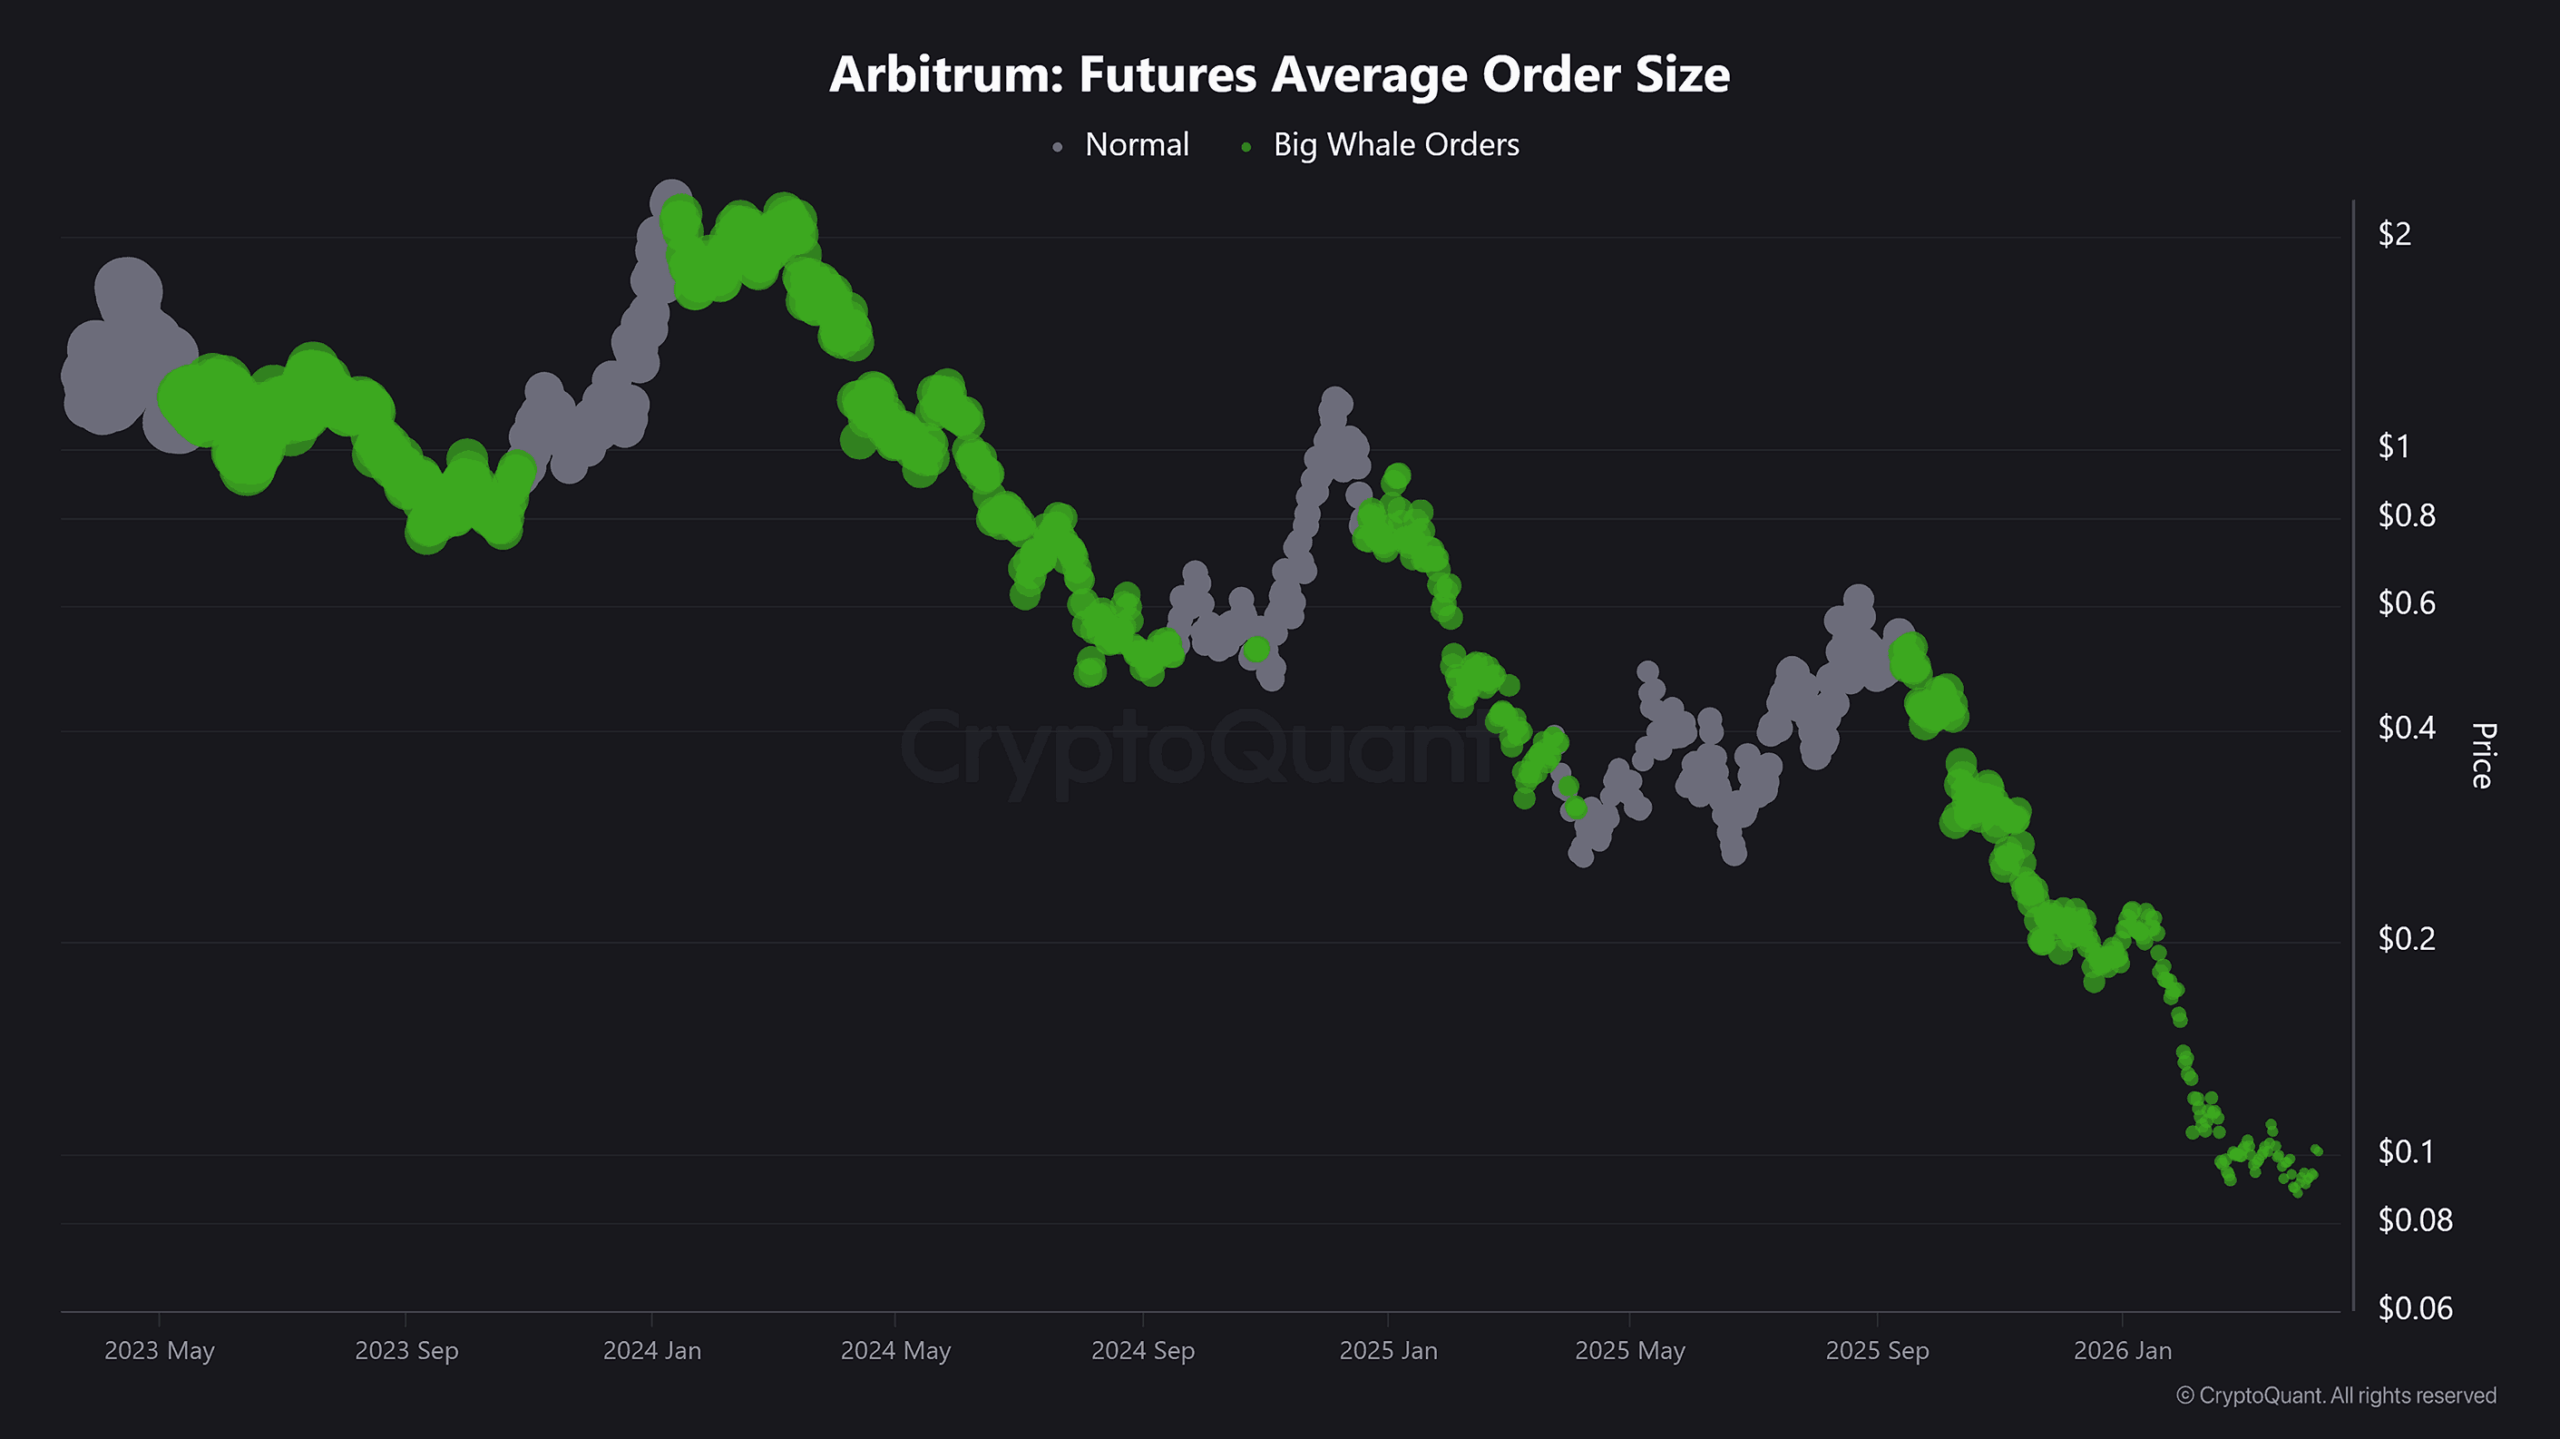
Whale accumulation supports the trend

On-chain data showed continued accumulation by large holders at current levels. This behavior reduced circulating supply and supported the ongoing trend.

Source: CryptoQuant

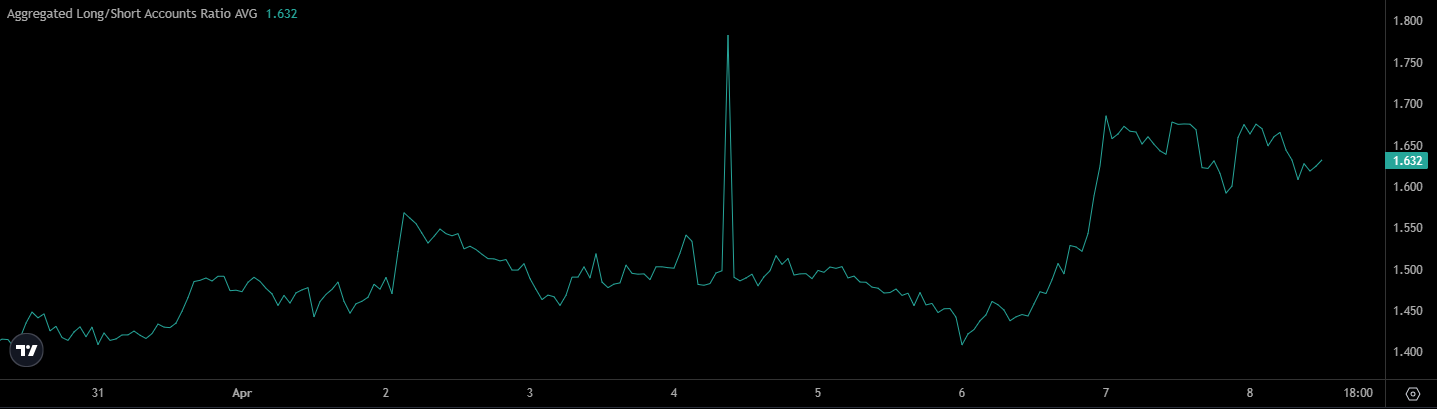
On top of that, derivatives data confirmed bullish positioning. The Long/Short Ratio stood at 1.6, at press time, showing longs outweighed shorts.

That alignment suggested traders leaned toward continuation rather than reversal.

Source: Coinalyze

What is ahead for ARB?

The structure remained constructive as long as buying pressure held. Sustained momentum depended on strong Trading Volume and continued accumulation.

A successful break above the supply zone could open the path toward $1.1. Failure to sustain demand may lead to consolidation before the next move.


Final Summary

  • ARB’s price rise is backed by strong volume growth, showing real market participation rather than a weak bounce.
  • The token is now testing a key supply zone, which will decide whether the rally continues or stalls.

Связанные с этим вопросы

QWhat was the percentage increase in ARB's price and the approximate trading volume mentioned in the article?

AARB's price rose by 10%, and the trading volume climbed 40%, crossing $100 million.

QAccording to the technical analysis, what does the Stochastic RSI signal for ARB near its current price level?

AThe Stochastic RSI signaled caution and suggested that the rally was approaching an exhaustion phase.

QWhat key supply zone is ARB testing on the daily chart, and what could a successful break above it lead to?

AARB is testing a key supply zone near $0.1031. A successful break above it could open the path toward $1.1.

QHow did on-chain data and whale activity contribute to supporting the ongoing trend for ARB?

AOn-chain data showed continued accumulation by large holders (whales) at current levels, which reduced circulating supply and supported the ongoing trend.

QWhat does the Long/Short Ratio of 1.6 indicate about trader positioning in the ARB market?

AA Long/Short Ratio of 1.6 indicates that long positions outweigh short positions, showing that traders are leaning toward a continuation of the trend rather than a reversal.

Похожее

An Open-Source AI Tool That No One Saw Predicted Kelp DAO's $292 Million Vulnerability 12 Days Ago

An open-source AI security tool flagged critical risks in Kelp DAO’s cross-chain architecture 12 days before a $292 million exploit on April 18, 2026—the largest DeFi incident of the year. The vulnerability was not in the smart contracts but in the configuration of LayerZero’s cross-chain bridge: a 1-of-1 Decentralized Verifier Network (DVN) setup allowed an attacker to forge cross-chain messages with a single compromised node. The tool, which performs AI-assisted architectural risk assessments using public data, identified several unremediated risks, including opaque DVN configuration, single-point-of-failure across 16 chains, unverified cross-chain governance controls, and similarities to historical bridge attacks like Ronin and Harmony. It also noted the absence of an insurance pool, which amplified losses as Aave and other protocols absorbed nearly $300M in bad debt. The attack unfolded over 46 minutes: the attacker minted 116,500 rsETH on Ethereum via a fraudulent message, used it as collateral to borrow WETH on lending platforms, and laundered funds through Tornado Cash. While an emergency pause prevented two subsequent attacks worth ~$200M, the damage was severe. The tool’s report, committed to GitHub on April 6, scored Kelp DAO a medium-risk 72/100—later acknowledged as too lenient. It failed to query on-chain DVN configurations or initiate private disclosure, highlighting gaps in current DeFi security approaches that focus on code audits but miss config-level and governance risks. The incident underscores the need for independent, AI-powered risk assessment tools that evaluate protocol architecture, not just code.

marsbit2 ч. назад

An Open-Source AI Tool That No One Saw Predicted Kelp DAO's $292 Million Vulnerability 12 Days Ago

marsbit2 ч. назад

Торговля

Спот
Фьючерсы
活动图片