Оригинальное название: The Bond Market Isn't Buying This Rally. Neither Am I.
Автор оригинала: KURT S. ALTRICHTER, CRPS
Компиляция оригинала: Peggy, BlockBeats
Примечание редактора: В то время как фондовый рынок быстро отыграл военные потери и приближается к историческим максимумам, нарратив о том, что «риски устранены», вновь становится доминирующим. Но эта статья напоминает нам, что если смотреть только на рынок акций, легко ошибиться в оценке реальной ситуации.
Сигналы от облигаций и нефти не совпадают: рост ставок и высокие цены на нефть указывают на сохраняющуюся инфляцию, ограниченное пространство для манёвров ФРС и то, что геополитический конфликт еще не разрешился. Для сравнения, фондовый рынок одновременно закладывает в цены низкую инфляцию, возобновление снижения ставок, контролируемые издержки и ослабление конфликта — это набор весьма идеалистичных предпосылок.
Автор полагает, что этот ралли в большей степени обусловлен моментумом, а не фундаментальными факторами. Под давлением торгового поведения, движимого страхом упустить выгоду (FOMO), цены могут кратковременно отклоняться от реальности, но в конечном итоге они должны вернуться в диапазон, определяемый макропеременными.
Когда между разными классами активов возникает расхождение, реальный риск заключается не в том, кто прав, а кто нет, а в том, как это расхождение будет устранено. Вопрос сейчас не в том, оптимистичен ли рынок, а в том, не забежал ли этот оптимизм вперед данных.
Далее оригинал:
«Правило №2: Чрезмерные колебания в одном направлении часто вызывают чрезмерный разворот в противоположном направлении». — Боб Фаррелл (Bob Farrell)
Индекс S&P 500 полностью отыграл все потери, понесенные во время конфликта с Ираном. По состоянию на вчерашний день индекс был на 1% выше, чем 27 февраля (за день до первых ударов по Ирану), и находится всего в шаге от нового исторического максимума (менее 1%).
Всего за 10 торговых дней рынок совершил полный круг.
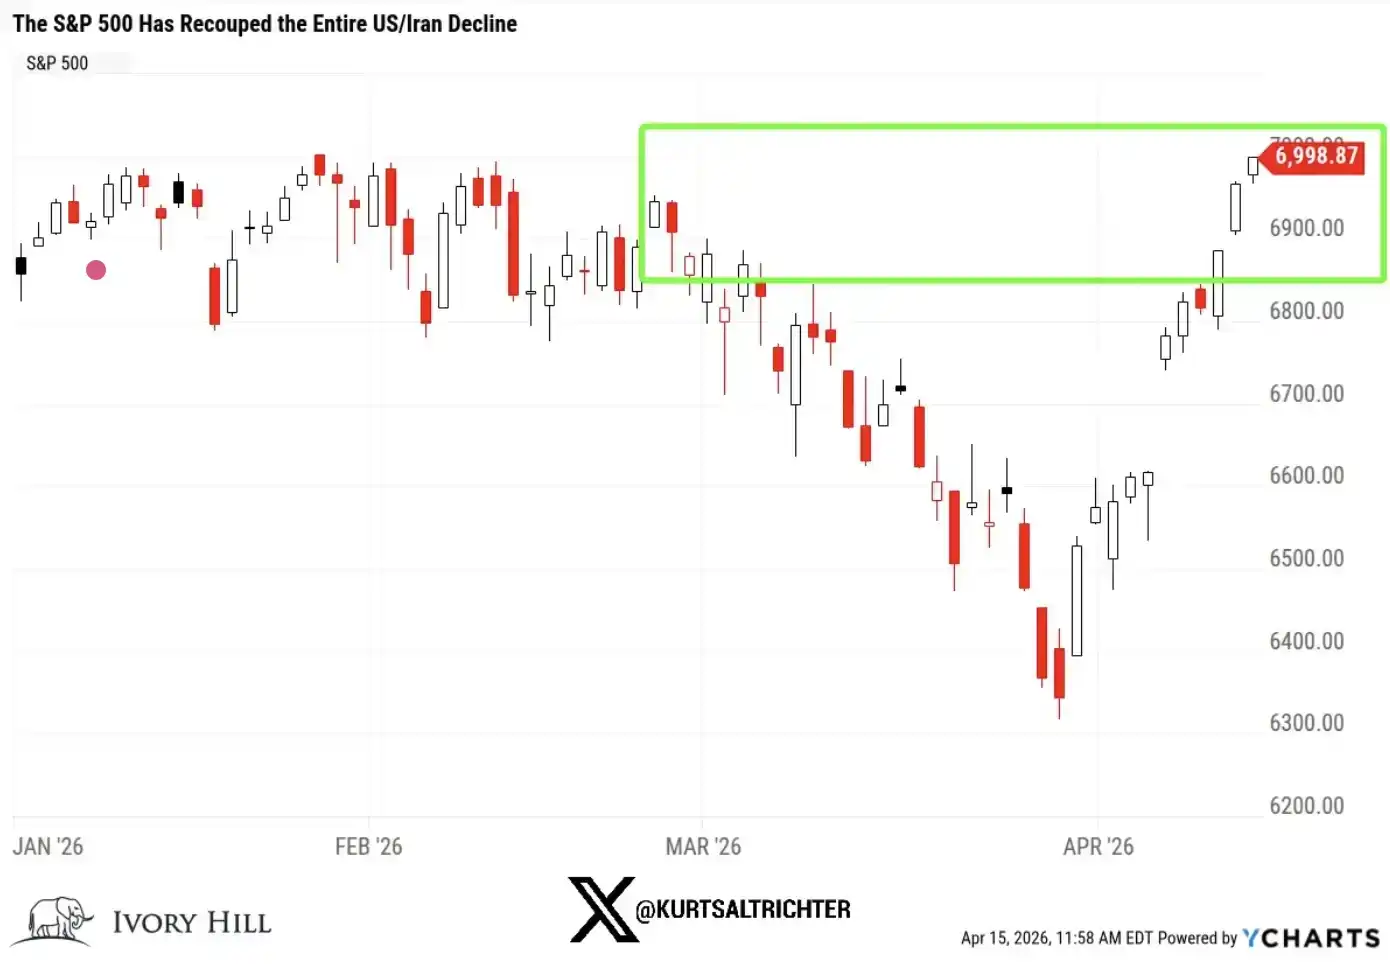
Скажу прямо: если сейчас смотреть только на фондовый рынок, все выглядит так, будто «здоровье восстановилось». Война началась, рынок упал, затем быстро отскочил, все вернулось в норму, и все движутся дальше.
Но если расширить кругозор, это не то, что происходит на самом деле.
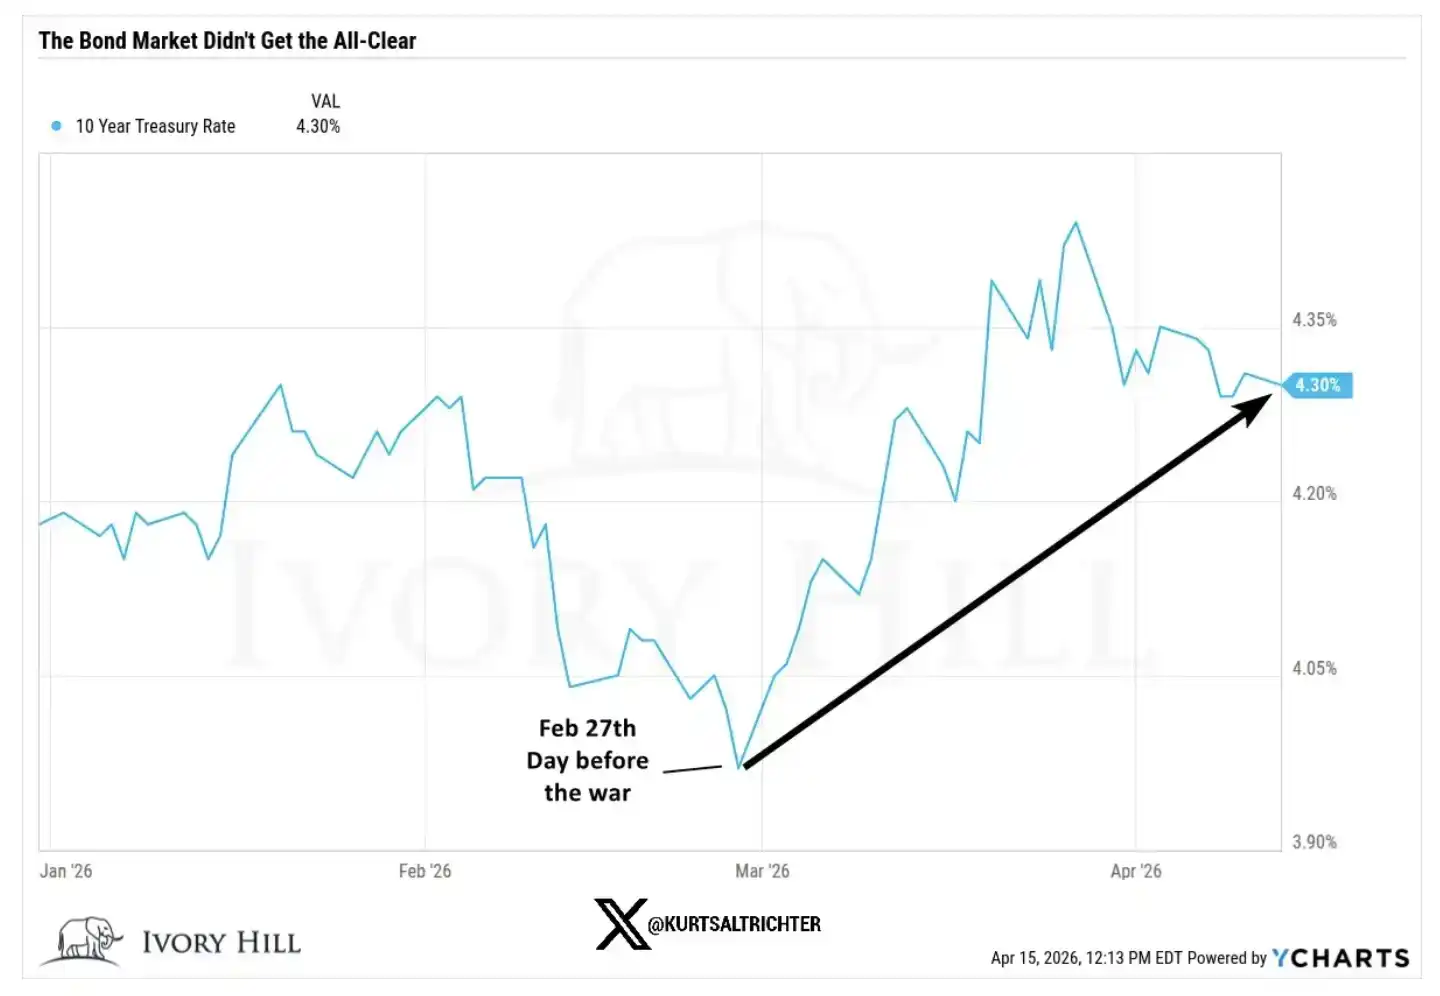
Рынок облигаций не подтверждает этот рост.
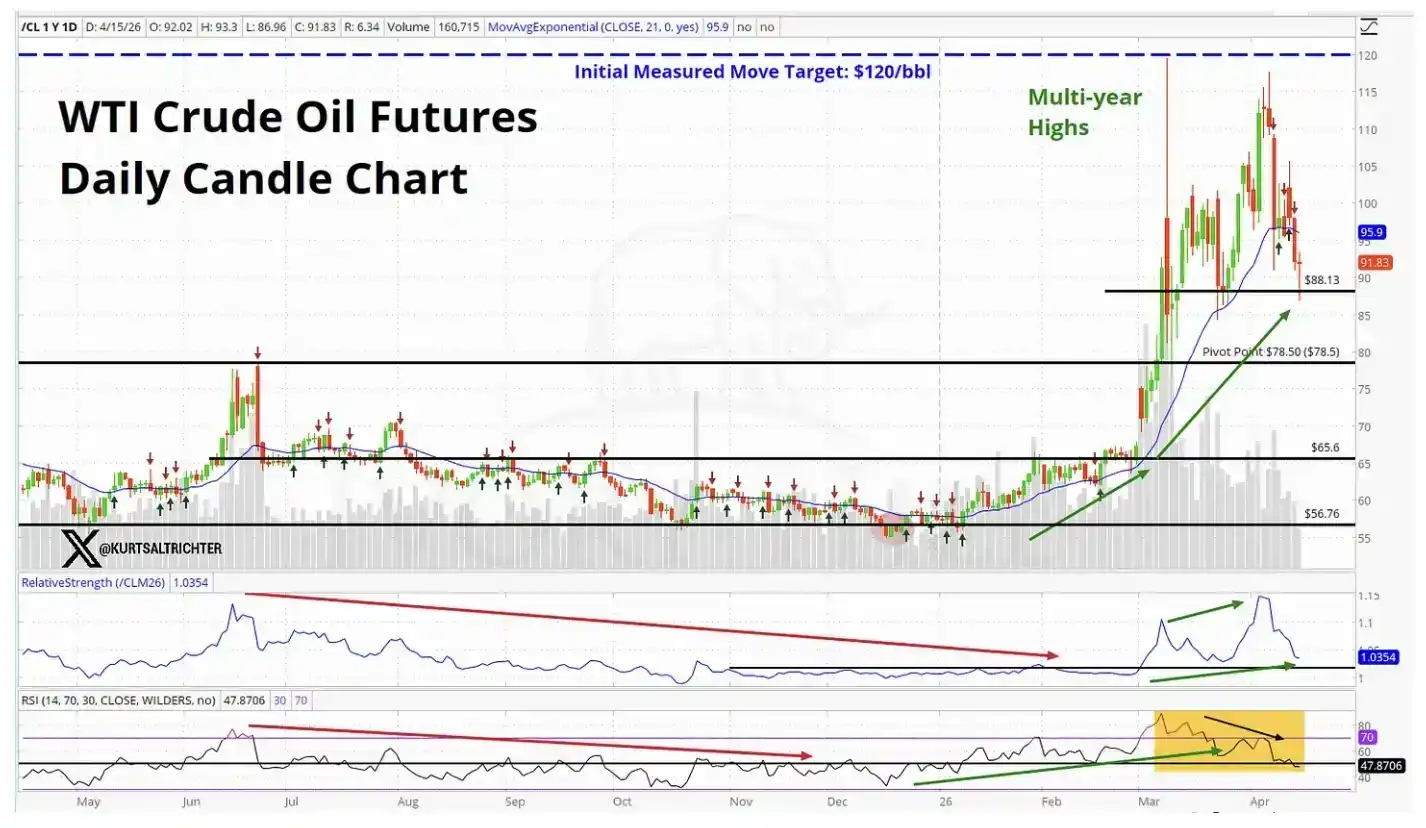
Нефтяной рынок тоже не подтверждает этот рост.
Когда два важнейших рынка мира рассказывают историю, отличную от фондового рынка, это сигнал, который никак нельзя игнорировать.
Итак, что же в настоящее время закладывается в цены на акции?
Чтобы S&P 500 оказался выше довоенного уровня, рынок фактически должен одновременно верить в несколько вещей:
Текущие цены на нефть еще недостаточно высоки, чтобы существенно подавить потребление
ФРС проигнорирует перегретые данные по инфляции и все равно начнет снижать ставки
Более высокие затраты на сырье и транспортировку не будут разъедать прибыль компаний
Ближневосточный конфликт в течение полугода будет достаточно близок к разрешению и перестанет представлять риск
Может быть, так и произойдет. Я не говорю, что это невозможно. Но это довольно агрессивный набор предпосылок, и текущие данные, которые释放ляют рынки облигаций и нефти, не поддерживают эти假设.
С фундаментальных позиций ценообразование на фондовом рынке приближается к «идеальным ожиданиям».
Давайте посмотрим на более конкретные данные
27 февраля, накануне эскалации конфликта, закрытие ключевых показателей было следующим:
Доходность 10-летних казначейских облигаций США: 3.95%, а вчера закрылась на уровне 4.25%, что на 30 базисных пунктов выше, чем до войны
Нефть марки WTI: 67.02 доллара, текущая цена примерно на 37% выше, чем тогда
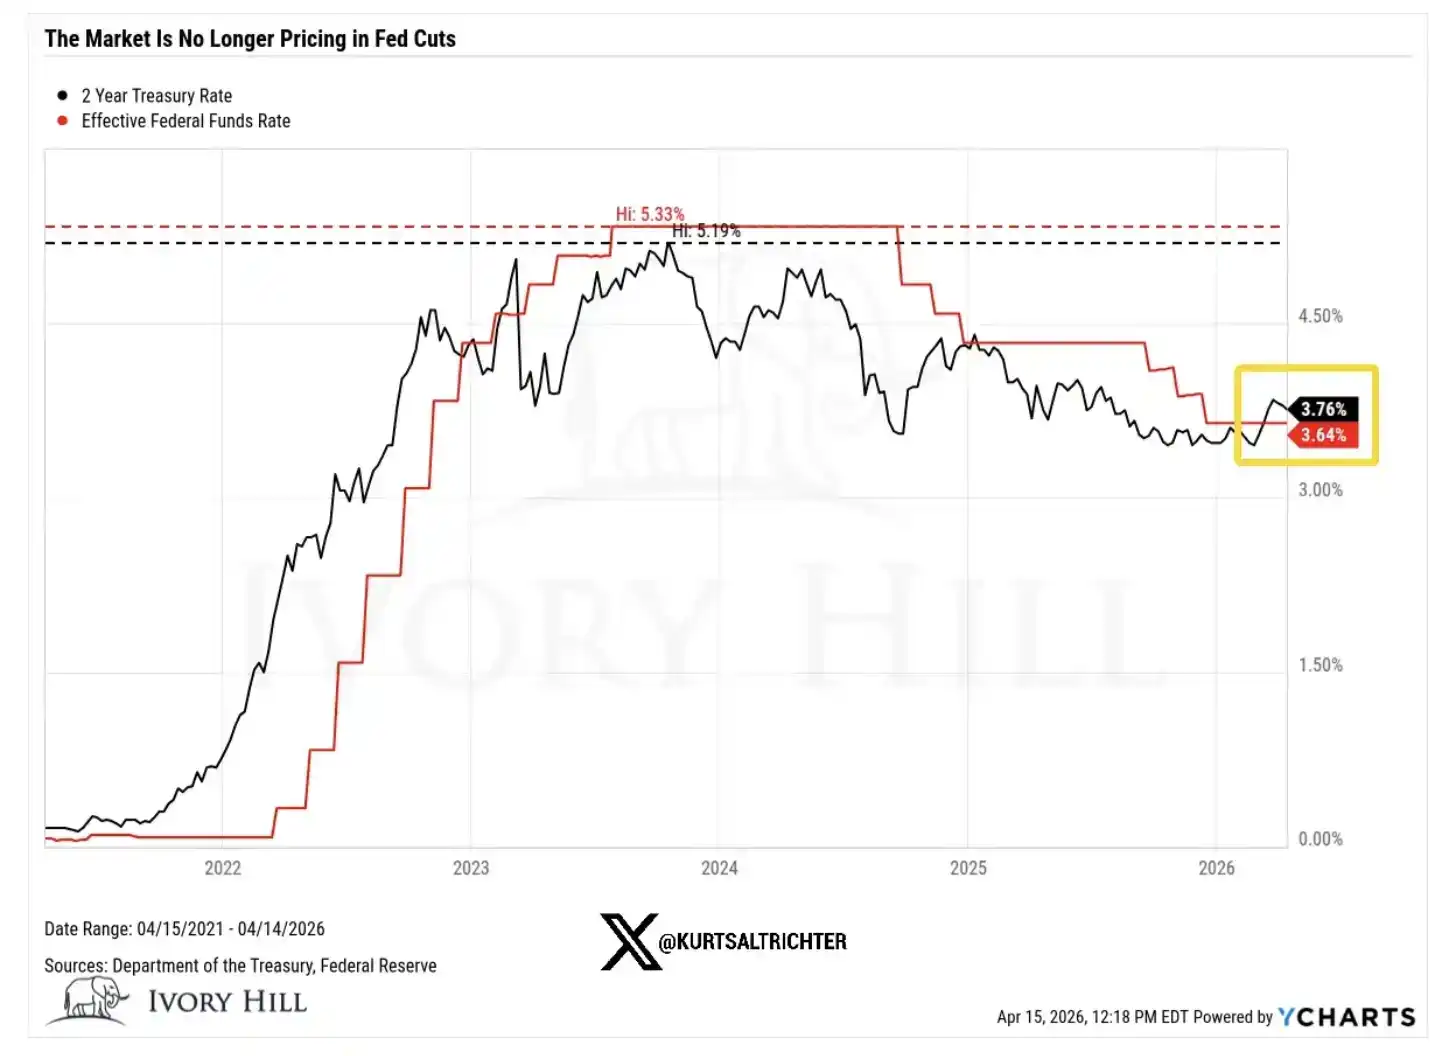
Доходность 2-летних казначейских облигаций США: 3.38%, вчера закрылась на уровне 3.75%, что почти на 40 базисных пунктов выше, чем до войны
Теперь давайте разберем значение этих изменений.
Рост доходности 10-летних облигаций на 30 б.п. после начала войны произошел не потому, что рынок облигаций стал более оптимистично настроен к экономическому росту. Текущие настроения потребителей ослабевают, уверенность остается вялой. Этот рост ставок, по сути, является «тихим» закладыванием инфляции в цены на рынке облигаций.
Он传递ляет четкий сигнал: более высокие цены на нефть传导ляются в общую систему цен, и будущее пространство для политики ФРС может быть не таким宽松льным, как предполагает фондовый рынок.
Рост цен на нефть на 37% за 6 недель — это не то, что должно происходить, если рынок действительно верит в скорое достижение настоящего, прочного соглашения между США и Ираном.
Если бы трейдеры действительно были уверены в стабильном соглашении о прекращении огня, цены на нефть уже давно упали бы к уровню 70 долларов и продолжили снижение. Но реальность иная. Цены на нефть по-прежнему остаются высокими, что означает, что нефтяной рынок не закладывает в цены те же ожидания «скорого разрешения конфликта», что и фондовый рынок.
А доходность 2-летних облигаций все еще на 40 б.п. выше, чем до войны, что само по себе является прямым вызовом нарративу «ФРС скоро снизит ставки».
Доходность 2-летних облигаций — это наш самый чувствительный индикатор для ожиданий по ставкам, он отражает путь политики ФРС более прямо, чем любой другой актив. И сейчас он传递ляет сигнал: пространство для манёвра ФРС меньше, чем представляет себе рынок. Это влияет почти на всю логику оценки, поддерживающую текущий рост на фондовом рынке.
Так кто же прав?
Возможно, прав фондовый рынок, я готов это признать. Если действительно появится существенное соглашение о прекращении огня, доходность облигаций может быстро снизиться; как только проблемы с поставками будут достоверно решены, цены на нефть также могут значительно упасть. Это не первый раз, когда фондовый рынок идет первым, а другие рынки потом «догоняют».
Но есть и другое объяснение, которое, на мой взгляд, в настоящее время недооценивается.
Значительная часть этого роста обусловлена не фундаментальными факторами, а моментумом. Нежелание трейдеров открывать short-позиции (ставить на понижение) в восходящем тренде само по себе продолжает подталкивать рынок вверх. Такие покупки действительно могут поддерживать движение дольше, чем следовало бы.
Но они не меняют базовую логику.
А базовая реальность такова: цены на нефть по-прежнему высоки, ставки продолжают расти, а пространство для снижения ставок ФРС более ограничено, чем нужно быкам.
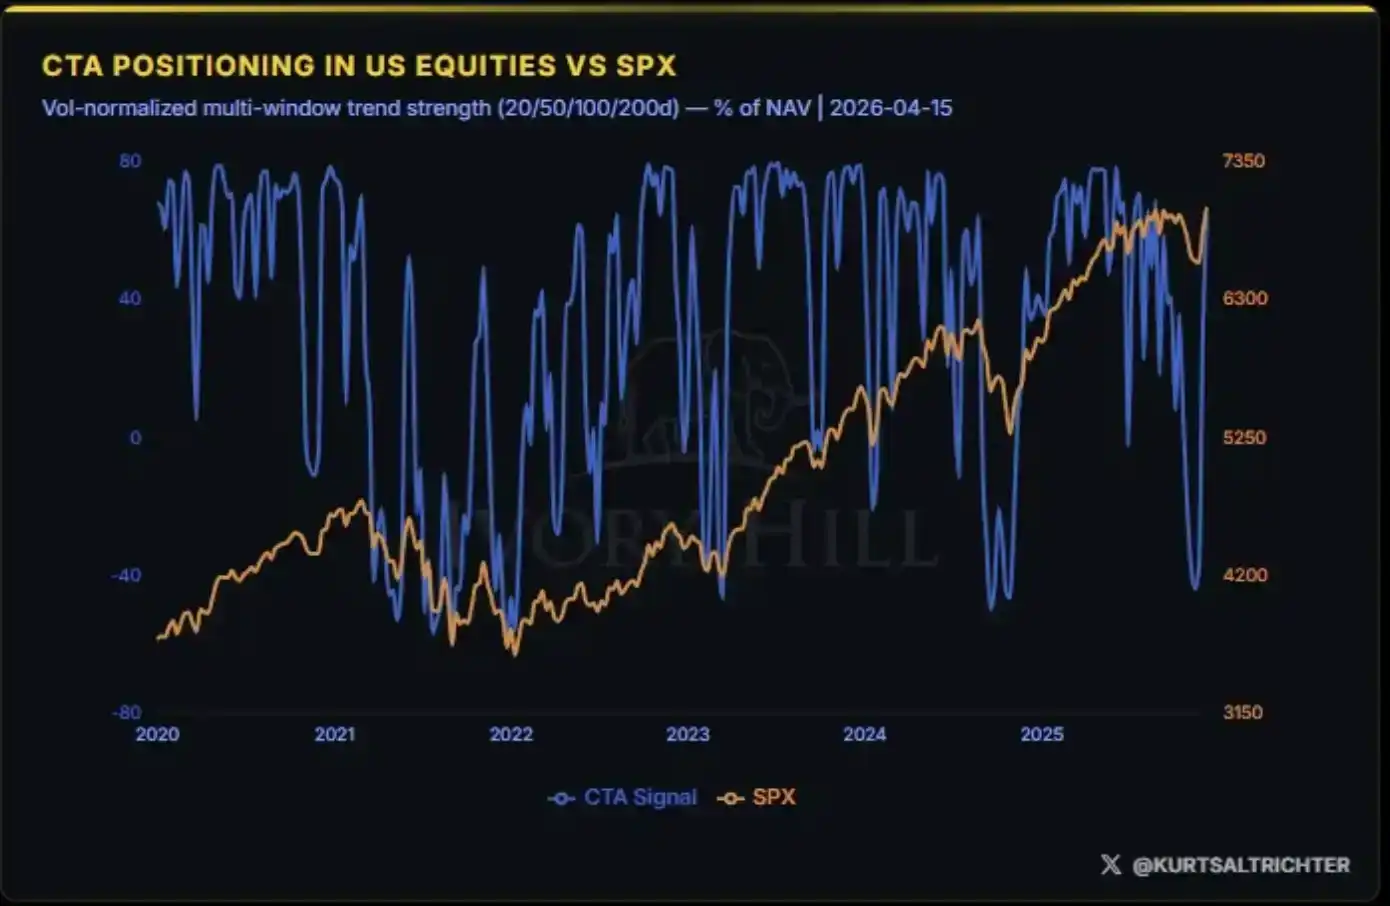
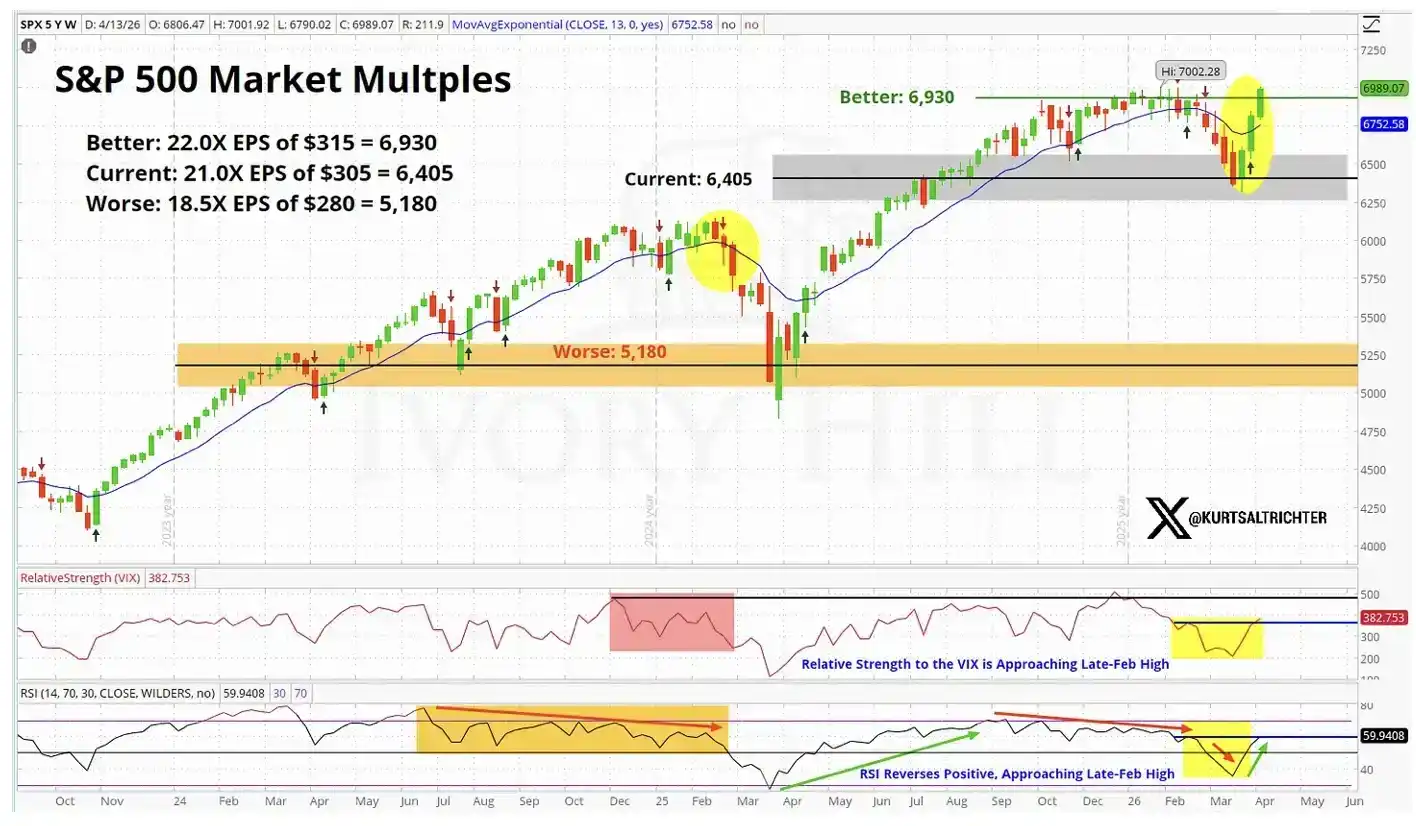
Рост, движимый фундаментальными факторами,往往更具 устойчивостью; а рост, движимый моментумом,通常更 хрупок и кратковременен. Когда вы рассматриваете возможность добавления к позиции near исторических максимумов, эта разница尤为关键. Как показывает график рыночной оценки выше, текущий фондовый рынок уже закладывает в цены «идеальный сценарий».
Моя фактическая оценка
За последние 10 дней ситуация действительно улучшилась, я не стану это отрицать. Я также не тот, кто безосновательно настроен по-медвежьи.
Но разрыв между ценообразованием на фондовом рынке и реальностью, отражаемой облигациями и нефтью, по-прежнему очевиден, и этот разрыв не уменьшается. Я внимательно за этим слежу.
В настоящее время фондовый рынок находится на самом оптимистичном краю диапазона; а облигации и нефть ближе к середине, отражая мир, где инфляция все еще присутствует, пространство для политики ФРС ограничено, и конфликт еще не truly решен.
Это расхождение в конечном итоге будет устранено, и есть только два пути:
Либо будет достигнуто настоящее соглашение о прекращении огня, цены на нефть упадут до уровня около 70 долларов, ФРС получит четкое пространство для снижения ставок, и в конечном итоге окажется, что фондовый рынок был прав;
Либо ничего из этого не произойдет, и фондовый рынок откатится вниз, приблизившись к уровню, который в настоящее время отражают облигации и нефть.
А на данный момент облигации и нефть не проявляют признаков движения towards фондовому рынку, скорее, это фондовому рынку нужно снизиться, чтобы «выровняться» с ними.
Следующие данные по инфляции будут опубликованы 12 мая. Если моя оценка верна, и CPI превысит 3.5%, то нарратив о снижении ставок в 2026 году基本上 будет объявлен оконченным.
Если вы на этих уровнях продолжаете добавлять к позициям, по сути, вы делаете ставку на то, что все пойдет по самому идеальному сценарию: война благополучно закончится, без вмешательства «внезапных заявлений Трампа»; инфляция останется под контролем; ФРС снизит ставки по плану; прибыль компаний стабилизируется. Все эти четыре вещи должны произойти одновременно. Если любая из них明显 отклоняется, процесс корректировки этого рынка вниз, скорее всего, будет быстрым и резким.
В相比之下, я предпочитаю сохранять терпение, а не гнаться за ростом, который «тихо отрицается» двумя ключевыми классами активов. Если долгосрочные сигналы будут указывать на покупку, мы, естественно, будем постепенно наращивать позиции в соответствии со стратегией.
И не забывайте — единственное, что можно утверждать наверняка, это то, что все меняется.
Ссылка на оригинал


