Автор статьи:a16z crypto
Компиляция | Odaily Planet Daily (@OdailyChina); Переводчик | Moni
Токенизированные активы (Tokenized Assets), или, как их часто называют, «активы реального мира (RWA)», меняют форму активов, способ их перемещения и то, как строится финансовая система.
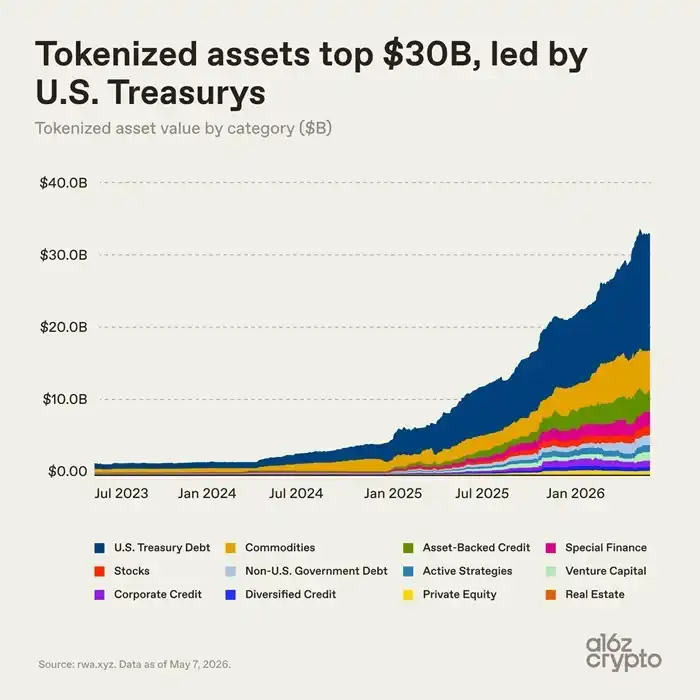
Только в прошлом месяце рынок токенизированных активов превысил 30 миллиардов долларов США и в настоящее время стабилизировался на уровне около 34 миллиардов долларов США (без учета стейблкоинов). Этот объем примерно эквивалентен региональному банку или крупнейшему университетскому эндаументу. Хотя по сравнению с глобальной финансовой системой он все еще очень мал, он уже достаточен, чтобы оказывать реальное влияние.
Всего два года назад рынок токенизированных активов составлял менее 3 миллиардов долларов США, но затем рынок кардинально изменился: закон GENIUS в США предоставил более четкие рамки регулирования стейблкоинов, институциональная ончейн-инфраструктура созрела, и большое количество финансовых учреждений почти одновременно начали внедрять технологию блокчейна — именно под влиянием этих факторов рынок токенизированных активов вырос в 10 раз менее чем за два года. (Примечание: хотя стейблкоины не учитываются в приведенной выше статистике, они, значительно упрощая платежи и расчеты в ончейн, фактически способствовали росту всего рынка.)
В этой статье с помощью 7 графиков мы проанализируем причины роста токенизированных активов и их будущее направление.
Взлет токенизированных активов: Казначейские облигации США стали главным двигателем роста
Казначейские облигации США — главный драйвер недавнего роста рынка токенизированных активов.
Преимущества токенизированных казначейских облигаций США ясны и интуитивно понятны: инвесторы могут владеть стабильными доходными активами в цифровой форме, а торговля и передача становятся более эффективными и гибкими; финансовые учреждения могут повысить эффективность расчетов, управления залоговыми активами и плавно интегрироваться с цифровыми финансовыми рынками.
Криптоинвесторы также могут использовать токенизированные казначейские облигации для монетизации неиспользуемых стейблкоинов, получая доход от традиционных денежных рынков. Такие управляющие компании, как BlackRock и Franklin Templeton, воспользовались этой возможностью, создав рынок объемом в сотни миллиардов долларов.
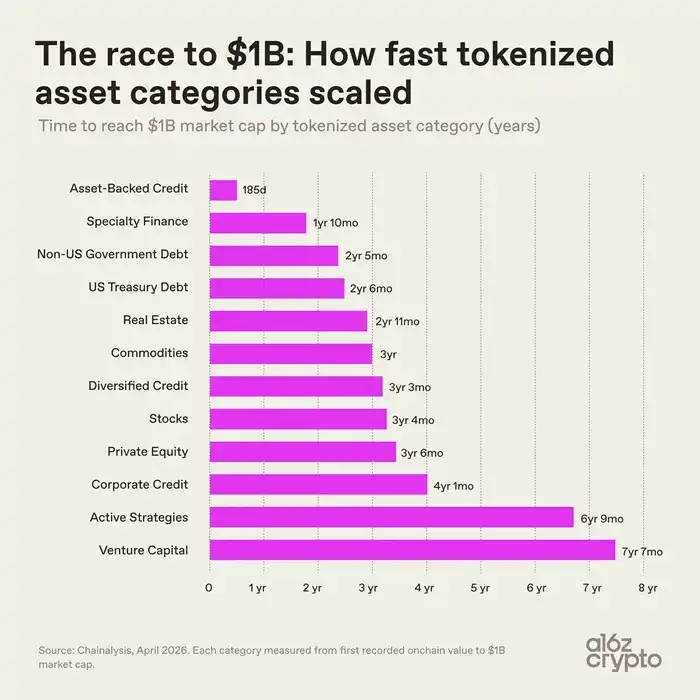
Важно отметить, что темпы роста различных токенизированных активов сильно различаются, что обусловлено как техническими и нормативными сложностями вывода различных активов в сеть, так и степенью принятия рынком после запуска продукта.
- Активы, обеспеченные активами, и кредитные активы демонстрируют опережающий рост. К таким токенизированным активам в основном относятся токены кредитных линий под залог недвижимости, токены кредитных хранилищ, за ними следуют такие специализированные финансовые активы, как перестраховочные контракты и векселя для майнинга биткойнов, рыночная стоимость которых достигла 1 миллиарда долларов США за два года.
- Венчурным активам потребовалось более семи лет, чтобы преодолеть порог в 10 миллиардов долларов США, активы активных стратегий — аналогичный период. Эти активы имеют сложную структуру, длительный инвестиционный цикл и более высокие операционные и регуляторные барьеры.
- Казначейские облигации и товары попали в сеть в умеренном темпе, достигнув рыночной капитализации в 10 миллиардов долларов США за 2-3 года и став сегодня основными категориями рынка.
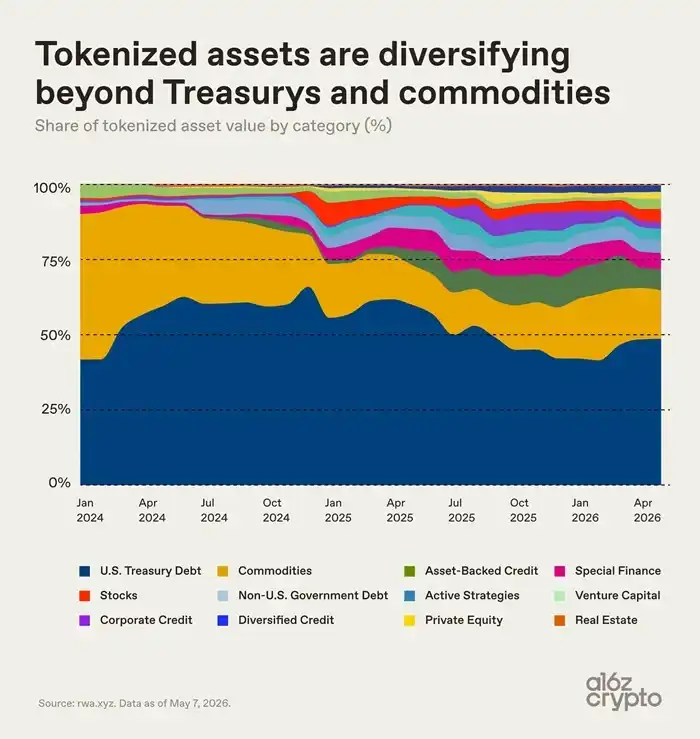
В начале 2024 года казначейские облигации и товары занимали почти весь рынок токенизированных активов. После 2024 года доля кредитов, специализированных финансовых продуктов, акций и других категорий постепенно увеличивалась, но концентрация на рынке по-прежнему высока. В настоящее время токенизированные казначейские облигации США и товары вместе занимают около двух третей рынка.
Сегментированная структура рынка токенизированных активов
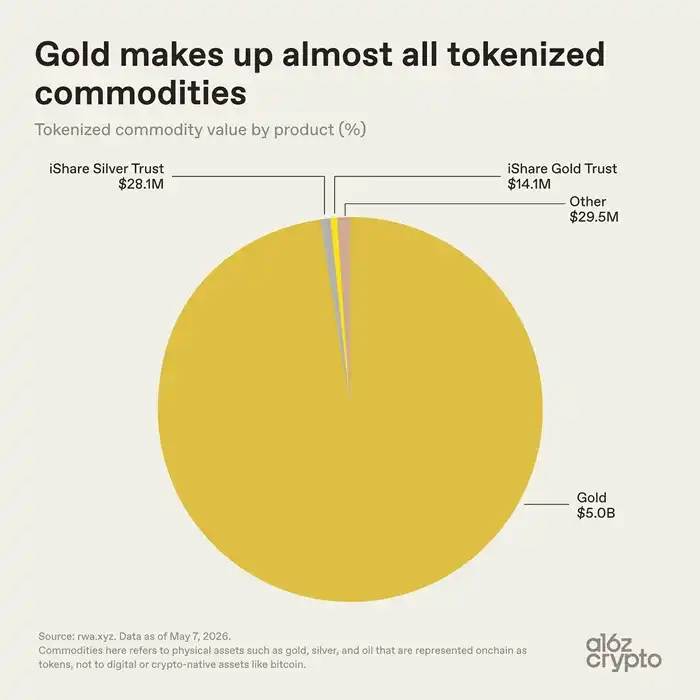
Внутри сегмента токенизированных товарных активов наблюдается высокая концентрация: токены на золото занимают подавляющую долю рынка с общим объемом около 5,1 миллиарда долларов США, при этом объем токенов на золото составляет 5 миллиардов долларов США. Токены на серебро и другие категории составляют всего 57,6 миллиона долларов США, что составляет менее 0,01%.
Золото естественным образом подходит для модели токенизированных активов. В настоящее время рынок токенизированных товаров в основном определяется золотом, потому что: золото имеет глобальный стандарт, его удобно хранить, оно не портится, и само по себе долгое время торгуется через сертификаты прав собственности.
Более того, инвесторы на крипторынке традиционно отдают предпочтение золоту; биткойн в ранние годы называли цифровым золотом. Такие продукты, как золотой токен Tether XAUT и золотой токен Paxos PAXG, отображают право собственности на золото в хранилище в блокчейне, преобразуя права на физическое золото в цифровые токены, которые можно хранить в ончейн-кошельке.
Доля рынка токенизированных активов на сырую нефть, сельскохозяйственную продукцию, а также на новые категории, такие как энергия и вычислительные мощности, крайне мала, отрасль все еще находится в зачаточном состоянии.
С точки зрения распределения по базовым блокчейнам, экосистема токенизированных активов более разнообразна. Благодаря первопроходческому преимуществу в области децентрализованных финансов и базе для институционального внедрения, Ethereum по-прежнему занимает лидирующую позицию с объемом активов в 15,7 миллиарда долларов США и долей рынка более половины.
Остальной рынок токенизированных активов распределен по нескольким блокчейнам: BNB Chain — около 4 миллиардов долларов США, Solana — около 2,2 миллиарда долларов США, Stellar — около 1,7 миллиарда долларов США, биткойн-сайдчейн Liquid Network — около 1,5 миллиарда долларов США, XRP Ledger, ZKsync Era и Arbitrum имеют объем токенизированных активов, близкий к 1 миллиарду долларов США каждый.
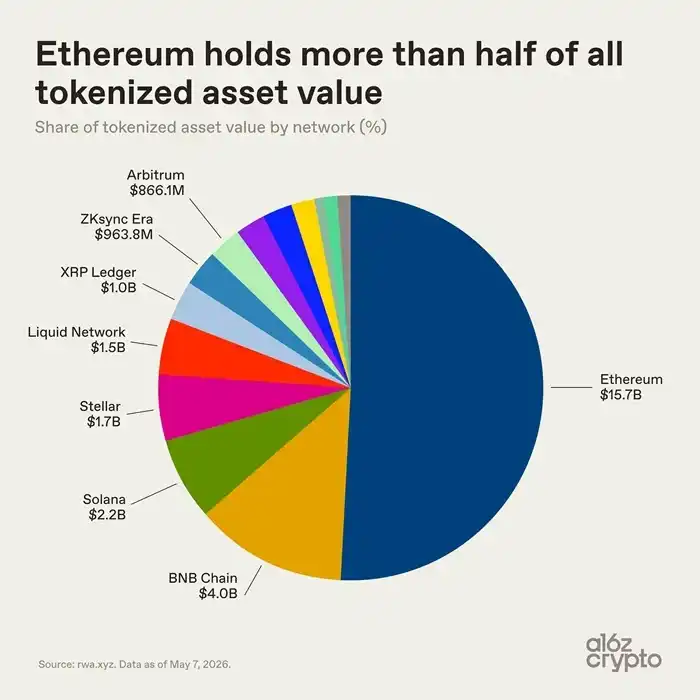
Индустрия токенизированных активов не консолидирована в одном блокчейне; активы распределены по различным блокчейн-экосистемам в зависимости от стоимости транзакций, ликвидности, регуляторных требований и деловых партнерских отношений. Однако наиболее показательная точка данных — не размер рынка токенизированных активов... а то, как эти активы используются.
Продолжим анализ —
Большинство токенизированных активов пока не являются «композируемыми»
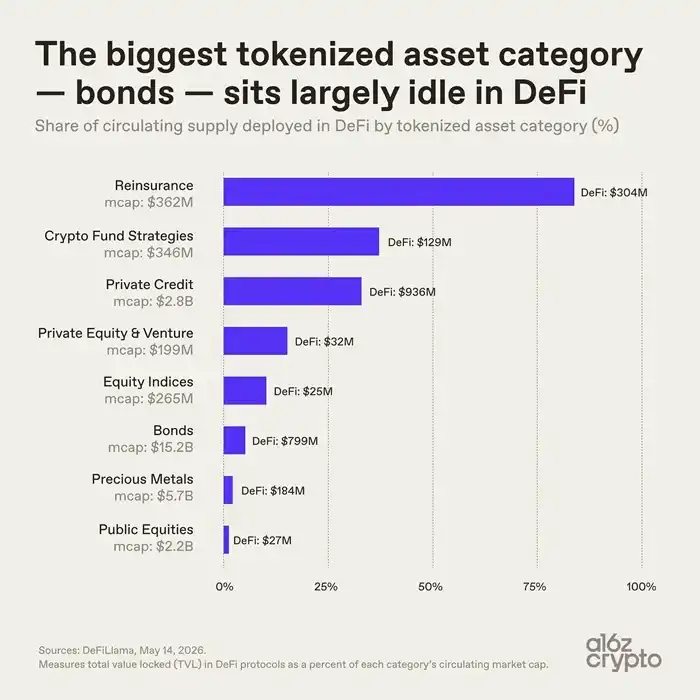
Размер рынка — не единственный ключевой показатель; реальная ценность использования активов более показательна.
Облигации — самая крупная по объему категория токенизированных активов с рыночной капитализацией в 15,2 миллиарда долларов США, но только 5% от этого объема в обращении используется в протоколах DeFi, что составляет всего около 800 миллионов долларов США. Уровень использования токенизированных драгоценных металлов также низок; большинство токенизированных активов используются только для хранения в сети и еще не стали свободно комбинируемыми, взаимосвязанными и повторно используемыми финансовыми строительными блоками.
Небольшие категории токенизированных активов показывают совершенно противоположную картину: токены перестрахования стоимостью 362 миллиона долларов США имеют уровень использования в ончейн-протоколах 84%; частные кредитные токены — 33%; эти два типа активов изначально были разработаны для сценариев композируемого использования в сети. В то же время такие ведущие токенизированные активы, как казначейские облигации и золото, в первую очередь предназначены для упрощения владения и передачи активов в сети, не меняя их исходную операционную логику. Эта ситуация также подчеркивает ключевое различие в индустрии токенизированных активов: уровень нативной интеграции в сеть различных токенизированных активов неодинаков.
Некоторые активы могут свободно перемещаться и использоваться в разных сетях, в то время как другие используют блокчейн только как инструмент учета, что ограничивает возможности передачи и комбинирования активов. В настоящее время большинство токенизированных активов по сути являются лишь цифровыми версиями активов, которые лишь переносят учет в сеть, не раскрывая потенциал для их комбинирования. А композируемость — это основная ценность ончейн-финансов и ключ к модернизации финансовой системы.
Индекс нативных токенов Pantera Capital показывает, что уровень нативной интеграции в сеть более 70% токенизированных активов находится на самом низком уровне. Множество токенов являются просто цифровыми сертификатами на оффчейн-физические активы, а фактический контроль над активами по-прежнему осуществляется через оффчейн-реестры и посредников.
В настоящее время индустрия токенизированных активов все еще находится на ранней стадии развития: с одной стороны, это активы, которые лишь формально находятся в сети в виде цифровых записей, с другой — нативные ончейн-активы, глубоко соответствующие свойствам блокчейна.
Техническая инфраструктура для ончейн-композирования уже готова, категории активов постепенно обогащаются, но глубокая интеграция и применение только начинаются.
Будущие тенденции развития токенизированных активов
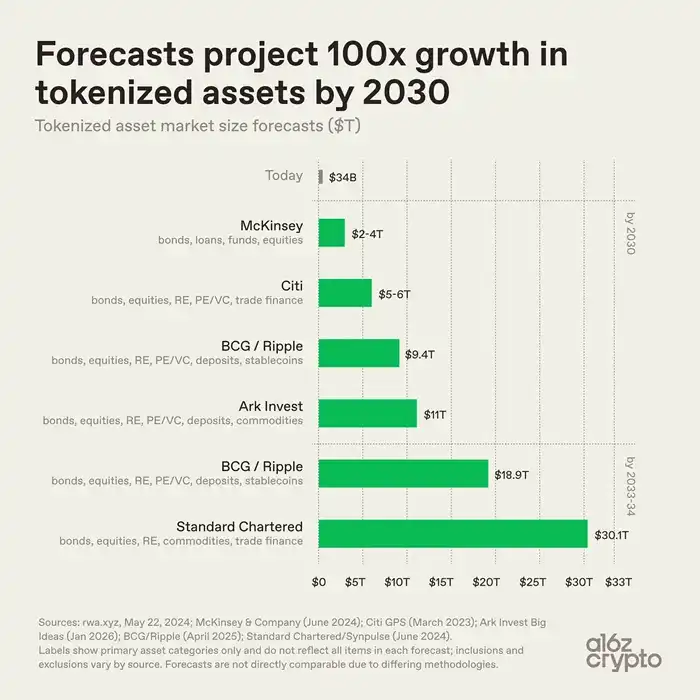
Прогнозы относительно долгосрочного размера индустрии токенизированных активов различаются, но в целом все сходятся во мнении, что рынок будет продолжать расширяться.
- McKinsey прогнозирует, что к 2030 году рынок токенизированных активов достигнет 2–4 триллионов долларов США;
- Ark Invest оценивает рынок токенизированных активов в 11 триллионов долларов США;
- Boston Consulting Group совместно с Ripple подсчитали, что рынок токенизированных активов достигнет 9,4 триллиона долларов США к 2030 году и увеличится до 18,9 триллиона долларов США к 2033 году;
- Standard Chartered прогнозирует, что рынок токенизированных активов превысит 30 триллионов долларов США к 2034 году.
Основываясь на приведенных оценках, по сравнению с текущим объемом рынка в 34 миллиарда долларов США, потенциал долгосрочного роста рынка токенизированных активов может составить сотни раз. Конечно, расхождения в цифрах вызваны не разницей в прогнозах скорости внедрения в отрасли, а разными критериями статистики. Методологии различных организаций различаются, охватывая категории активов, включение стейблкоинов и депозитов, а также определение токенизации. Например: McKinsey фокусируется на облигациях, кредитах, фондах и акциях; Standard Chartered добавляет товары и торговое финансирование; BCG и Ripple дополнительно включают депозиты и стейблкоины. Однако, несмотря на различия в методологиях, отрасль единогласно признает, что объем токенизированных активов резко возрастет.
В глобальном финансовом масштабе текущий объем токенизированных активов все еще ничтожно мал.
- Общий объем глобального рынка облигаций превышает 140 триллионов долларов США, токенизированные облигации составляют всего 15,2 миллиарда долларов США, или 0,01%;
- Рыночная стоимость физического золота в мире составляет несколько триллионов долларов США, токенизированное золото — 5 миллиардов долларов США, или менее 0,02%;
- Глобальная рыночная капитализация акций превышает 100 триллионов долларов США, токенизированные акции — 1,5 миллиарда долларов США, или всего 0,001%.
Сегодня новые направления уже стабильно формируются: казначейские облигации США, золото, частные кредиты и другие активы с четким ценообразованием, стабильным спросом и простыми правами собственности первыми были выведены в сеть. На текущем этапе токенизация еще не изменила фундаментальные свойства активов, она лишь оптимизирует способы расчетов и передачи активов; глубокая интеграция активов с цифровой финансовой системой все еще исследуется.
В настоящее время токенизированные активы в большей степени остаются на уровне цифровизации, активы не могут быть запрограммированы для композируемого применения. Следующий этап для отрасли представляет собой серьезную проблему: вывод в сеть более сложных частей финансовой системы и более глубокая интеграция токенизированных активов в композируемую, нативную для интернета финансовую инфраструктуру.


