Dogecoin вернулся к важному долгосрочному уровню на месячном графике, что стало очередным серьезным испытанием для мем-коина после месяцев слабой ценовой динамики.
Эта ситуация была впервые отмечена криптоаналитиком Trader Tardigrade в X, который утверждал, что DOGE сейчас находится в критической зоне сопротивления, где предыдущие ралли терпели неудачу. Dogecoin посещал эту ценовую зону всего дважды за последнее десятилетие, и каждый визит заканчивался одинаково.
Паттерн, определяющий DOGE с 2015 года
Долгосрочный график Dogecoin от Trader Tardigrade показывает, что DOGE торгуется внутри огромного нисходящего расширяющегося канала, который формировал ценовую динамику годами. Этот канал формирует ценовую динамику Dogecoin уже более десяти лет, с двумя четко определенными красными линиями тренда, которые постепенно расширяются со временем.
Как показано на графике ниже, Dogecoin ранее поднимался к верхнему сопротивлению этого канала в 2017 и 2020 годах, и оба движения заканчивались сильными откатами с последующей глубокой коррекцией. Теперь, в 2026 году, Dogecoin вернулся к той же верхней структуре в третий раз, и похоже, что снова готовится к откату. Как отмечает Trader Tardigrade, это момент, когда мы продаем Dogecoin.
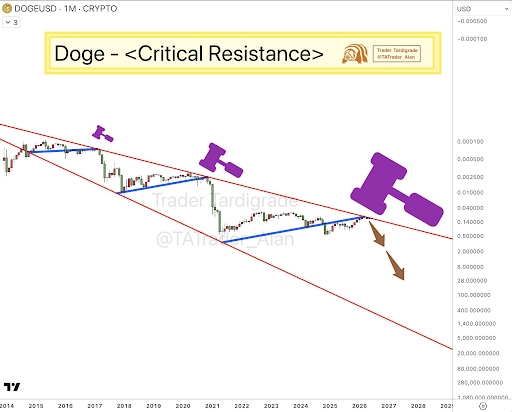
Dogecoin уже упал на 8% за последние три дня, это снижение произошло вскоре после того, как DOGE протестировал эту крупную зону сопротивления, что делает паттерн серьезным предупреждением.
Истинный смысл инвертированного графика
График Trader Tardigrade представляет DOGE/USD на месячном таймфрейме, но ценовая шкала перевернута. Это означает, что чем ниже движется график, тем выше на самом деле движется Dogecoin при обычных рыночных ценах. Следовательно, красная нисходящая линия, обозначенная как критическое сопротивление, — это не медвежий потолок в обычном понимании, а бычья линия на инвертированном графике, и откат от нее отправляет цену в реальном выражении непосредственно в восходящее движение.
В каждом из двух предыдущих случаев, цикле 2017 года и цикле 2021 года, откат от этого инвертированного сопротивления сопровождался сильным движением вниз на инвертированном графике, что означало сильный рост вверх на обычном графике DOGE.
Таким образом, текущую ценовую динамику следует рассматривать скорее как возврат к поддержке, и аналитик ожидает отскока к более высоким ценовым уровням. Dogecoin в настоящее время торгуется на уровне $0,0937, что помещает его прямо в диапазон поддержки между $0,09 и $0,10.
Движение выше $0,10 и в диапазон $0,15–$0,18 станет первым признаком того, что настроения вокруг DOGE начинают улучшаться. Однако более сильный сигнал поступит от прорыва выше $0,25, поскольку это более четко покажет, что DOGE отскакивает от структуры поддержки.
Интересно, что структура инвертированного графика оставляет место для движения к целевым ценам с двузначными числами, прежде чем Dogecoin достигнет следующей крупной линии тренда.