Author: Tide Research

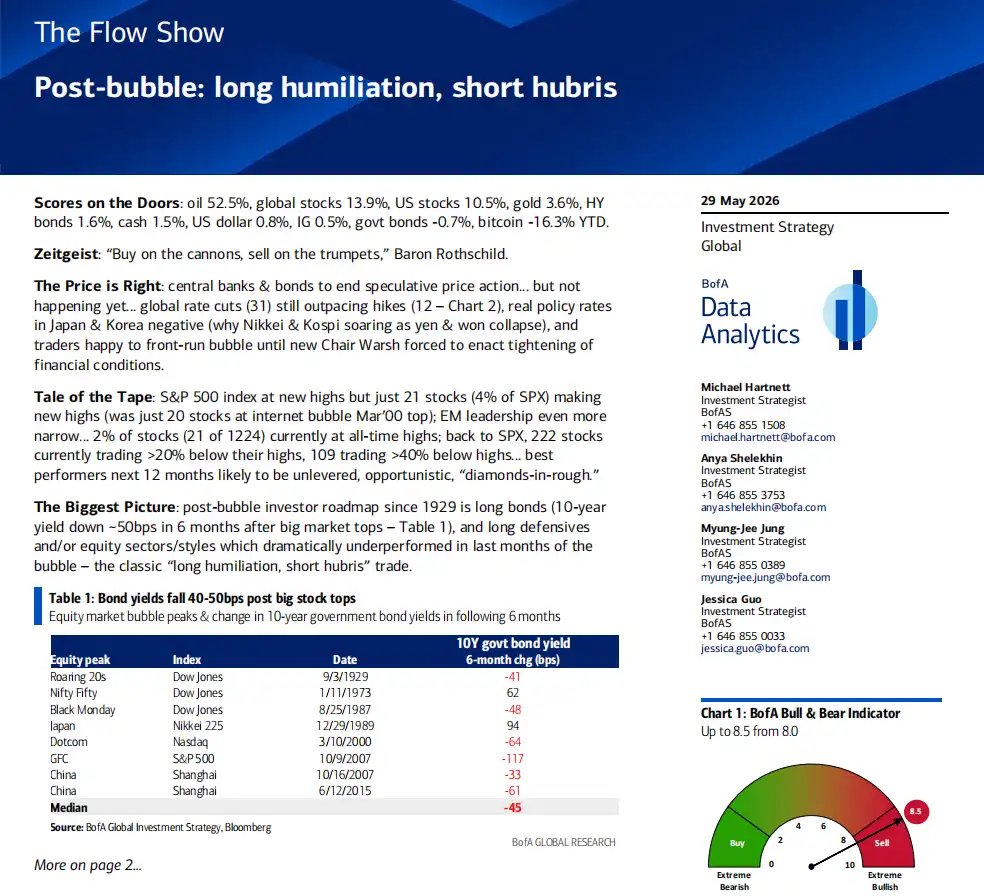
The latest issue of BofA's Flow Show has a title that stings with every word: Post-bubble.
Analyst Hartnett didn't use questions or buffer words like "might" or "perhaps." In his view, the current U.S. stock market is not a "suspected bubble," but has already entered the historical script that follows a bubble's burst. He traced back from 1929 to 2015, digging out the patterns of asset performance after every major bubble peaked, then drew a roadmap for today's market.
He compressed the core trading strategy of this roadmap into one sentence: Long humiliation, short hubris.
A Set of Unsettling Data
First, look at the current "abnormalities."
The S&P 500 index is at an all-time high. This fact itself is not a problem; the problem lies in the number of stocks participating in this party: Only 21 stocks (4%) among all S&P 500 constituents are simultaneously making new highs. 222 stocks are down more than 20% from their respective highs, and 109 are down more than 40%.
Hartnett highlighted a historical comparison for this 4% figure: In March 2000, at the peak of the dot-com bubble, only 20 stocks in the S&P 500 were making new highs. In other words, today's market concentration has returned to the level seen at the peak of the dot-com bubble.
Emerging markets are even more extreme. Among 1,224 EM stocks, only 21 (less than 2%) are at their historical highs.
The index is celebrating, while the vast majority of stocks are silent.
The Historical Script After a Bubble
Hartnett systematically reviewed the market performance after every major bubble peak since 1929, concluding with two main themes.
First: After a bubble bursts, bonds almost always rise. He calculated the change in 10-year Treasury yields within six months after eight major stock market peaks, with a median decline of 45 basis points. The logic is straightforward: A bubble burst reduces risk appetite, capital floods into safe-haven assets, Treasury prices rise, and yields fall. Yields fell in six out of the eight instances, with only 1973 and 1989 being exceptions (influenced by stagflation and Japan's special environment, respectively).
Second: The sectors that suffered most during the bubble perform best after it bursts. Every bubble has its "darlings" and "orphans." After the bubble ends, the roles reverse.
Looking at a few cycles: In the Roaring Twenties of 1929, the bubble's protagonists were utilities, telecommunications, industrials, and banks. After the bubble burst, these sectors underperformed significantly, while the previously neglected energy stocks became winners. During the 2000 dot-com bubble, the Nasdaq doubled in the six months before the peak, while the S&P 500 Equal Weight Index actually fell in the final 12 months of the bubble; after the bubble burst, the Nasdaq fell 60% within a year, while the humiliated defensive sectors rebounded strongly (utilities up 25%, consumer staples up 24%), and the equal-weight S&P 500 actually rose in 2000. In the 2006-2007 China bull market, materials and industrials tripled in 12 months, only to fall 65% to 85% in the year after the bubble burst, while the previously underperforming consumer staples, utilities, and technology sectors gained strength against the trend.
Who are the "humiliated" sectors today? Hartnett gives a clear direction: Since the Nasdaq surged 80% from its low in April 2026, the worst-performing sectors have been consumer staples, financials, and healthcare. According to the historical script, they are the sectors most likely to outperform after the bubble ends.
The Next Phase of AI Investment: From "Builders" to "Users"
This is the section most enlightening for crypto and tech investors in the entire report.
Hartnett notes that technology companies' penetration in the credit market has reached a staggering level: The tech sector accounts for 10% of the U.S. investment-grade bond market and 8% of the high-yield bond market. This means tech companies are not only highly concentrated in the stock market but are also leveraging massively in the bond market.
His judgment: The leadership in AI investment is shifting. From the "spenders" (capex of large tech companies) and the "builders" (semiconductors) to the "users of AI" (the application layer). The best way to participate is through small-cap growth stocks, not by continuing to bet on large-cap tech.
The historical anchor for this analogy is the period after the "Nifty Fifty" bubble in the 1970s: From December 1974 to May 1981, small-cap growth stocks outperformed the S&P 500 by over 1,000%. Hartnett suggests a similar structural rotation may be brewing.
Fund Flows: Smart Money Quietly Turns Around
This week's fund flow data contains several notable signals.
Global equities saw a net outflow of $7 billion, the first in 9 weeks. Japanese stocks saw an outflow of $8.2 billion, the largest weekly outflow since May 2025. China funds saw an outflow of $14 billion, with cumulative outflows since January 2026 reaching $218 billion. Europe saw net outflows for seven consecutive weeks.
Meanwhile, bonds saw net inflows for the 57th consecutive week (this week: $23.6 billion). Investment-grade bonds saw inflows for eight consecutive weeks, and emerging market bonds for seven consecutive weeks. Notably, BofA's private clients made a record withdrawal from cash and a record purchase of long-term Treasury ETFs (TLT, JAAA, VGIT).
Translating this data: Institutional money is migrating from stocks to bonds, especially by extending duration. Private clients' cash allocation is at a historical low (9.6%), while their stock allocation is at a historical high (66%). Everyone is fully invested, everyone is optimistic.
This is precisely the reason for Hartnett's alarm.
Bull & Bear Indicator Triggers "Sell" Signal
BofA's Bull & Bear indicator rose from 8.0 to 8.5, moving further into the contrarian "sell" zone. This indicator triggers a sell signal when it exceeds 8.0.
Among the six components of this indicator, fund manager positioning is at the 98th percentile (extremely bullish), bond fund flows are at the 85th percentile (extremely bullish), hedge fund positioning is at the 72nd percentile (bullish), and credit market technicals are at the 77th percentile (bullish). None of the six components show pessimism.
Since 2002, this indicator has triggered 17 sell signals. Subsequently, global equities fell an average of 2% to 3% over the next two to three months, with a hit rate of about 60% and maximum drawdowns reaching 15% to 20%.
June: Event Risks Converge
Hartnett used a word: chockablock.
June 10th US CPI (expected around 4%), 11th ECB rate hike, 15th G7 summit, 16th Bank of Japan rate hike, 17th Warsh's first FOMC press conference, 18th UK by-election, plus a large window for equity issuance.
Against a backdrop where everyone is fully invested and all indicators are extremely optimistic, any "surprise" from these events could become the trigger for profit-taking. Hartnett's advice is direct: Take profits, act inversely when yields are falling and stocks are rising.
The political backdrop he provides is also noteworthy: Trump's economic approval rating has fallen to 35%, and inflation approval to 28%, both hitting new lows. The political cost of the Iran conflict is backfiring on the White House.
2026's Winners and Losers
Performance ranking year-to-date as of May 27th:
The biggest winners are Oil (+54.4%) and South Korean stocks (+111.6%). The worst performers are Bitcoin (-16.3%) and Indian stocks (-10.4%). Chinese stocks fell 7.9%, with China funds seeing cumulative outflows of $218 billion. Gold rose only 2.5%, trading flat after the war premium faded.
A counterintuitive fact: Among all major asset classes, Bitcoin is the worst-performing asset of 2026, and by a significant margin. The second-worst performer, Indian stocks, fell only about two-thirds as much as Bitcoin.
For crypto investors, this report carries an uncomfortable implication: Bitcoin is at the bottom year-to-date among all assets, still seeing weekly net outflows (this week: $1.2 billion), and within BofA's framework, the high correlation of crypto with risk assets suggests that if the "post-bubble" script truly plays out, Bitcoin may not be spared.
Disclaimer: This article is Tide Research's collation and interpretation of a third-party brokerage research report. The ratings, target prices, earnings forecasts, and related judgments cited in the article are the views of that brokerage's analyst, representing only the stance of their affiliated institution. They do not represent the views of Tide Research, nor do they constitute any investment advice.
The market carries risks, and decisions should be made independently. This article should not be used as a basis for buying or selling any securities.