Weekly active crypto devs drops over 26% over the last 3 months

CointelegraphОпубликовано 2022-09-09Обновлено 2022-09-09

Введение

The crypto industry has seen more than a 26% reduction in weekly active developers over the last three months amid a prolonged market slump, the latest data shows. 

The crypto industry has seen more than a 26% reduction in weekly active developers over the last three months amid a prolonged market slump, the latest data shows. 
According to Blockchain data aggregator Artemis, the four leading smart contract platforms — Ethereum, Polkadot, Solana, and Cosmos experienced even higher drop-off, clocking 30.5%, 43.6%, 48.4%, and 48.9% reductions in developer activity respectively over the last three months. 

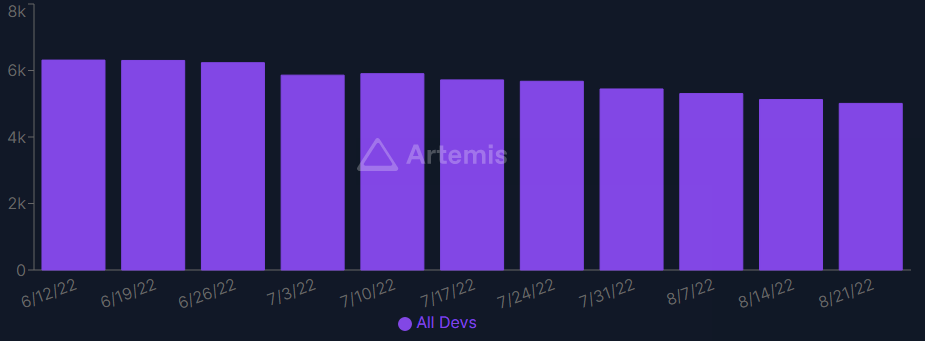
Source: ArtemisInterestingly, decentralized data storage protocol Interplanetary File System (IPFS) and blockchain network Internet Computer were among the few top smart contract platforms to have seen growth throughout this period, with increases of 206.6% and 21.7% respectively.
Blockchain developers are primarily responsible for designing blockchain architecture, maintaining and upgrading infrastructure, and building smart contracts that power decentralized applications.
Blockchain developer activity is considered one of the most important metrics for the success of a smart contract platform, as one that lacks developers will likely struggle to grow.
Crypto researcher and founder of Tascha Labs, Tascha Che told her 173,700 Twitter followers on Sept. 8 that she doesn’t believe the trend is of much concern, as the fall was attributed to the exit of “tourist builders” and “tourist investors,” which will now allow legitimate builders to “have peace and quiet to get real work done.”
Active developers across all crypto protocols have dropped 30% this yr.
Tourist builders are leaving along w/ tourist investors.
Finally the industry is having some peace & quiet to get real work done.
h/t @Artemis__xyz pic.twitter.com/PAGi6Yh7eo
— Tascha (@TaschaLabs) September 8, 2022
Another Twitter user, identifying themselves as a Binance research analyst didn’t comment on the downward trend but said developer activity will be an “important metric” to consider in the years to come because of the “flywheel effect” it has on the industry.
The fall in developer activity follows a crypto market downfall from April to mid-June, which saw the entire crypto market cap slashed from $2.1 trillion to $890 billion.

Похожее

Bitcoin Trading Strategy Breakdown: Celebrity Predictions and Classic Models All Fail, Only These Four Indicators Remain

Analysis of Bitcoin Trading Strategies: Why Celebrity Forecasts and Classic Models Fail, Leaving Only These Four Reliable Indicators This analysis examines the failure of common Bitcoin prediction methods and identifies four reliable indicators for constructing a trading strategy. The author reviewed all major BTC prediction approaches from 2017-2025, categorizing them into three groups: celebrity price targets (consistently over-optimistic), analytical models like Stock-to-Flow (broken post-2022), and on-chain signals. The key finding is that more data often creates confusion, not clarity. The strategy discards unreliable elements: celebrity predictions (incentivized to be extreme), pure models (invalidated by post-ETF market changes), and the Fear & Greed Index used alone (too many false signals). Four reliable indicators were selected: 1. **MVRV Z-Score:** Accurately identifies cycle bottoms when entering its green zone (e.g., 2018, 2020, 2022). Note: Its ability to call tops is now ineffective post-2024. 2. **SOPR (28-day MA):** Consistently signals bottoms when below 1.0, indicating holders are selling at a loss. 3. **ETF Net Flow:** A crucial post-2024 metric showing institutional momentum (e.g., sustained inflows = buying). 4. **Macro Liquidity (Fed policy & M2):** Sets the overall directional bias (e.g., bullish during easing cycles). The core strategy involves waiting for a multi-signal共振 (resonance). For example, a bottom signal requires MVRV in the green zone + SOPR < 1.0. A top signal requires overheated on-chain data + sustained ETF outflows. Macro policy sets the overall direction. The Fear & Greed Index is only used as a weighted confirmatory signal, never alone. Action is only taken when three or more indicators align. The author automated this into a monitoring system that sends Telegram alerts only when signals trigger. As of the article's date (April 15, 2026), the system showed a strong bottom signal: extreme fear (F&G=12), MVRV in the buy zone, and SOPR < 1.0. The only contrary signal was weak ETF flows. Historically, such triple on-chain共振 has preceded 100%+ returns. The conclusion emphasizes building a personal framework over relying on external predictions, allowing for iterative improvement and customization based on individual risk tolerance.

marsbit1 ч. назад

Bitcoin Trading Strategy Breakdown: Celebrity Predictions and Classic Models All Fail, Only These Four Indicators Remain

marsbit1 ч. назад

Торговля

Спот
Фьючерсы
活动图片