1. BTC pullback prompt adjustment signal
During BTC's short-term horizontal trading, the price fluctuation space is very small, and the intraday amplitude is only 2.5% to 4%. The signs of change are very clear. In terms of trading volume, the corresponding trading volume on the K-line of BTC day shows contraction. On the premise that the number of active addresses does not rise significantly, the BTC trading heat tends to fall. At the same time, the closing of the Bollinger line is very obvious. The short-term fluctuation space of the price is narrowed to a very small area. The recent weak trend indicates that the possibility of the market falling is increased.
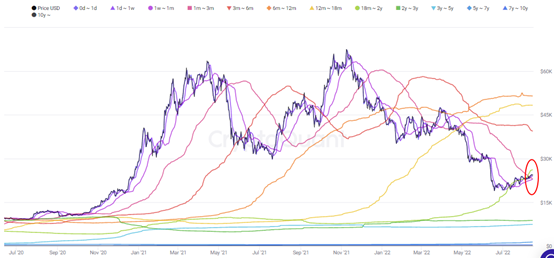
2. After the cost price moves down, the selling pressure increases
During the period when BTC continued to rebound slightly, the current price of US $24000 was above the cost price of US $23203 for investors in 1 to 3 months. That is to say, in the past three months, the trading of investors has been in a profit-making state as a whole, and the selling pressure has increased after the short-term profit. There is little room for BTC price increase in the near future, which makes it more difficult for the price to leave the price range. It is also shown in the figure that BTC has just reached above the average cost price of investors in the past three months. Meanwhile, the price rise is sluggish, which naturally indicates a signal of reducing positions.
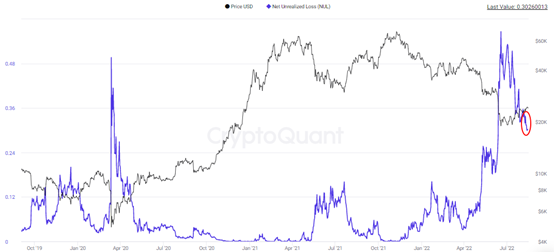
3. The unrecognized loss of BTC decreased slightly
Although the unrecognized loss of BTC dropped slightly, the overall amount still failed to drop to the historical low level. In other words, when more losses are not realized, the potential selling pressure of BTC will not disappear in the short term. When the rebound space improves, this selling behavior may continue in the short term.
BTC's nul indicator shows that the percentage of unrecognized losses was 0.303 on August 14. A brief review of the following BTC value changes in the past three years shows that the value often hovers below 0.12, and the highest value reaches 0.567 in 2022. Although the unrecognized loss is in the process of continuous decline, it will take a long time for the indicator to fall back to the low level.
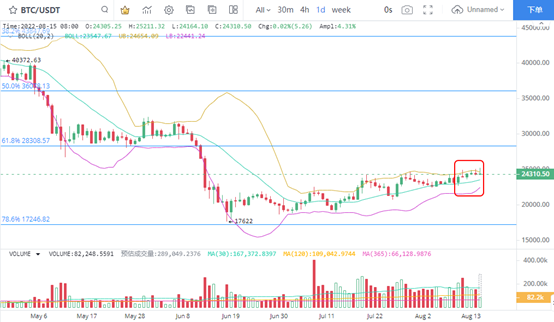
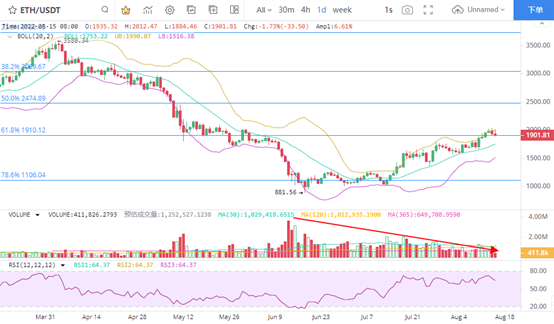
4. Eth rose weakly
After eth successfully broke through the $1910 corresponding to 61.8% of Fibonacci, the momentum of price rise weakened and the signs of reversal continued. The shrinking trend of trading volume in the daily K-line chart shown in the figure continues. The shrinking volume in the last week indicates that there is a challenging demand for prices. At the same time, attention was paid to the poor performance of the RSI index, the value failed to move further upward, and there were signs of deviation. Next, the expectation of pullback will be improved. In the near future, more attention will be paid to the low-end rather than the high-end opportunities.
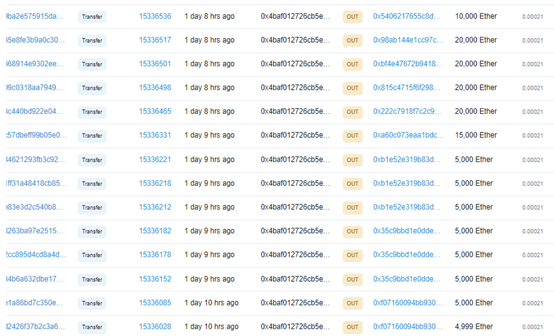
5. Whale transferred 289 million US dollars (ETH)
In terms of giant whale changes, ETH giant whale address 0x4baf012726cb5ec7dda57bc2770798a38100c44d has transferred as many as 145000 eth, with a value of US $280 million. From the time and price of transfer out, 4999 eth were transferred out for the first time at 22:26 on August 13, 2022. Next, at 00:18 on August 14, all eth were transferred out. So far, the number of eth in most addresses has not changed, indicating that the giant whale has not made any further transfer.
Considering that the giant whale address was created on October 28, 2016, the last record of large-scale transfer out was 5000 eth on July 31, 2019, and the current balance is only about 14 eth. According to this judgment, if it is used for sale, the prompt for price adjustment can be properly paid attention to.