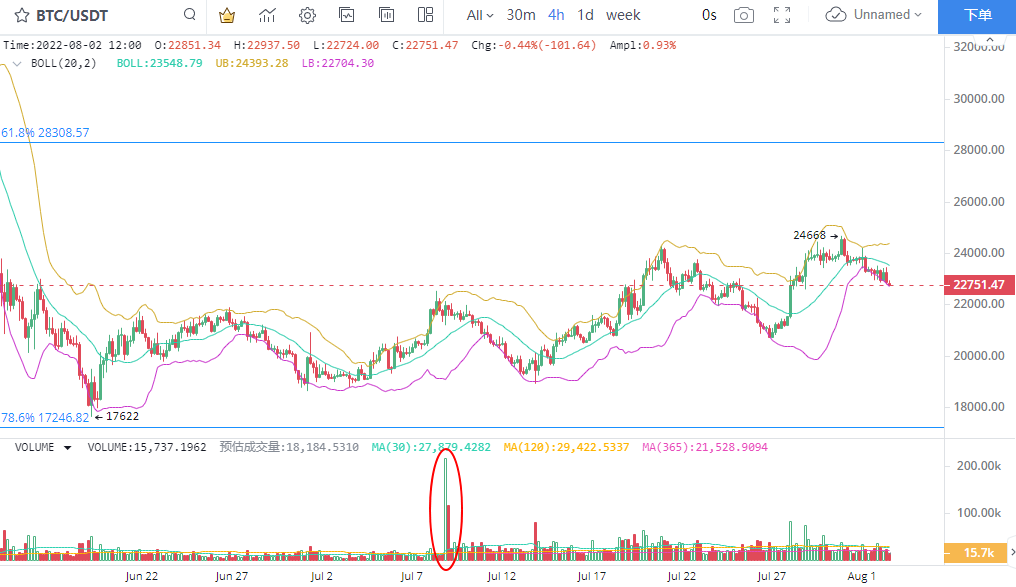
【重磅解读】60万枚BTC巨鲸交易量消失,近80万投资者发送ETH

火必研究院Опубликовано 2022-08-02Обновлено 2022-08-03

Введение

BTC出现加速回撤迹象,巨鲸交易显著降低,意味着行情回归缩量调整。

1、 BTC三连阴回调

4小时K线图显示,BTC在7月8日的交易量峰值出现以后整体交易量开始放大,7月8日以后的平均交易量很高,意味着近期有较多的BTC完成换手。同时可以看到,尽管平均交易量相对较高,但是成交量回落态势已经确认。7月29日开始,BTC交易量萎缩的过程中价格回调空间增加。
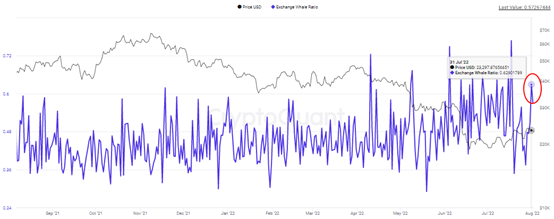
2、BTC主力抛压占比回升

BTC主力抛压显著反弹,数值上看,8月1日主力抛压占比达到了0.572,短线峰值出现在7月31日,数值达到了0.629。从抛压达到的力度来看,BTC抛售量占比峰值达到了短线高位,但是数值能否维持高位运行,还需要进一步验证。

BTC主力抛压占比轻松达到了0.5以上,数值接近了0.6,意味着BTC的抛售量已经处在了高位,有进一步拉低价格的潜在风险。
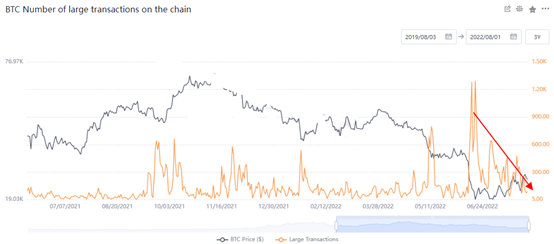
3、BTC链上巨鲸交易持续减少

BTC主力链上交易量不断下降,其数值从高位的1295回落到了77笔附近,而平均值已经向每日200笔回落。交易数量上看,BTC在8月1日的交易量为93笔,相对6月18日的1295笔下降了1202笔。以每笔大额交易的BTC交易量500枚BTC判断,BTC交易量下降了60万枚BTC。这表明,BTC的交易热度在不断回落,下跌激发的交易量回升影响已经很小。这也说明,BTC或将又一次进入到熊市缩量运行状态,下跌预期提升。
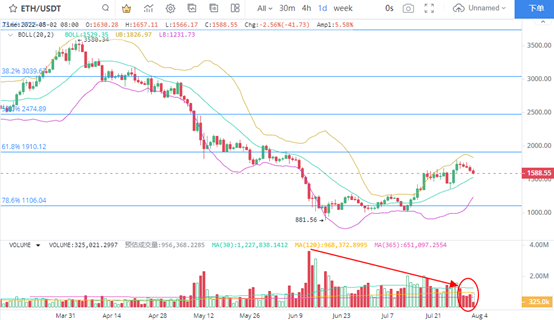
4、ETH交易量持续低迷

ETH交易量低迷特征更为明确,特别是相比前期6月份成交量峰值,近期日内交易量为峰值水平的12%左右。因此,ETH短线上涨乏力的确有数据支撑。按照ETH交易量低迷的特征发展,价格短期难以维持高位运行。接下来,ETH回落到1000美元平台的可能性提升。

结合近期ETH活跃地址数较高,而发送ETH的活跃度更高,验证了对价格回落的判断。
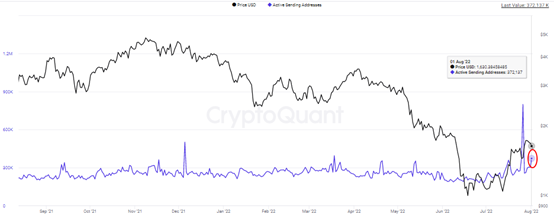
5、ETH发送者地址数再次反弹

ETH的活跃地址数反弹阶段,其发送ETH的地址活跃度表现更好,表明更多的ETH或被投资者用于抛售。图中显示,7月26日ETH的活跃地址数反弹至79.9万的数值高位,意味着相对近期平均值27.5万增长了190%。而8月1日的发送ETH的活跃地址数迹象出现反弹迹象,数值达到了37.2万的高位。

交易层面上看,ETH短期抛压较重,持币风险增长,关注进一步回调的低吸机会。

Похожее

Bitcoin Trading Strategy Breakdown: Celebrity Predictions and Classic Models All Fail, Only These Four Indicators Remain

Analysis of Bitcoin Trading Strategies: Why Celebrity Forecasts and Classic Models Fail, Leaving Only These Four Reliable Indicators This analysis examines the failure of common Bitcoin prediction methods and identifies four reliable indicators for constructing a trading strategy. The author reviewed all major BTC prediction approaches from 2017-2025, categorizing them into three groups: celebrity price targets (consistently over-optimistic), analytical models like Stock-to-Flow (broken post-2022), and on-chain signals. The key finding is that more data often creates confusion, not clarity. The strategy discards unreliable elements: celebrity predictions (incentivized to be extreme), pure models (invalidated by post-ETF market changes), and the Fear & Greed Index used alone (too many false signals). Four reliable indicators were selected: 1. **MVRV Z-Score:** Accurately identifies cycle bottoms when entering its green zone (e.g., 2018, 2020, 2022). Note: Its ability to call tops is now ineffective post-2024. 2. **SOPR (28-day MA):** Consistently signals bottoms when below 1.0, indicating holders are selling at a loss. 3. **ETF Net Flow:** A crucial post-2024 metric showing institutional momentum (e.g., sustained inflows = buying). 4. **Macro Liquidity (Fed policy & M2):** Sets the overall directional bias (e.g., bullish during easing cycles). The core strategy involves waiting for a multi-signal共振 (resonance). For example, a bottom signal requires MVRV in the green zone + SOPR < 1.0. A top signal requires overheated on-chain data + sustained ETF outflows. Macro policy sets the overall direction. The Fear & Greed Index is only used as a weighted confirmatory signal, never alone. Action is only taken when three or more indicators align. The author automated this into a monitoring system that sends Telegram alerts only when signals trigger. As of the article's date (April 15, 2026), the system showed a strong bottom signal: extreme fear (F&G=12), MVRV in the buy zone, and SOPR < 1.0. The only contrary signal was weak ETF flows. Historically, such triple on-chain共振 has preceded 100%+ returns. The conclusion emphasizes building a personal framework over relying on external predictions, allowing for iterative improvement and customization based on individual risk tolerance.

marsbit1 ч. назад

Bitcoin Trading Strategy Breakdown: Celebrity Predictions and Classic Models All Fail, Only These Four Indicators Remain

marsbit1 ч. назад

Торговля

Спот
Фьючерсы
活动图片