Ethereum: Are investors preparing for ETH 2.0 as exchange balances hit four-year lows?

AmbcryptoОпубликовано 2022-07-24Обновлено 2022-07-24

Введение

Ethereum balances on exchanges reached a four-year low in what could have been termed a surprise.

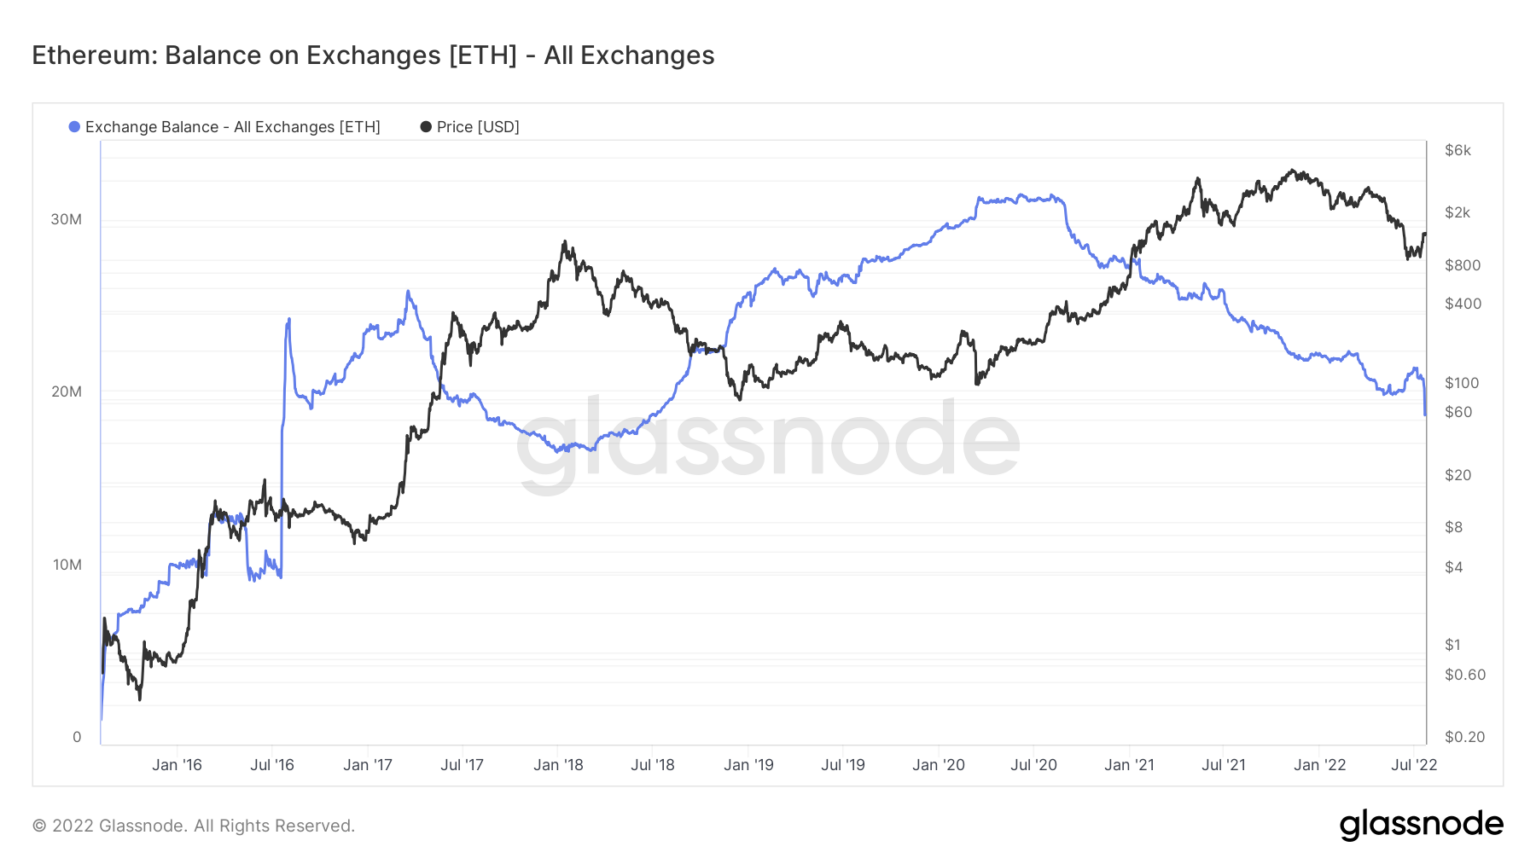
Ethereum [ETH] balances on exchanges reached a four-year low in what could have been termed a surprise. According to data from the leading analytics platform, Glassnode, the total number of ETH held on exchanges remained under 20 million. Glassnode recorded this number in the late hours of Friday, 22 July.

Source: Glassnode

The last time ETH had such exchange balances was in July 2018. During the period, ETH exchange balances were about 19.93 million. In the wake of this happening, investors may be preparing for the Ethereum 2.0 network upgrade. Also, Vitalik Buterin’s mention of the 100,000 transactions per second possibility after the merge could have influenced investors’ action. However, it is not only that. The exchange balance reductions have also been matched with something else.

Over and out

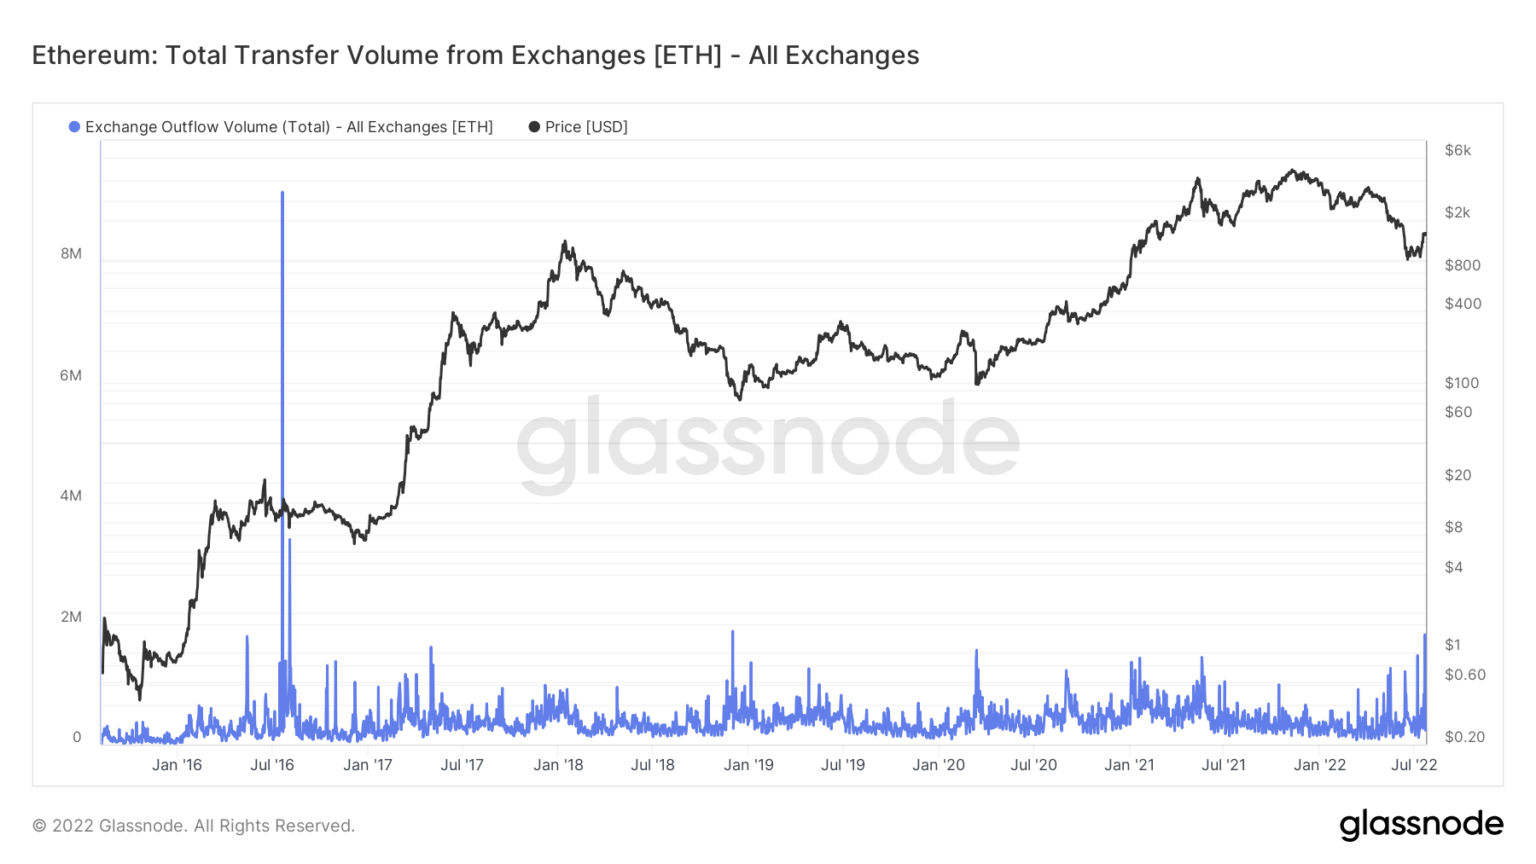
Similarly, the exchange outflow volume of the Ethereum chain has been massive over the past few days. The metric hit a 13-month All-Time high (ATH). At press time, it was 602.618— a figure it had not reached since June 2021.

Source: Glassnode

This action further proves the assumption that investors do not plan to hold their ETH on centralized exchanges as the Consensus Layer launch draws closer. So, how has this affected the ETH price movement?

Action meets preparedness

While the ETH trading volume had increased 2.98% over the last 24 hours, its price had dipped slightly. After trading as high as $1,638 on 22 July as per CoinMarketCap, ETH has now left the $1,600 zone. At the time of this writing, the ETH price traded at $1,580.

Besides this price drop, what else has been happening to ETH?

A look at Santiment data showed that the daily active ETH addresses had increased. As of 19 July, it was 487,070. However, it had surged to 536,750 at press time. The network activity had also increased from 17 July till today (23 July).

Source: Santiment

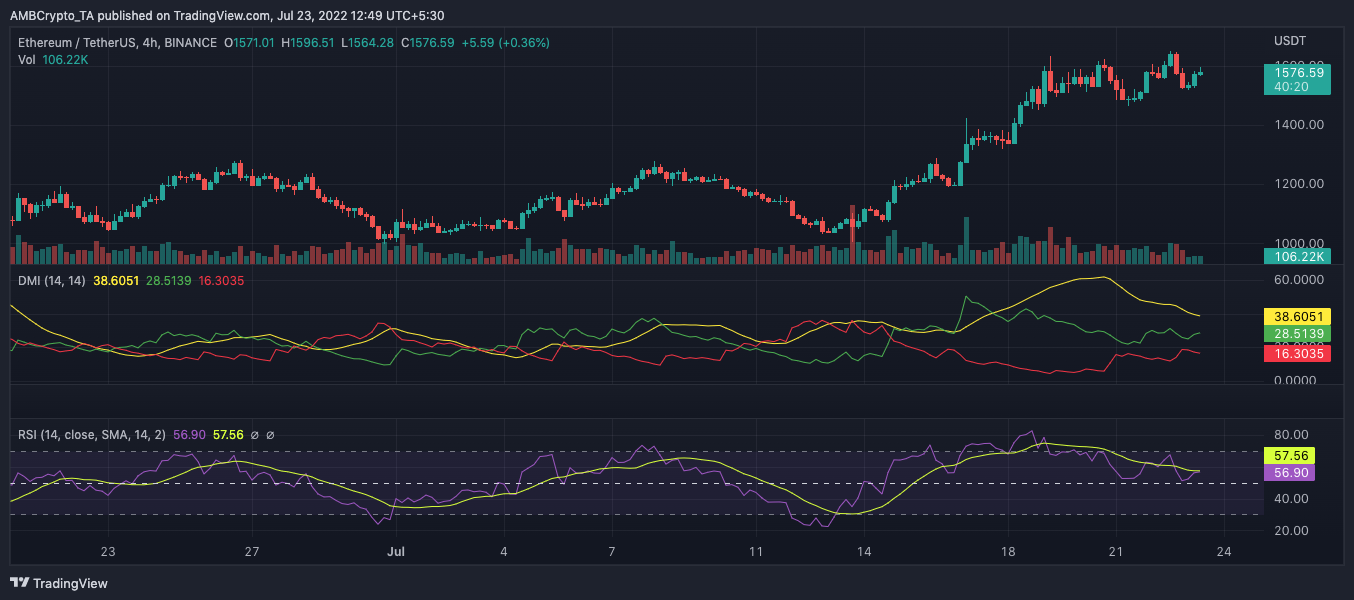
On the daily four-hour chart, it seems that ETH still has the potential to rise from its current price. The Directional Movement Index (DMI) revealed that buyers might have the edge. However, the -DMI line (red) looks remarkably close to meeting the +DMI (green), showing that a bearish sentiment is also possible.

Source: TradingView

Additionally, the Relative Strength Index (RSI) maintained some neutrality, swinging between 56 and 57 regions. However, it still provides an edge for buyers. With this, ETH price movement might be yet undecided. However, more investor action could be the game changer that sets it in a specific direction.

Похожее

Bitcoin Trading Strategy Breakdown: Celebrity Predictions and Classic Models All Fail, Only These Four Indicators Remain

Analysis of Bitcoin Trading Strategies: Why Celebrity Forecasts and Classic Models Fail, Leaving Only These Four Reliable Indicators This analysis examines the failure of common Bitcoin prediction methods and identifies four reliable indicators for constructing a trading strategy. The author reviewed all major BTC prediction approaches from 2017-2025, categorizing them into three groups: celebrity price targets (consistently over-optimistic), analytical models like Stock-to-Flow (broken post-2022), and on-chain signals. The key finding is that more data often creates confusion, not clarity. The strategy discards unreliable elements: celebrity predictions (incentivized to be extreme), pure models (invalidated by post-ETF market changes), and the Fear & Greed Index used alone (too many false signals). Four reliable indicators were selected: 1. **MVRV Z-Score:** Accurately identifies cycle bottoms when entering its green zone (e.g., 2018, 2020, 2022). Note: Its ability to call tops is now ineffective post-2024. 2. **SOPR (28-day MA):** Consistently signals bottoms when below 1.0, indicating holders are selling at a loss. 3. **ETF Net Flow:** A crucial post-2024 metric showing institutional momentum (e.g., sustained inflows = buying). 4. **Macro Liquidity (Fed policy & M2):** Sets the overall directional bias (e.g., bullish during easing cycles). The core strategy involves waiting for a multi-signal共振 (resonance). For example, a bottom signal requires MVRV in the green zone + SOPR < 1.0. A top signal requires overheated on-chain data + sustained ETF outflows. Macro policy sets the overall direction. The Fear & Greed Index is only used as a weighted confirmatory signal, never alone. Action is only taken when three or more indicators align. The author automated this into a monitoring system that sends Telegram alerts only when signals trigger. As of the article's date (April 15, 2026), the system showed a strong bottom signal: extreme fear (F&G=12), MVRV in the buy zone, and SOPR < 1.0. The only contrary signal was weak ETF flows. Historically, such triple on-chain共振 has preceded 100%+ returns. The conclusion emphasizes building a personal framework over relying on external predictions, allowing for iterative improvement and customization based on individual risk tolerance.

marsbit1 ч. назад

Bitcoin Trading Strategy Breakdown: Celebrity Predictions and Classic Models All Fail, Only These Four Indicators Remain

marsbit1 ч. назад

Торговля

Спот
Фьючерсы
活动图片