After the U.S. CPI hit a 40-year high in June, the crypto market and U.S. stocks began to rebound, which shows that the current market consensus is changing. At present, investors' expectations for interest rate hikes seem to be fading, and they may be more convinced that the recession expectation will loosen the liquidity margin, which may lead to a new bull market.
Figure 1: US Dollar Index
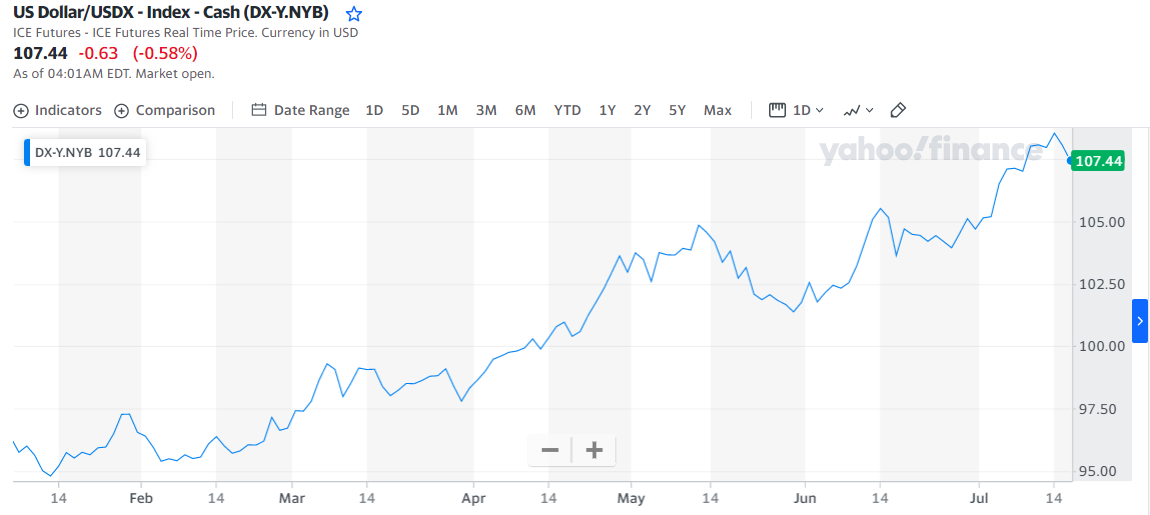
Source: Yahoo Finance
1. The U.S. recession expectation intensifies, and liquidity is expected to ease
(1) Consumption weaken
On July 16, household spending could lead to a shift in the coming months indicated by the Michigan Consumer Sentiment Index,which fell to the lowest level of 2022.
(2) Recession fears intensify
Economists polled by The Wall Street Journal this month said there was a 49 percent chance of a recession in the next 12 months. Some 46% of economists believe the Fed to raise rates too much and cause unnecessary economic weakness, 12.3% think the rate hikes too slow, and 42% say the Fed raised an appropriate rate to balance inflation and growth.
(3) Liquidity is expected to be marginally looser
Most economists interviewed by The Wall Street Journal expect the Fed to raise the federal funds rate to at least 3.25% by the end of 2022, and keep it at or above that level through next year. They said the Fed could make its first rate cut by the end of 2023.
2. Overseas pressure is increasing, and stagflation may be inevitable
(1) Overseas pressure
At present, the EU/Japan debt is more serious than that of the United States and it is difficult to stabilize their currencies' value through lifting their interest rate.
An overly strong dollar policy will be under pressure from other western central banks, and eventually the Fed may need to buy more foreign bonds to stabilize the world capital markets.
(2) Recession is close
Over the long run the Fed will most likely chart a middle course that will take the form of stagflation——Ray Dalio
As Dalio said, the Fed may not succeed in a soft landing, and can only achieve a hard landing through stagflation.
3. The probability of crypto market rebound increases as the marginal liquidity increases
(1) The increasing of liquidity may lead to a upgoing crypto price
Since recessions follow closely, the Fed is likely to only add 75 yards in July and will not shrink its balance sheet on a large scale. This may lead to further upward revisions for the crypto assets.
In fact, the price of many DeFi governance tokens have seen a sharply growth.
(2) All technical indicators show that the crypto price has entered the oversold range
1) Bitcoin’s MVRV ratio shows Bitcoin has been oversold
Figure 2: Bitcoin’s MVRV Index
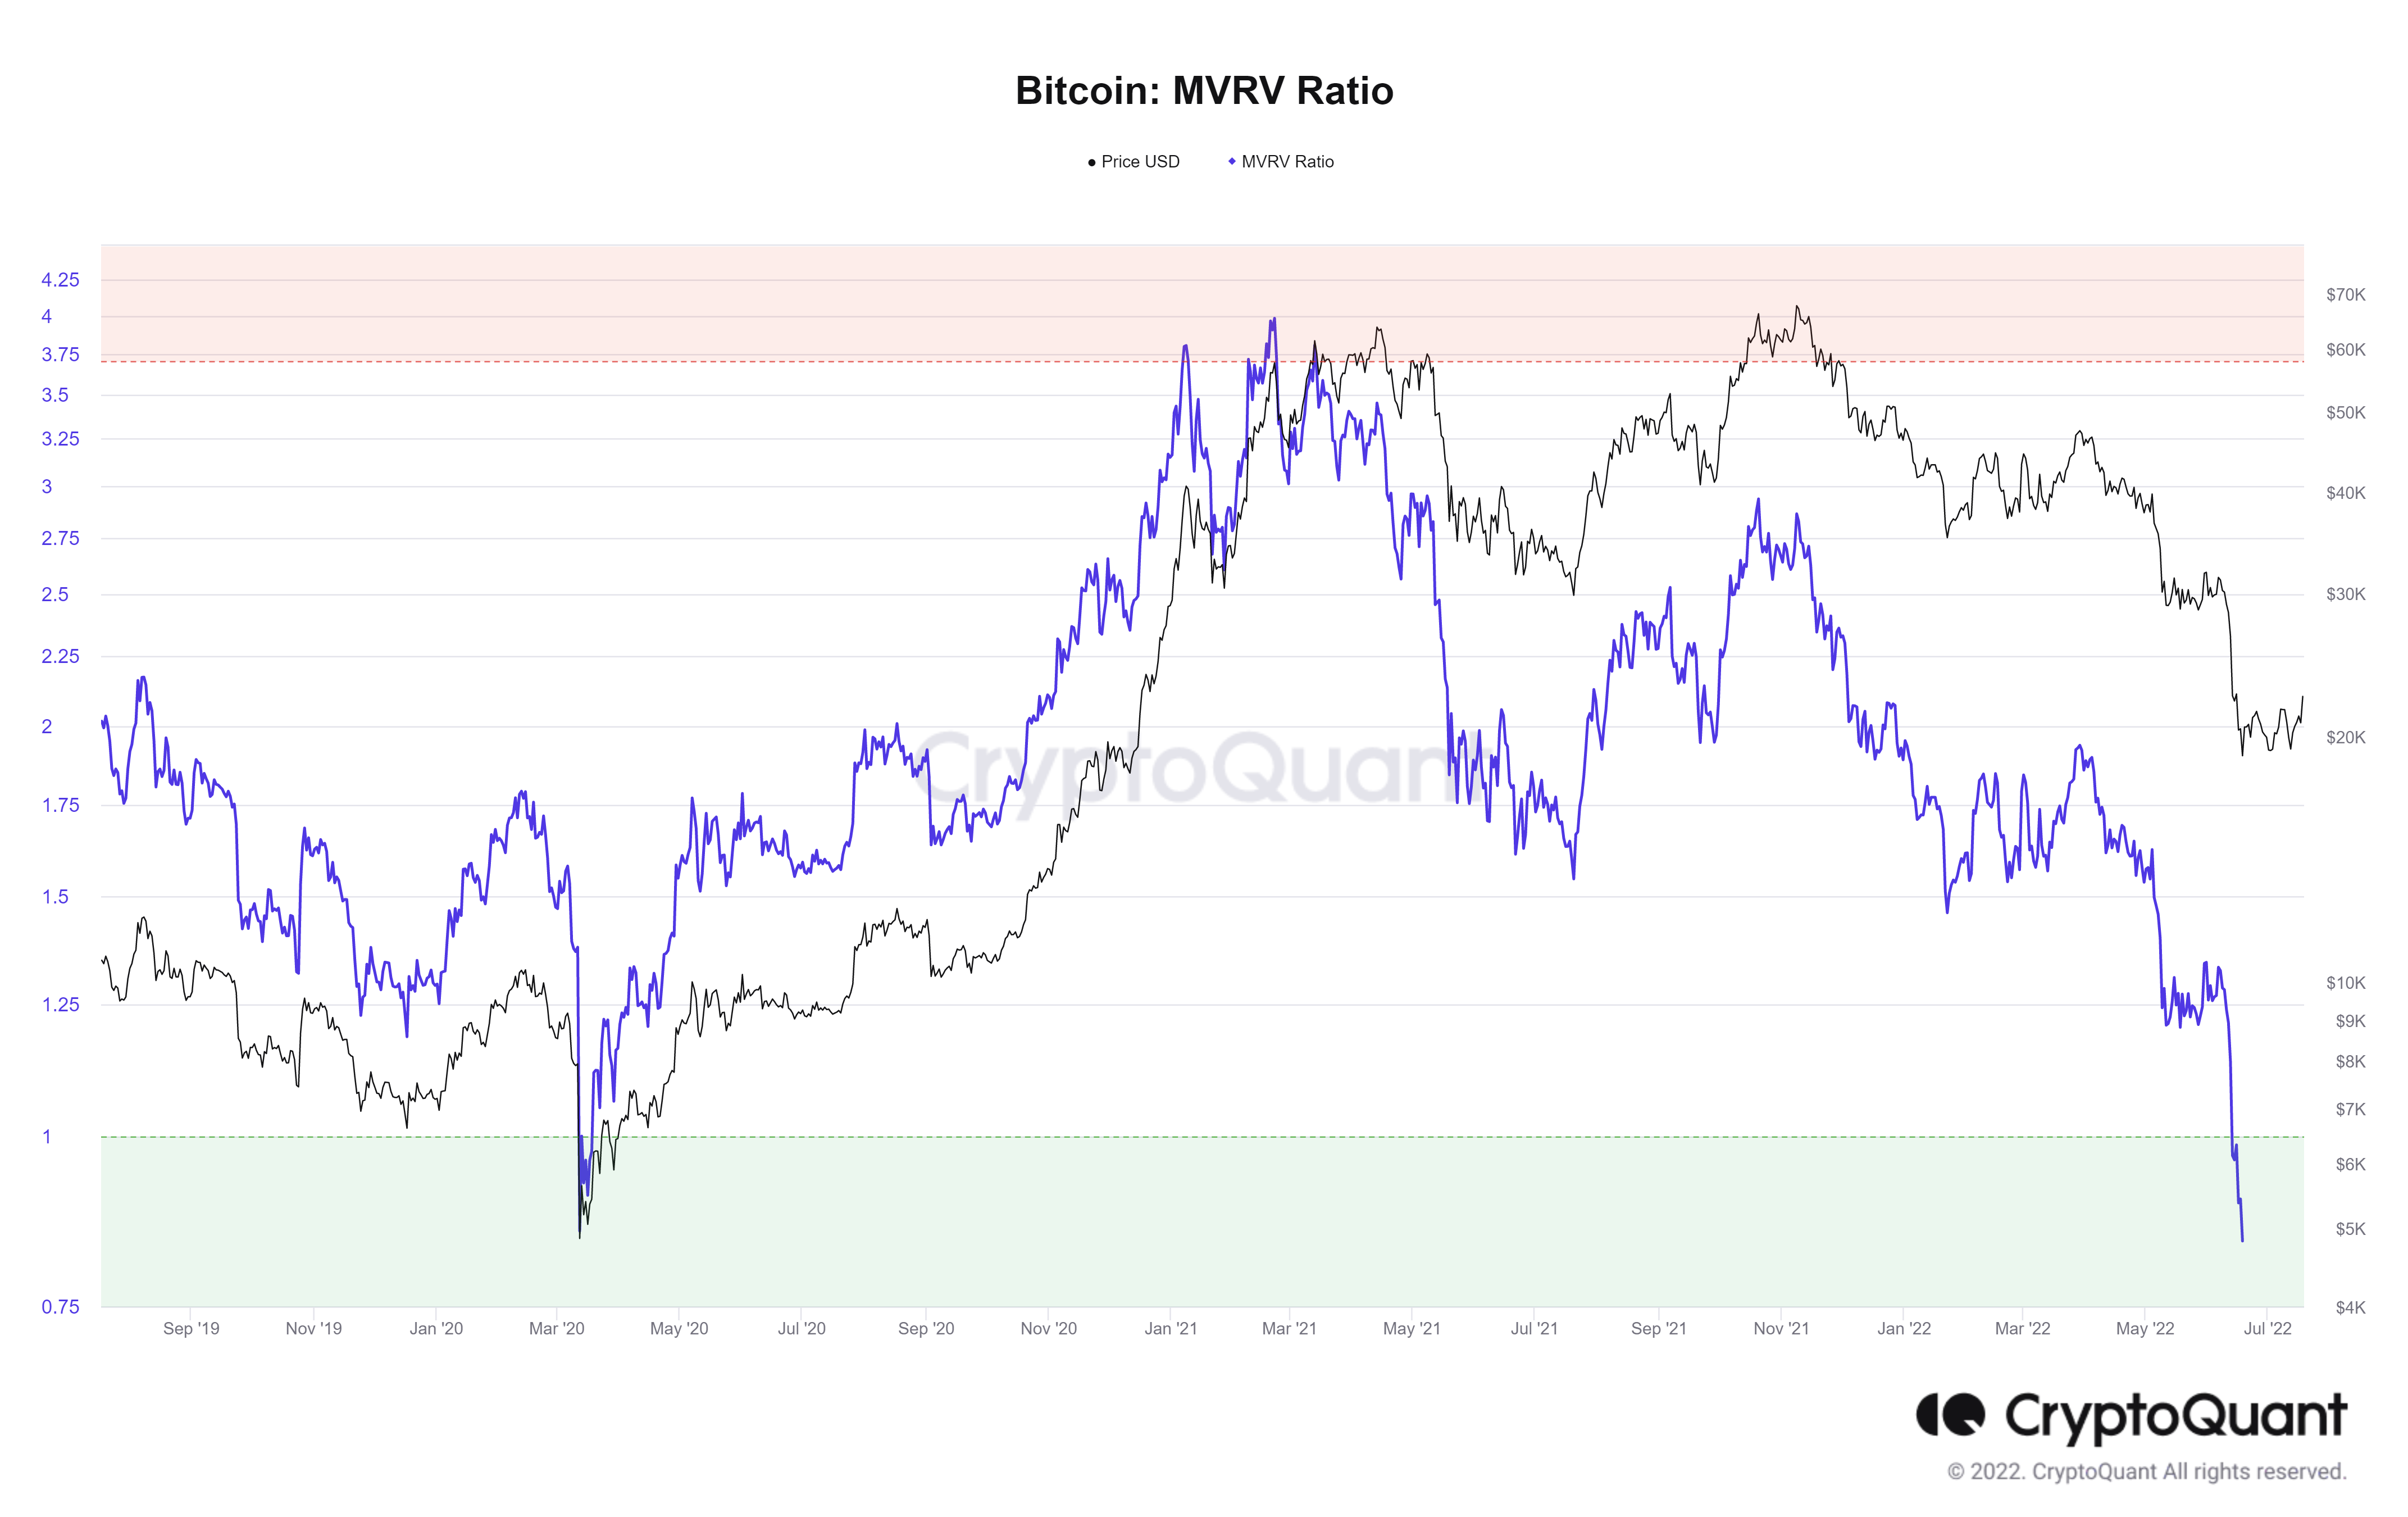
Source: Cryptoquant
The ratio of BTC’s MVRV has reached a historically low level after a recent slump, indicating that BTC’s is below its “fair value”.
2) The market has capitulated - long-term holders start selling
According to Glassnode's data, long-term holders are also starting to sell, and the panic in the market may have reached its extreme.
(3) Rebound or Renaissance?
After the Luna and 3AC events, the market has completed the process of doubt to surrender. Whether this time the upside is a rebound or a reversal, let us wait and see.