Did Solana actually surpass Ethereum with 136% higher NFT volume

AmbcryptoОпубликовано 2022-07-05Обновлено 2022-07-05

Введение

According to a recent retweet by Santiment, it seems that the volume of Solana-based NFTs exceeded that of Ethereum. The volume differs with a tiny yet critical factor.

According to a recent retweet by Santiment, it seems that the volume of Solana-based NFTs exceeded that of Ethereum. Well, in reality, the volume differs with a tiny yet critical factor.

It is Solana and not Ethereum

The volume charted in the tweet is not calculated in USD but in the blockchain’s native token. Thus, despite Ethereum observing only 550k ETH worth of NFT transactions, the total volume exceeds $550 million. However, 1.3 million SOL worth of NFT transactions, only amounts to $43.39 million.

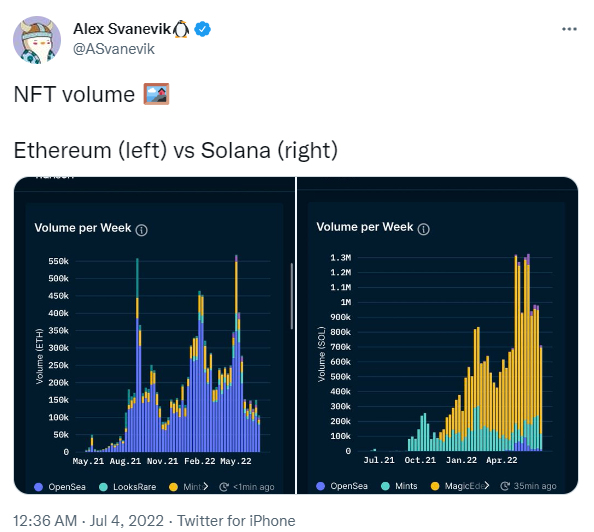
Put simply, in no way did Solana’s NFT surpass that of Ethereum. Well, except on one front. The total transactions conducted throughout the week on Ethereum came up to a little under 500k, while Solana noted almost 630k transactions this week alone.

This 32.6% higher activity on Solana does show that lower costs can attract higher usage, but it doesn’t amount to much.

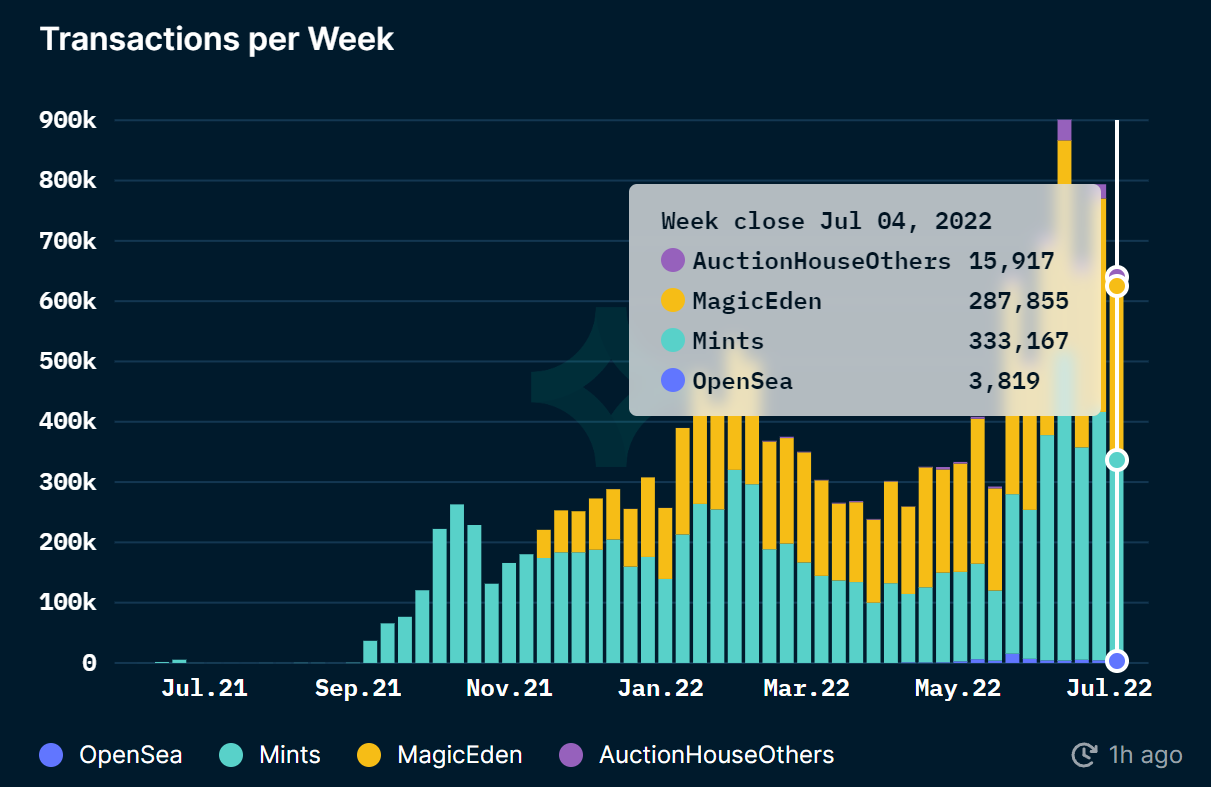
Solana NFT transactions this week | Source: Nansen

On the macro time frame, Solana’s NFT marketplace has been observing a gradual decline in terms of daily volume.

In the last two months, the highest volume noted on MagicEden, the NFT marketplace, which dominates 98.5% of all Solana NFT volume, was 380k SOL ($12.6 million) that too back in May.

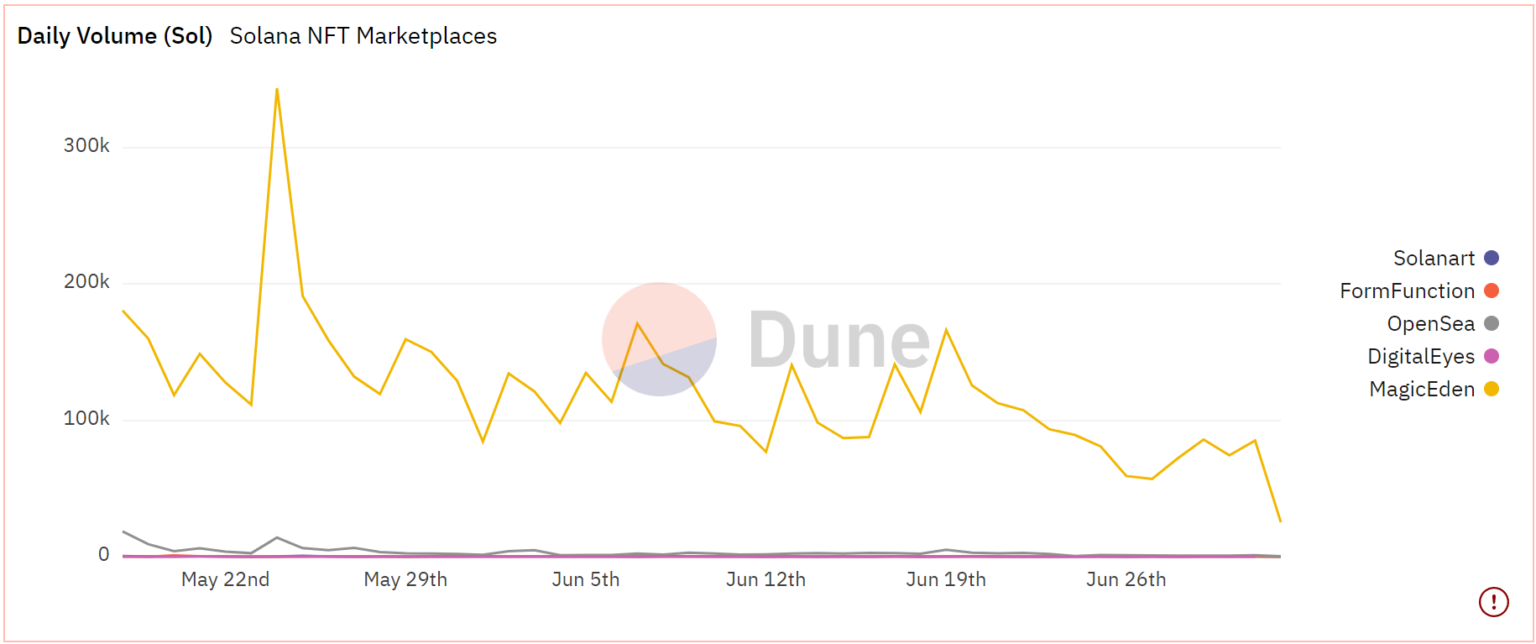
Solana daily NFT volume | Source: Dune – AMBCrypto

Notably, over the same time period, the daily NFT purchases on Solana have decreased by 78.85%. But Solana is not alone in this, as OpenSea on Ethereum is also experiencing a similar conundrum.

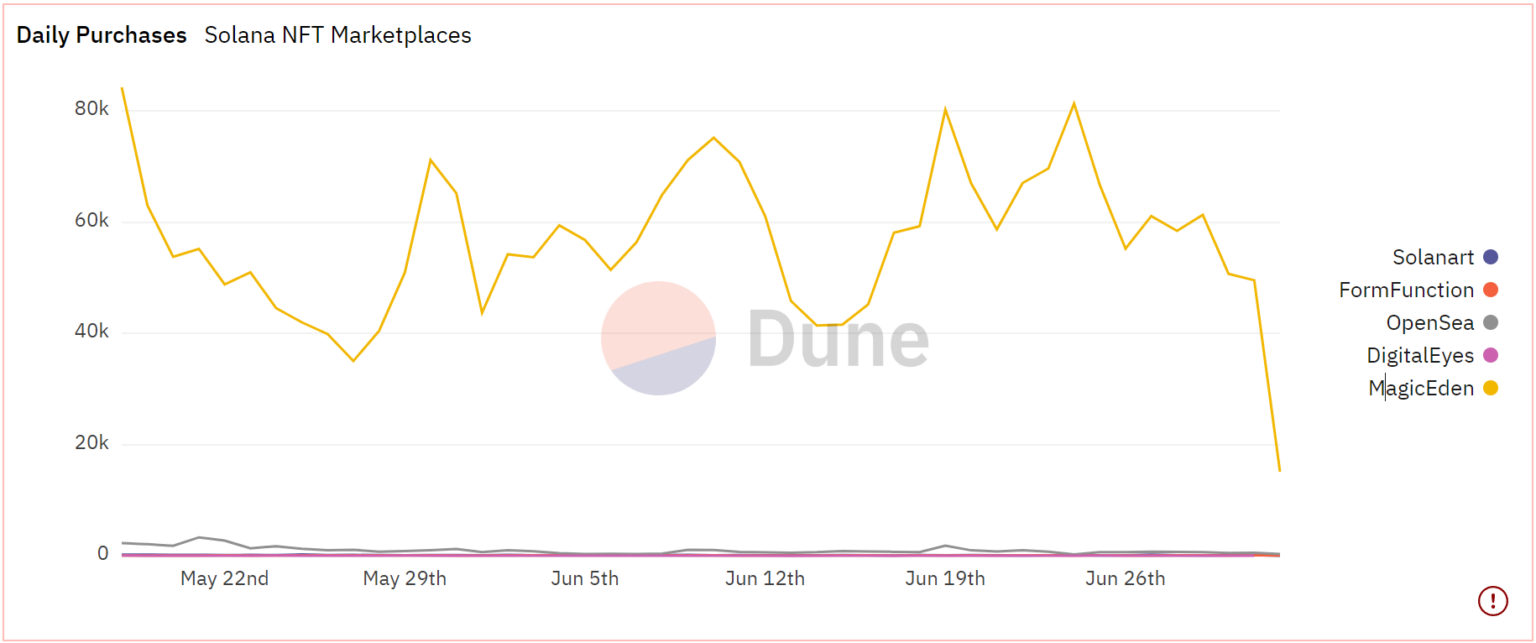
Solana daily NFT purchases | Source: Dune – AMBCrypto

The daily volume of NFT transactions on Ethereum from their peak of $476 million in May, dropped to just $15 million on 3 July. In fact, the dropoff in transaction volume from April to May was surprisingly high as figures sank from $2.59 billion to $696 million.

Additionally, as of press time this month, OpenSea has already registered $43 million worth of volumes. At this rate, by the end of this month, the marketplace would only record $344 million in transactions.

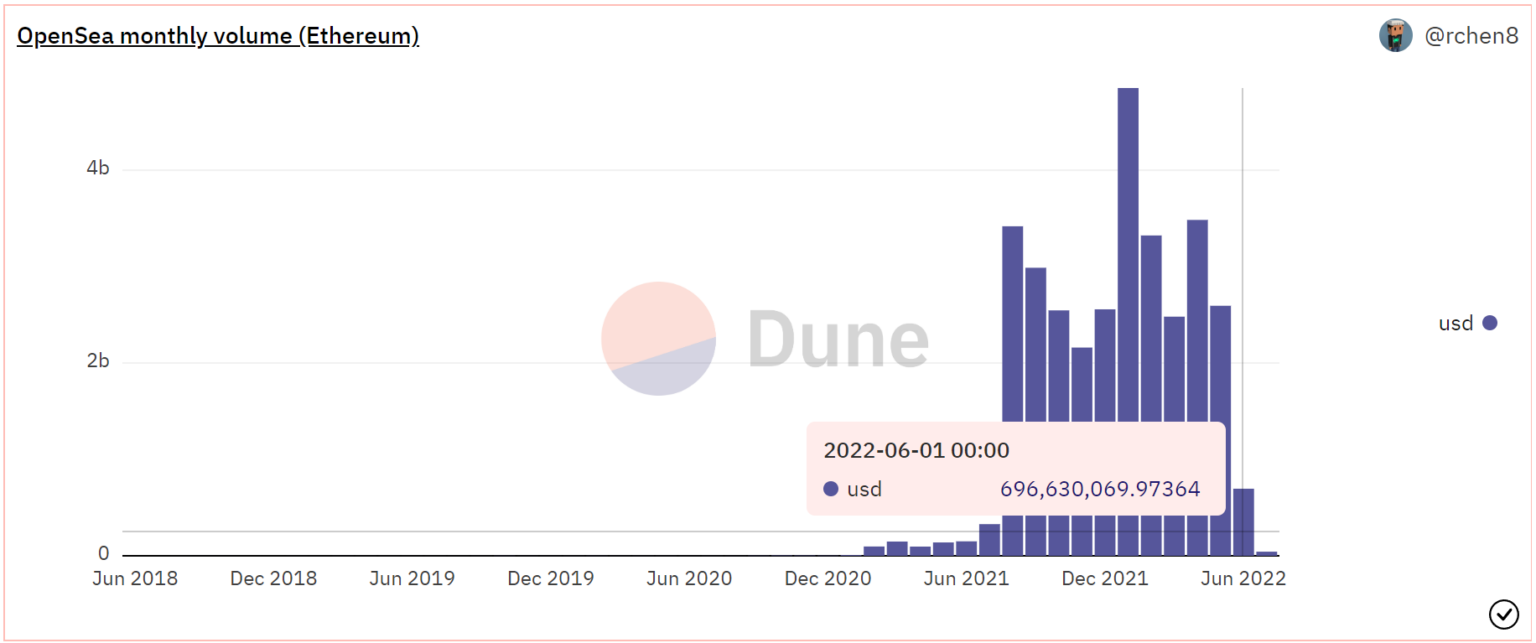
Opensea monthly NFT volume | Source: Dune – AMBCrypto

Besides, with the broader market treading downwards, investors will only keep themselves farther away from NFTs, so the figure might end up being correct.

Похожее

Bitcoin Trading Strategy Breakdown: Celebrity Predictions and Classic Models All Fail, Only These Four Indicators Remain

Analysis of Bitcoin Trading Strategies: Why Celebrity Forecasts and Classic Models Fail, Leaving Only These Four Reliable Indicators This analysis examines the failure of common Bitcoin prediction methods and identifies four reliable indicators for constructing a trading strategy. The author reviewed all major BTC prediction approaches from 2017-2025, categorizing them into three groups: celebrity price targets (consistently over-optimistic), analytical models like Stock-to-Flow (broken post-2022), and on-chain signals. The key finding is that more data often creates confusion, not clarity. The strategy discards unreliable elements: celebrity predictions (incentivized to be extreme), pure models (invalidated by post-ETF market changes), and the Fear & Greed Index used alone (too many false signals). Four reliable indicators were selected: 1. **MVRV Z-Score:** Accurately identifies cycle bottoms when entering its green zone (e.g., 2018, 2020, 2022). Note: Its ability to call tops is now ineffective post-2024. 2. **SOPR (28-day MA):** Consistently signals bottoms when below 1.0, indicating holders are selling at a loss. 3. **ETF Net Flow:** A crucial post-2024 metric showing institutional momentum (e.g., sustained inflows = buying). 4. **Macro Liquidity (Fed policy & M2):** Sets the overall directional bias (e.g., bullish during easing cycles). The core strategy involves waiting for a multi-signal共振 (resonance). For example, a bottom signal requires MVRV in the green zone + SOPR < 1.0. A top signal requires overheated on-chain data + sustained ETF outflows. Macro policy sets the overall direction. The Fear & Greed Index is only used as a weighted confirmatory signal, never alone. Action is only taken when three or more indicators align. The author automated this into a monitoring system that sends Telegram alerts only when signals trigger. As of the article's date (April 15, 2026), the system showed a strong bottom signal: extreme fear (F&G=12), MVRV in the buy zone, and SOPR < 1.0. The only contrary signal was weak ETF flows. Historically, such triple on-chain共振 has preceded 100%+ returns. The conclusion emphasizes building a personal framework over relying on external predictions, allowing for iterative improvement and customization based on individual risk tolerance.

marsbit17 мин. назад

Bitcoin Trading Strategy Breakdown: Celebrity Predictions and Classic Models All Fail, Only These Four Indicators Remain

marsbit17 мин. назад

Торговля

Спот
Фьючерсы
活动图片