1. BTC repeatedly vibrates to confirm support
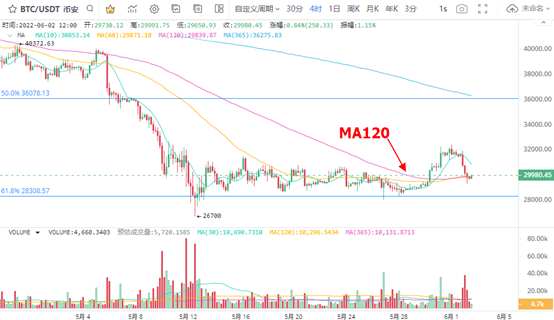
In terms of BTC price trend, the 4-hour K-line chart shows that after the price rises and falls, the short-term rebound continues after BTC approaches the 120 day moving average. During the decline, the trading volume rebounded slightly, which means that the selling pressure release efficiency is very high, and many investors choose to end their holdings in the short term. In general, the rise and fall of BTC is the reconfirmation of the bottom, and this confirmation process will continue.
Judging from the short-term price increase of BTC, it has not been effectively separated from the bottom area, nor from the price range where BTC chips are converted more. In the early stage, the chip turnover rate of BTC from May 8 to 12 was relatively sufficient, and the corresponding price range was below 34000. This range needs more trading day shocks to complete a better bottom signal. In the process of tamping the bottom, it happens to be a bargain opportunity for long-term investors.
2. Rapid decline in financing costs
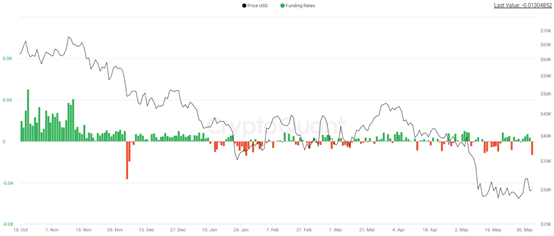
Judging from the financing cost, BTC is still in an area with heavy selling pressure. On June 1, when the BTC price eased down, its corresponding financing cost fell back to the low level of -0.013, indicating that the market is still at a price that is easier to change. The rapid decline in financing costs indicates that short sellers bring heavy selling pressure, and long sellers do not have enough energy to undertake selling pressure, which makes the expected rapid growth of price decline.
Not only that, the financing cost remained around 0, and the frequent retreat below 0 meant that the Bulls failed to organize the offensive. At the same time, for most investors, there are still many opportunities for low suction market trading. Low prices and low financing costs provide opportunities for foreign capital to enter the market. From the perspective of cash holding scale, it is suitable for fixed investment and a small amount of low absorption at present, so as to lower the overall holding cost.
3. Sideways fluctuation of eth price
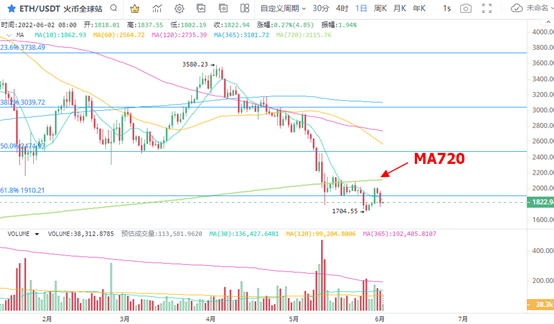
After the ETH price recently fell below USD 1900, the price adjustment continued during the short-term rebound. In terms of important pressure level, ETH failed to make an effective breakthrough against the 61.8% Fibonacci corresponding USD 1910. At the same time, the ETH price has not been around the 720 day average cost price in the near future, so the expectation of price adjustment is still very strong.
Due to frequent price shocks, short-term volume does not change the general trend of contraction. Therefore, in judging the reversal signal, the performance of volume and price has not yet been able to provide stronger data support.
Considering the low trading volume, the release intensity of selling pressure is not large. The ETH price will also be weak around us $1910, and will not usher in the reversal trend until the short-term selling pressure is exhausted.
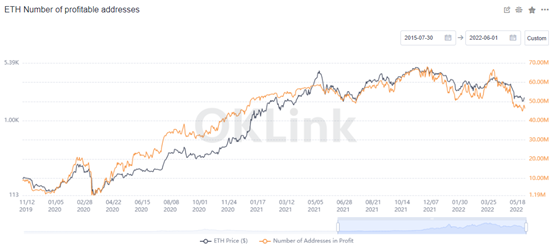
4. Eth profit address high-level operation
The current level of eth is similar to the low point in 2021, but from the performance of the number of profitable addresses, the number of profitable addresses has continued to reach a new low. This shows that the holding scale of investors holding eth is increasing. Nevertheless, the number of profit addresses of eth has greatly improved compared with the level at the beginning of 2020, mainly because the profit taking accumulated in the bull market is difficult to disappear in the short term. Judging from the speed of profit taking consumed in the ETH bear market, there is still a great possibility of price adjustment.
At least after the short-term price retreat and shock performance continue, it will not significantly reduce the number of profit taking in eth. At the same time, the recent trend of eth has not changed the situation that most investors hold money to make profits. From the perspective of price trend, ETH's downward trend continues, while from the perspective of cash holding profit, ETH has a large number of profit-making addresses, and the general trend of the market is in the upward stage. Unless there is a large price retreat.