Bitcoin continues to print a red weekly candle following the previous weekend's bull run. The market-leading asset closed the first week of June in the red at $27,115, with a 3.38% drop.
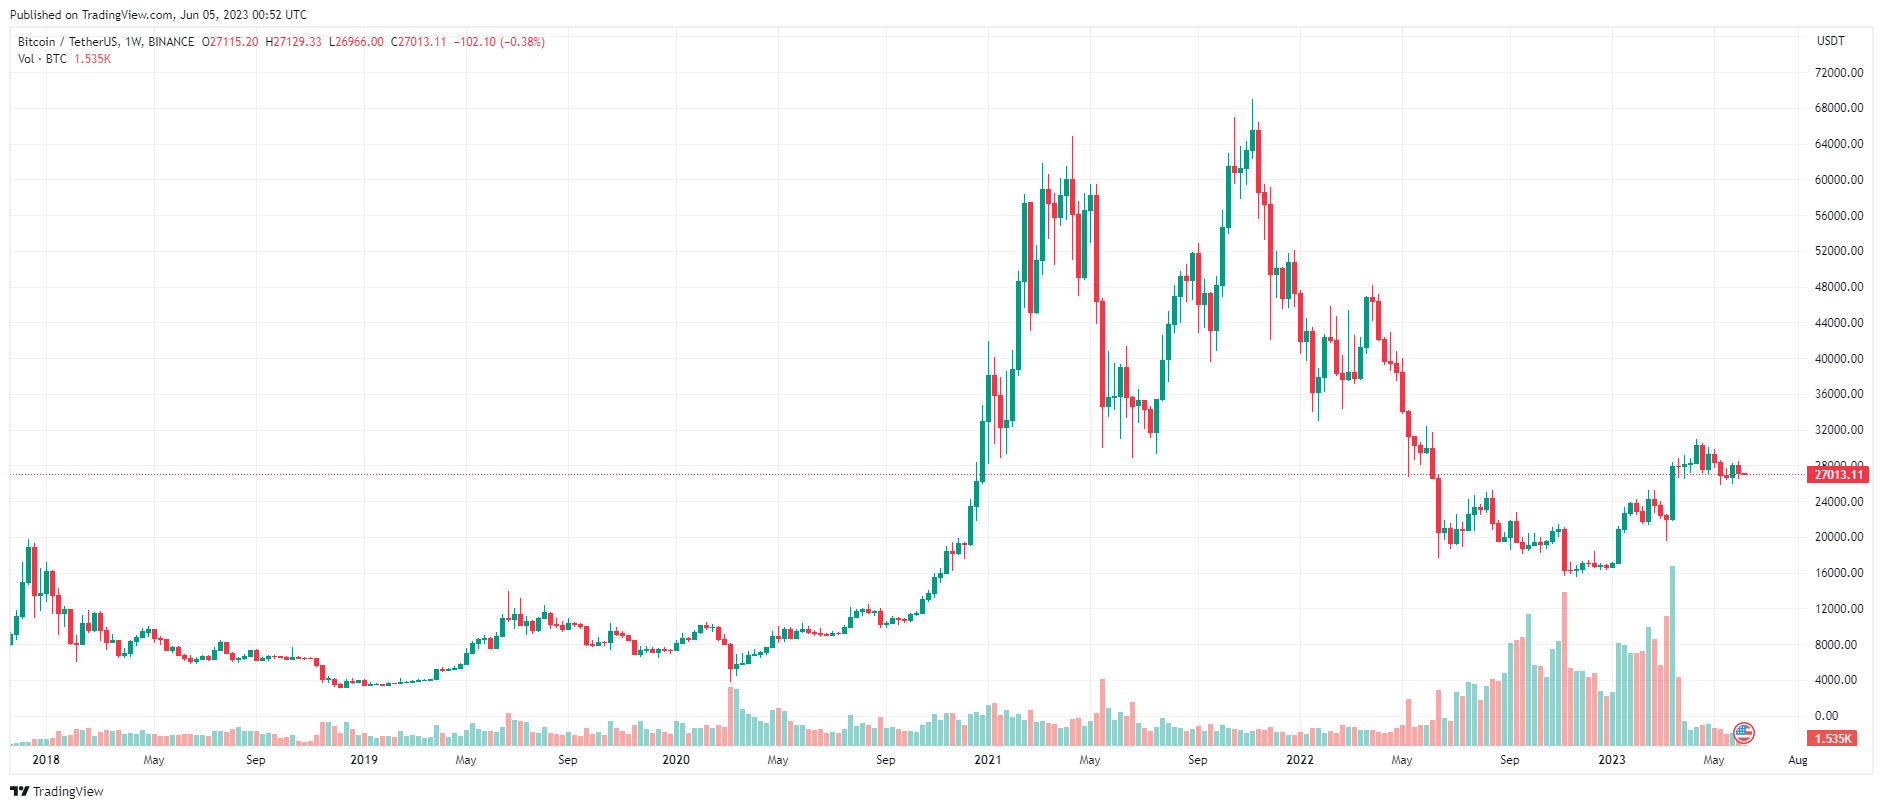
BTC Price Chart – 1 week | Source: TradingView
U.S. stock market futures were little changed on Sunday night after a broad-based rally last week, sending the S&P 500 to its best week since March and a peak since last August.
Dow Jones futures contract increased by 75 points; S&P 500 futures edged up 0.09% and Nasdaq-100 futures were mostly flat.
On Friday, stocks rallied at the weekend following strong May jobs data. The Dow rose 701.19 points, or 2.12%, marking its best day since January, to close. week at 33,762.76. The S&P 500 rose 1.45% to 4,282.37, while the Nasdaq Composite jumped 1.07% to 13,240.77, posting a sixth straight week of gains.
Over the weekend, President Joe Biden signed into law the debt ceiling bill, preventing the possibility of defaulting on the US government's debt.
Investor sentiment was good on Friday, after the Labor Department reported nonfarm payrolls growth in May. Public and private sector employment rose 339,000 in May, Compared to the Dow Jones estimate of 190,000, average hourly earnings grew at an annualized rate of 4.3%, slightly below economists' forecasts. The report also allayed fears of an impending recession.
What's more, investors are focused on whether the stock market is on track to recover in 2023, led by just a handful of tech stocks, and whether the market could form a medium correction. term or not.
Meanwhile, after a tense first-quarter earnings month, things should calm down next week. Investors will XEM at food demand and prices from JM Smucker, Campbell Soup and United Natural Foods. Stitch Fix, Signet Jewelers and DocuSign will also conduct income statements.
In terms of economic data, traders will keep an eye on PMI data for May from both the Institute of Supply Management and S&P Global on Monday, as well as factory orders and durable goods for April. On Monday On Wednesday, the Mortgage Bankers Association will release the latest data on home loan applications.
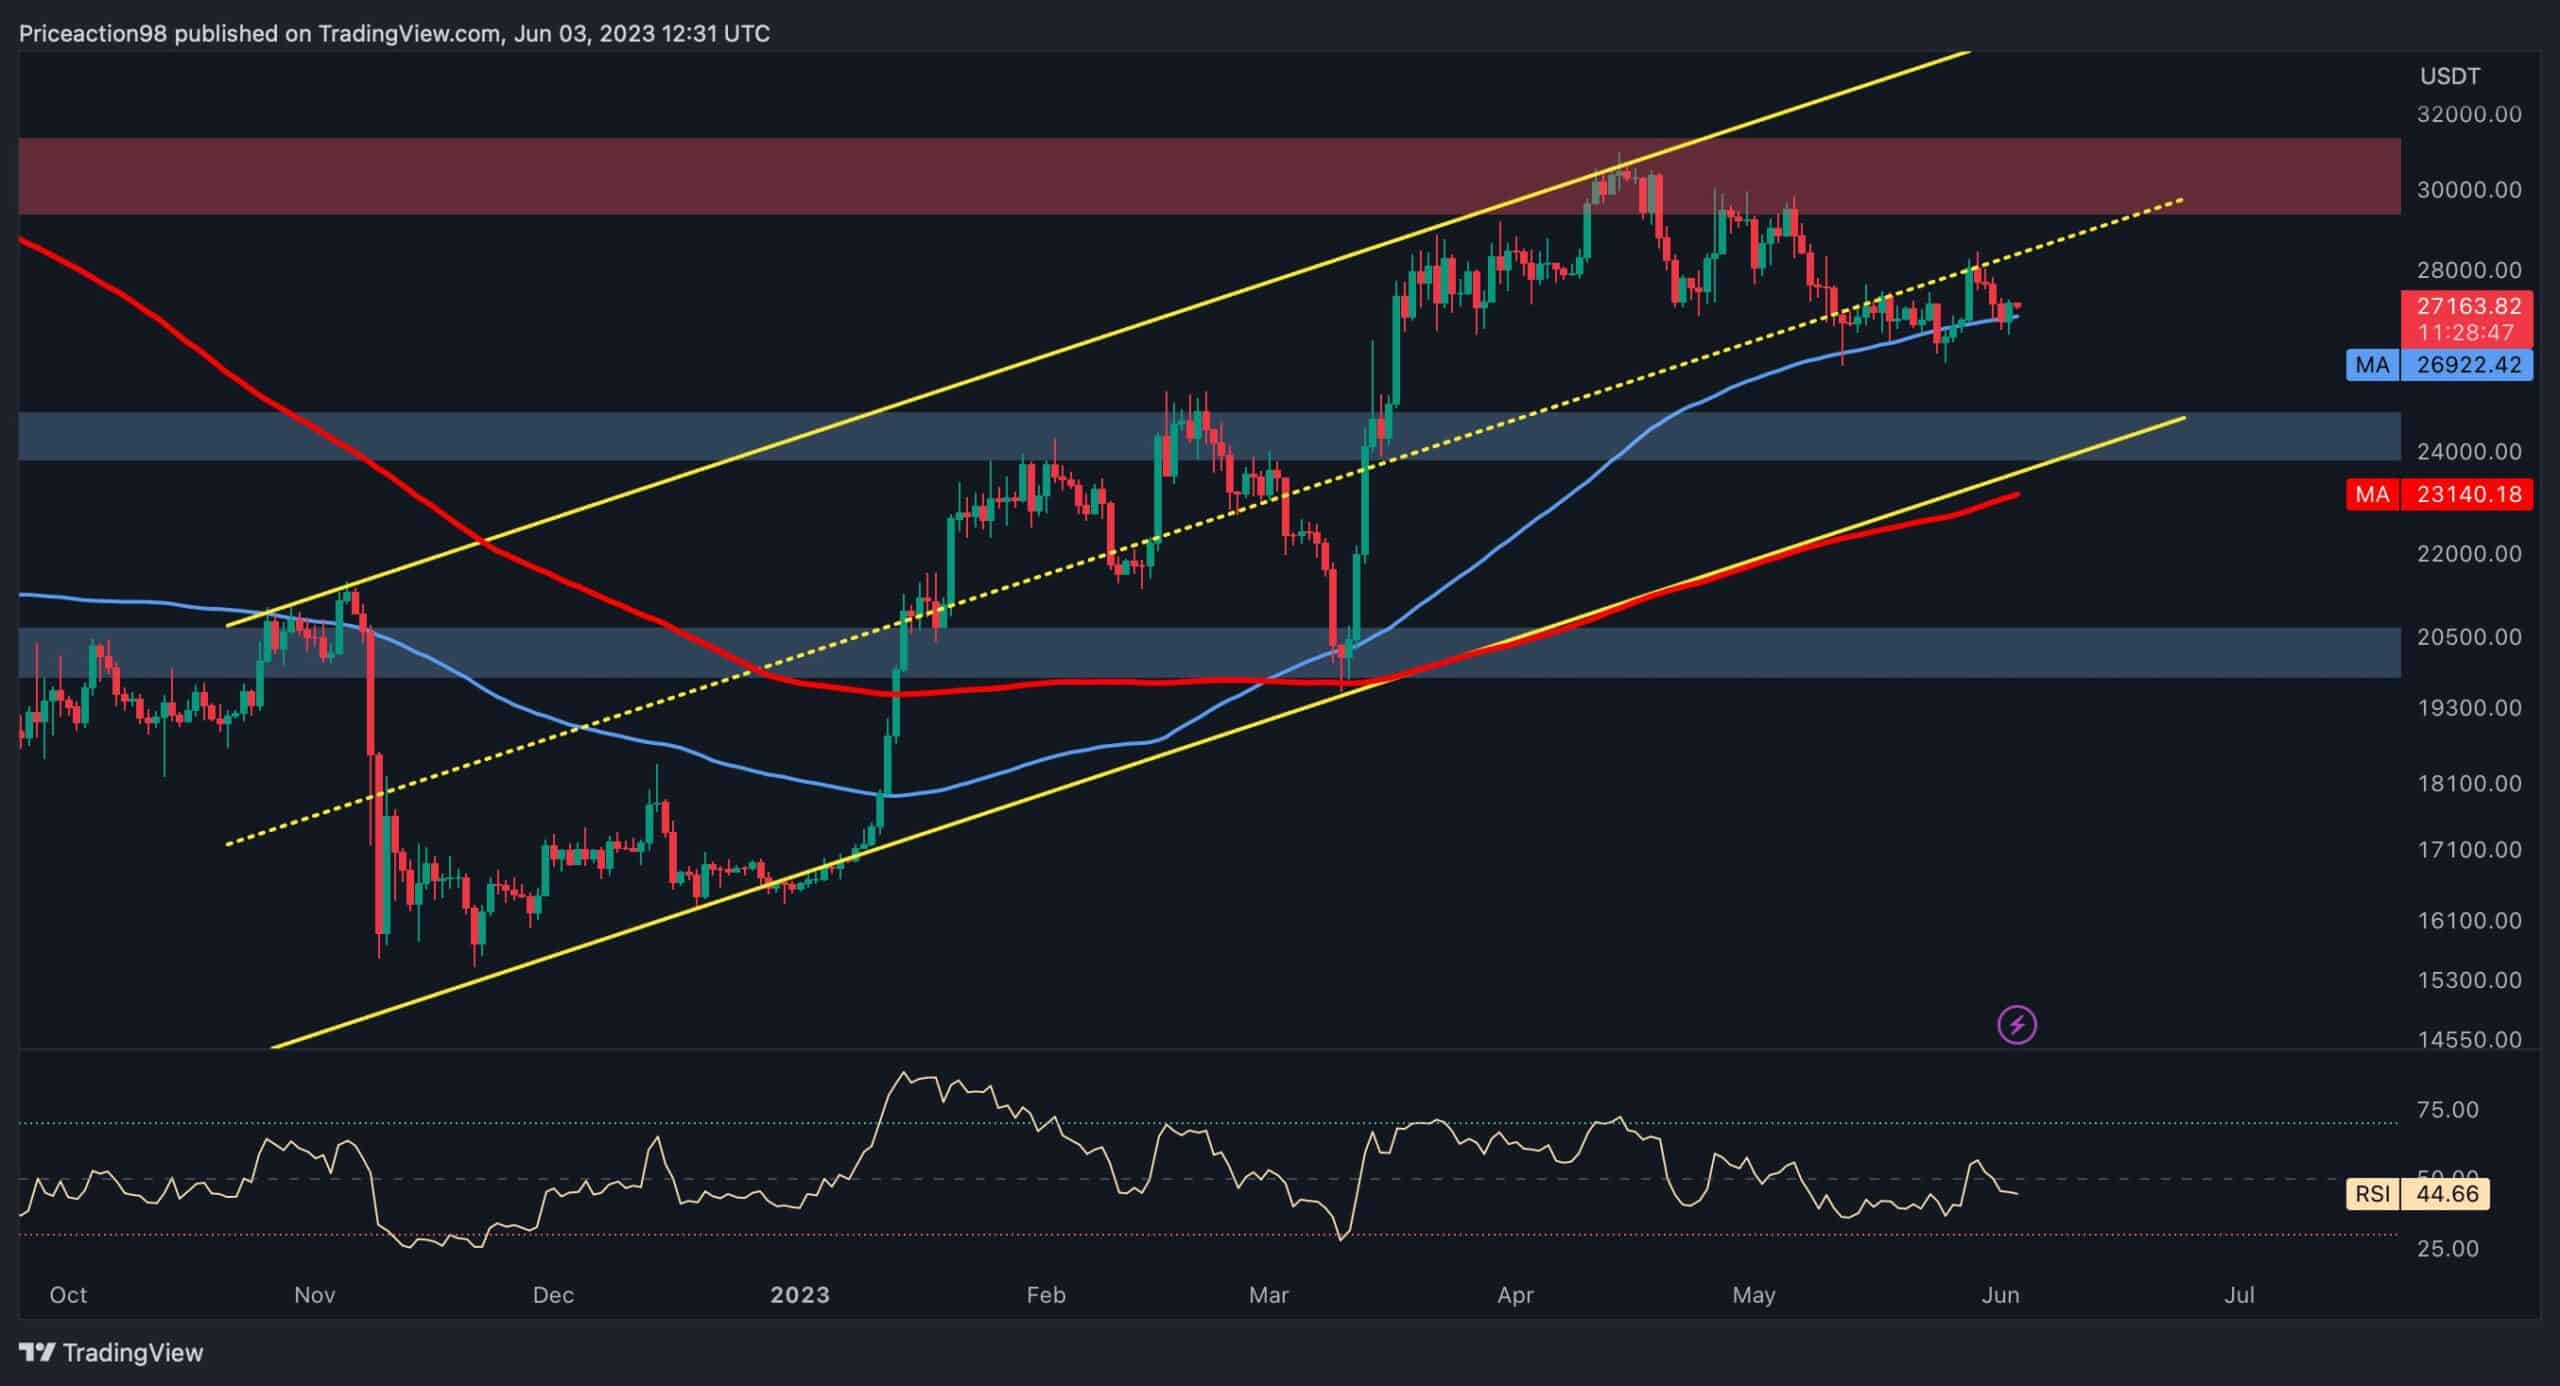
Bitcoin price is currently going through an accumulation phase and has touched the 100-day moving average at $26,922. However, two key support areas ahead are likely to halt the ongoing decline and trigger the next rally.
During the accumulation phase, BTC dipped slightly below the middle trendline of the ascending channel and tested it as a pullback. However, the price continued its downtrend by printing small red candles in a row and temporarily pausing at the 100-day moving average around $26,900.
A drop below this level, the lower threshold of the channel at $24,000 and the 200-day moving average at $23,000 could be potential price targets.
On the other hand, if Bitcoin finds support at the 100-day moving average, an attempt to break above the stiff $30,000 resistance will be the most likely scenario.
Source: TradingView
Analyzing the 4-hour time frame, a flag pattern was developed during the recent correction of the market. BTC price is currently consolidating within this flag, forming lower highs and lower lows.
However, there is a strong support area between the 61.8% ($23,923) and 50% ($25.274) levels of the Fibonacci retracement level. These two Fibonacci levels indicate potential targets for corrective periods. Given the current market situation, it is likely that the price will continue to correct until it reaches this important support area.
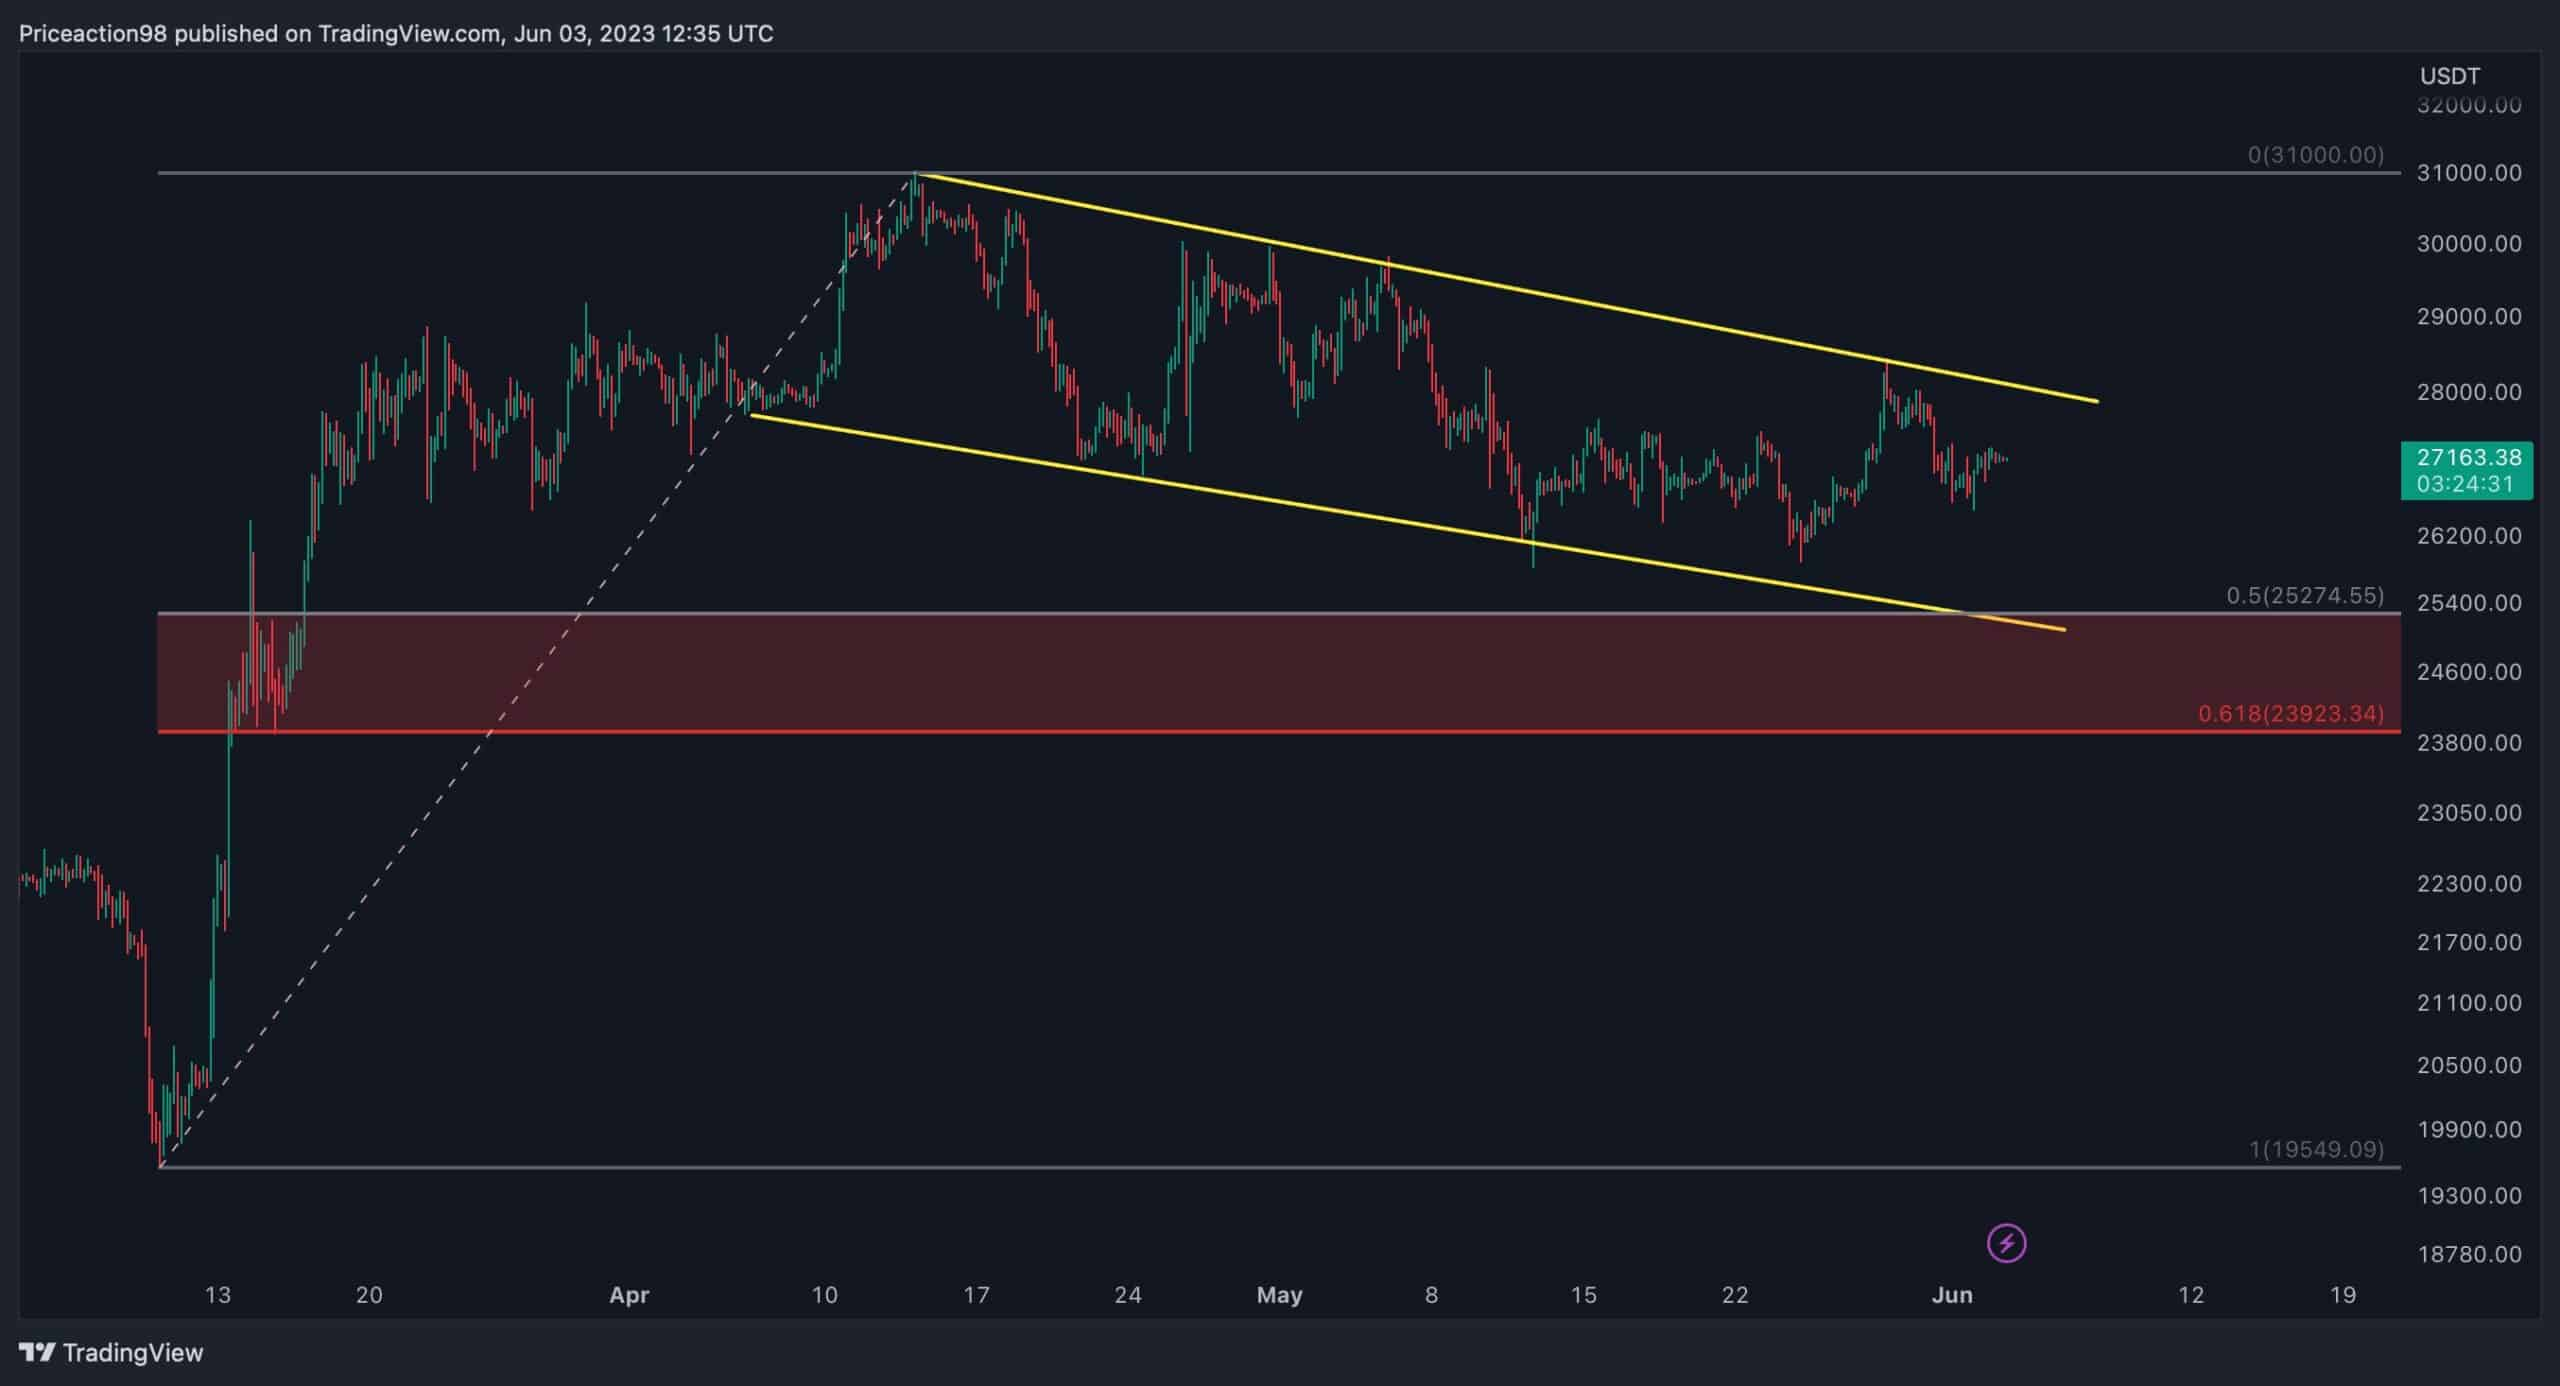
Source: TradingView
The following chart shows the SOPR ratio along with Bitcoin price since the 2015 Bearish. It has consistently signaled long-term investment opportunities, as in the previous two bearish cycles in 2015 and 2019.
This ratio hit its lowest level since 2019, around 0.53, in December 2022, indicating the beginning of a bull phase in the market. It is currently experiencing an uptrend, crossing 1, which coincides with successful bull runs in the crypto market.
While it is uncertain whether the bull market is over, as long as the SOPR ratio remains above 1, buyers are likely to continue to prevail.
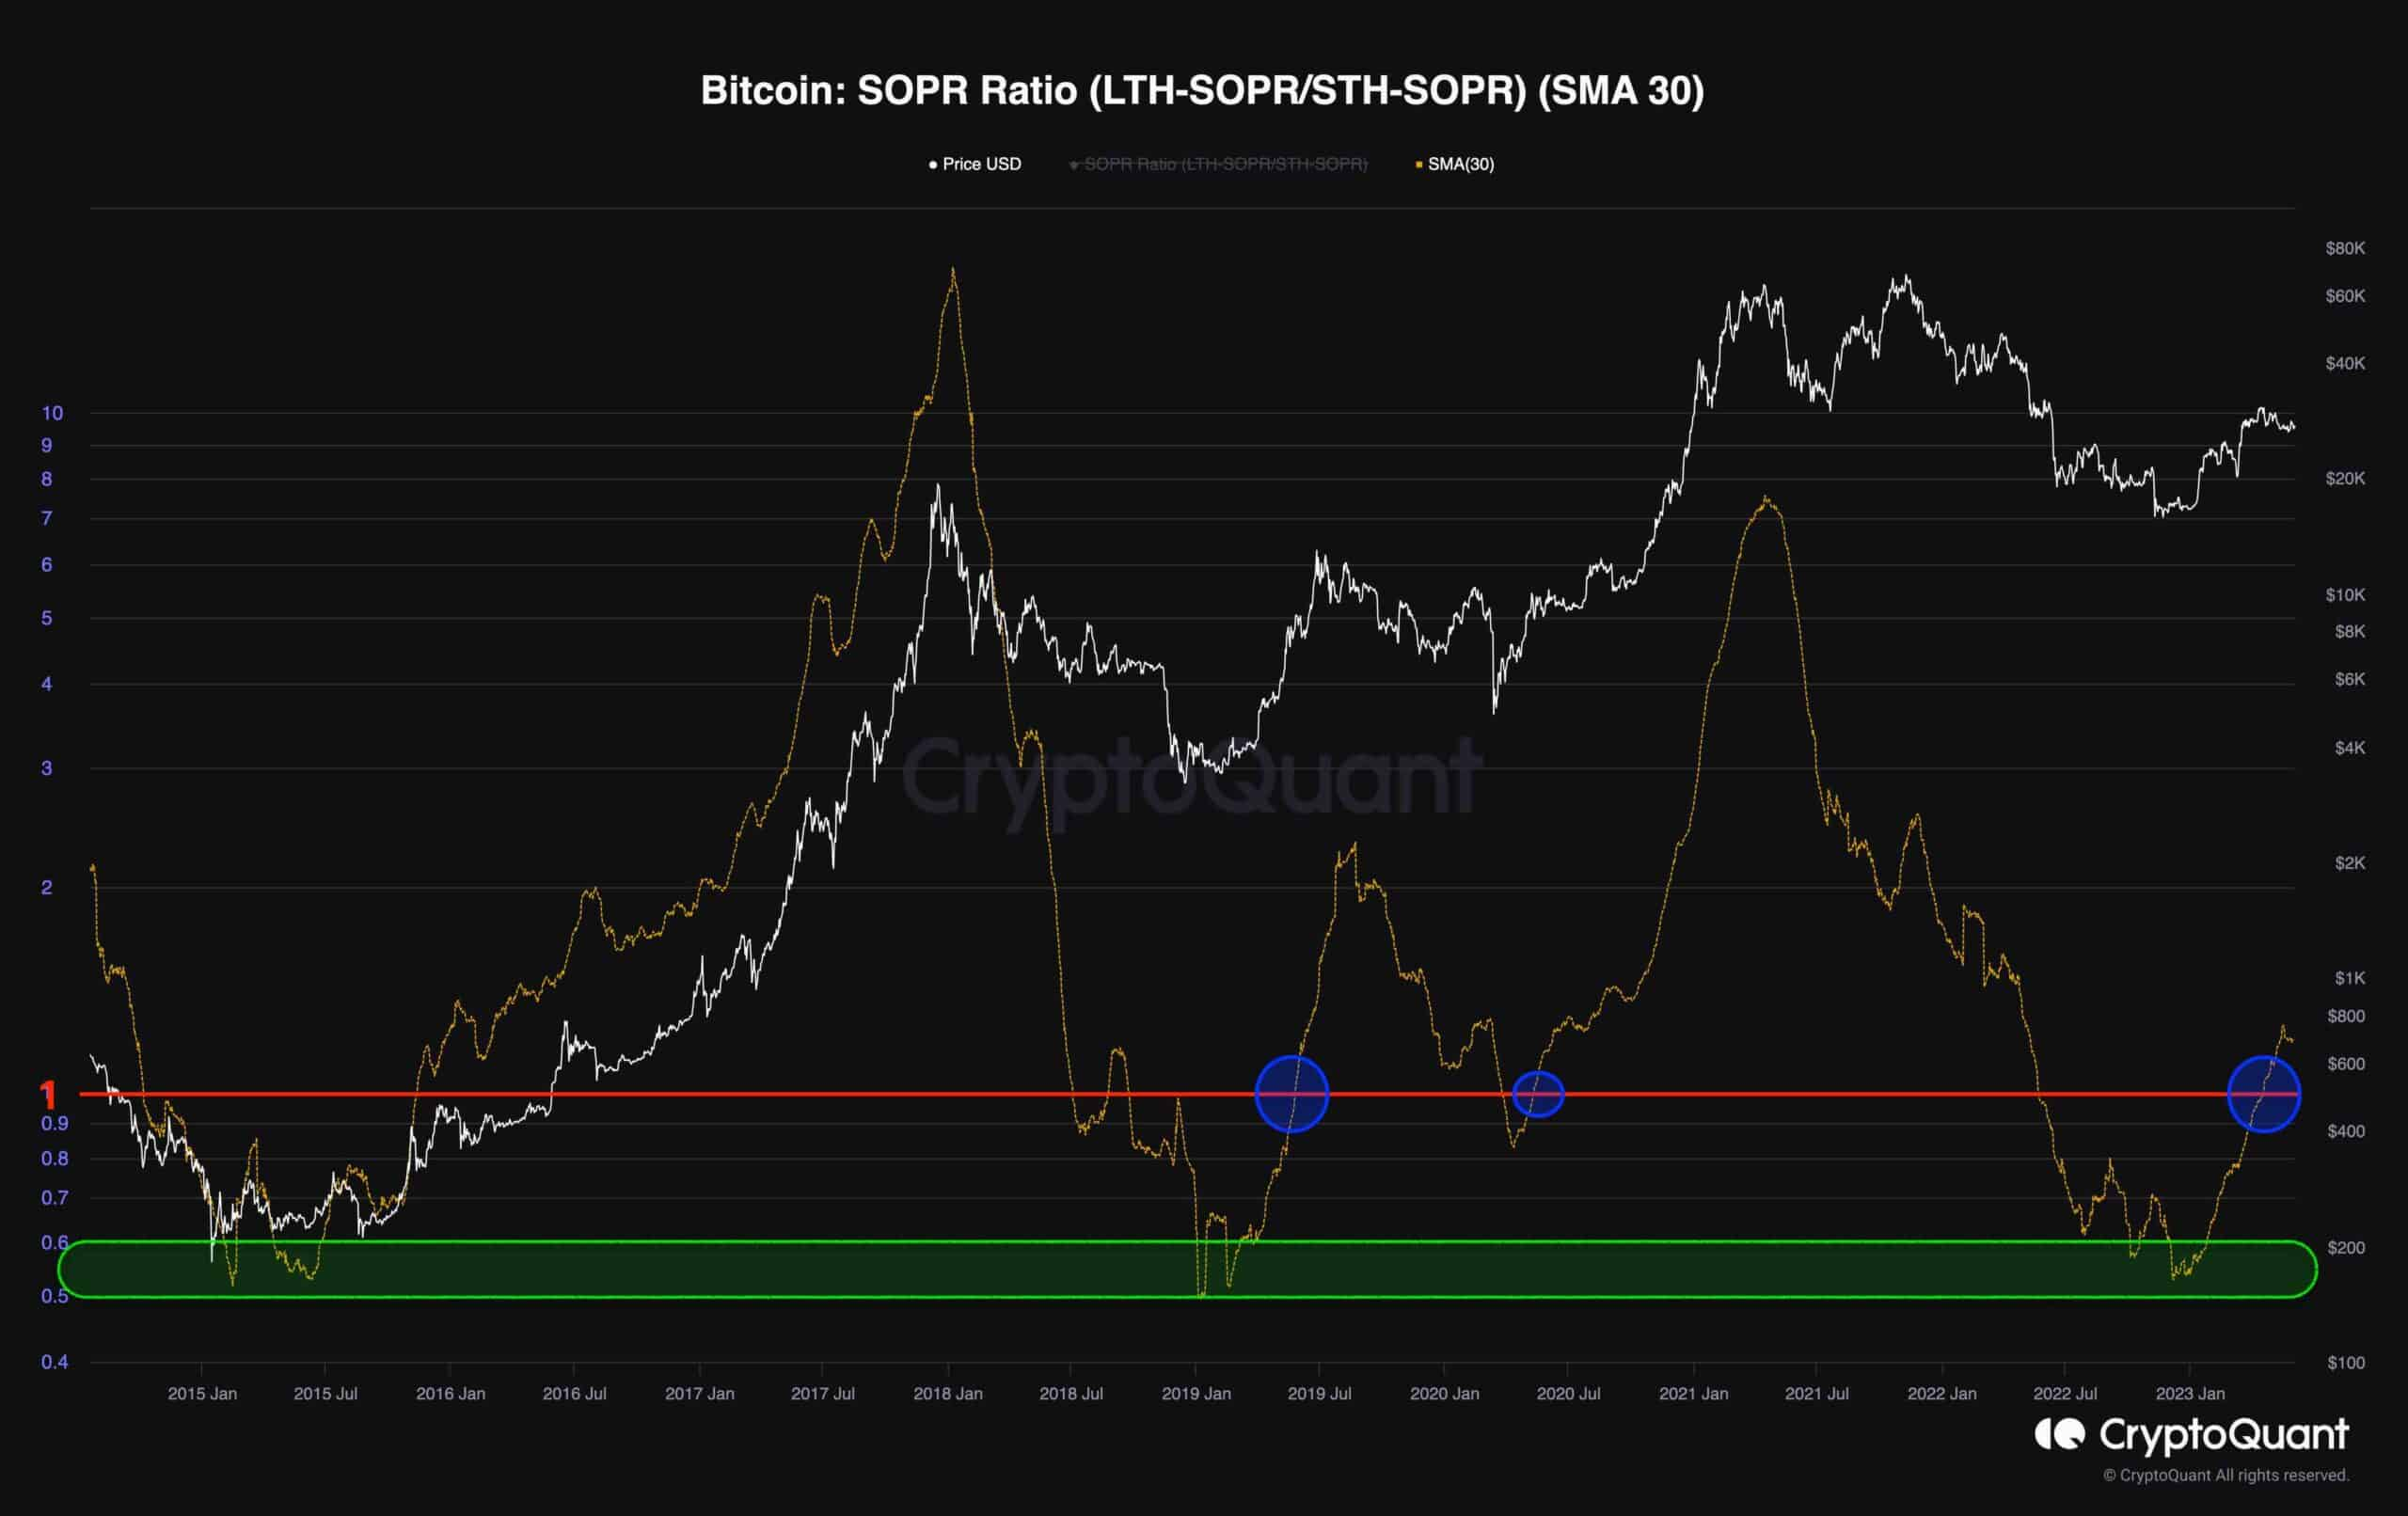
Source: CryptoQuant
Despite BTC closing the first week of June in the red, the Altcoin market is still struggling to maintain slight gains in the short-term.
The most prominent of the day was Terra Classic (LUNC), when the token price jumped more than 20% in just 24 hours. This increase was mainly due to increased buying pressure, pushing LUNC 's market capitalization to $626 million, with over $138 million flowing into the project in just one day.
Other Altcoin such as ApeCoin (Ape), The Sandbox (SAND), Decentraland (MANA), XRP (XRP), Solana (SOL), Cronos (CRO), Fantom (FTM), Ziliqa (ZIL)… increased slightly from 2- 6%.
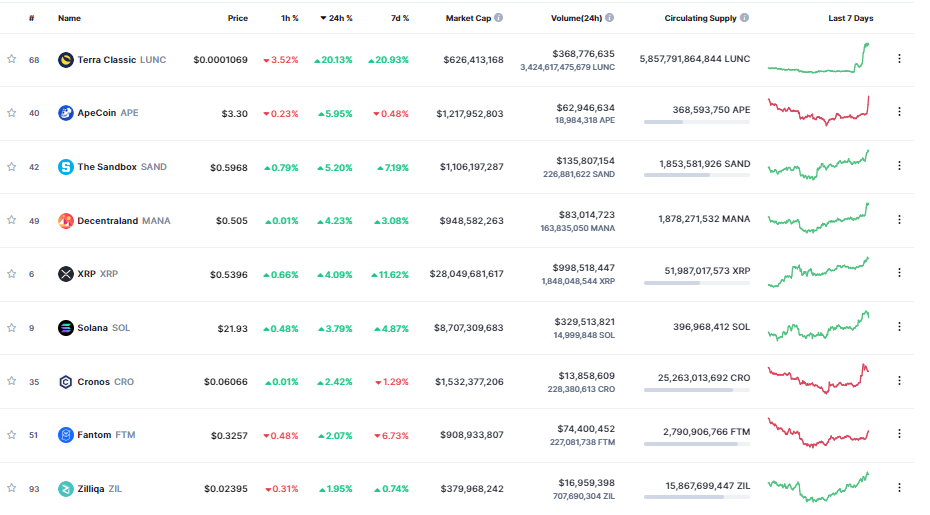
Source: Coinmarketcap
Ethereum (ETH) turned bearish, establishing a local intraday bottom at $1,877 after failing to sustain above $1,900. The project with the second largest market capitalization also ended the week in the red, ending the streak of 2 consecutive weeks of growth since mid-May.
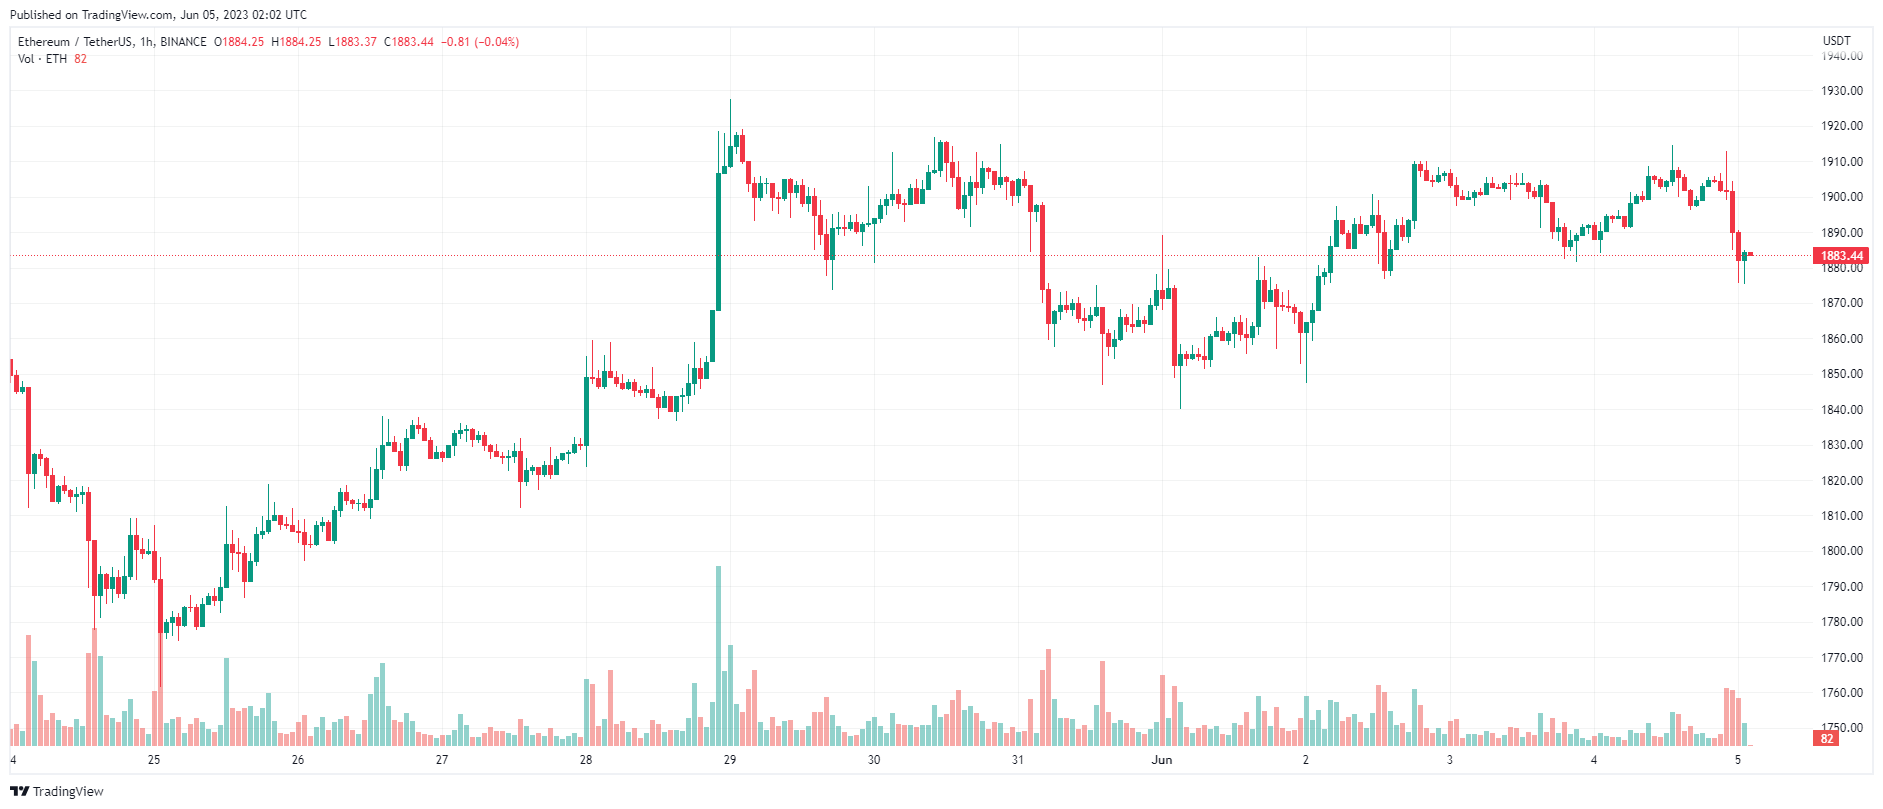
ETH price chart – 1 hour | Source: TradingView