Автор: Artemis
Компиляция: Deep Wave TechFlow
В этом отчете представлен эмпирический анализ использования стабильных монет в платежах, включая транзакции между физическими лицами (P2P), между предприятиями (B2B), а также между физическими лицами и предприятиями (P2B/B2P).
В этом отчете представлен эмпирический анализ использования стабильных монет в платежах, исследуются модели транзакций между физическими лицами (P2P), между предприятиями (B2B), а также между физическими лицами и предприятиями (P2B/B2P). Мы используем набор данных Artemis, который предоставляет метаданные адресов кошельков, включая оценку географического местоположения, метки институциональной принадлежности и идентификаторы смарт-контрактов. Классификация транзакций проводилась на основе характеристик кошельков отправителя и получателя. Анализ сосредоточен на сети Ethereum, на которую приходится около 52% мирового предложения стабильных монет.
Мы в основном изучали две основные стабильные монеты: USDT и USDC, которые вместе занимают 88% рыночной доли. Несмотря на значительный рост внедрения стабильных монет и усиление регуляторного внимания за последний год, ключевой вопрос остается без ответа: как на самом деле выглядит использование стабильных монет в платежах по сравнению с другими видами деятельности? Этот отчет направлен на выявление основных движущих сил внедрения стабильных монет в платежах и предоставление информации для прогнозирования будущих тенденций.
1. Предыстория
В последние годы внедрение стабильных монет значительно выросло, их предложение достигло 2 триллионов долларов, а ежемесячный общий объем переводов в настоящее время превышает 4 триллиона долларов. Хотя блокчейн-сети обеспечивают полную прозрачность записей транзакций и все транзакции могут быть проанализированы, проведение анализа транзакций и пользователей остается весьма сложным из-за анонимности этих сетей и отсутствия информации о цели транзакций (например, внутренние платежи, трансграничные платежи, трейдинг и т.д.).
Кроме того, использование смарт-контрактов и автоматизированных транзакций в таких сетях, как Ethereum, еще больше увеличивает сложность анализа, поскольку одна транзакция может включать взаимодействие с несколькими смарт-контрактами и токенами. Таким образом, ключевой вопрос, который остается нерешенным, заключается в том, как оценить текущее соотношение использования стабильных монет в сфере платежей по сравнению с другими видами деятельности (такими как трейдинг). Хотя многие исследователи прилагают усилия для решения этой сложной проблемы, данный отчет направлен на предоставление дополнительного метода оценки использования стабильных монет, особенно в платежных целях.
В целом, существует два основных подхода к оценке использования стабильных монет, особенно в платежах.
Первый метод — это подход фильтрации (filtering approach), который использует сырые данные блокчейн-транзакций и с помощью методов фильтрации удаляет шум, чтобы получить более точную оценку использования стабильных монет в платежах.
Второй метод — это опрос основных поставщиков платежных услуг с использованием стабильных монет и оценка активности стабильных монет на основе раскрытых ими данных о платежах.
Visa совместно с Allium Labs разработала панель аналитики Visa Onchain Analytics Dashboard, в которой используется первый метод. Они используют методы фильтрации для уменьшения шума в исходных данных, предоставляя более четкую информацию об активности стабильных монет. Исследования показывают, что после фильтрации исходных данных общий ежемесячный объем транзакций со стабильными монетами снизился примерно с 5 триллионов долларов (общий объем транзакций) до 1 триллиона долларов (скорректированный объем). Если рассматривать только розничных объем (транзакции на сумму менее 250 долларов), объем транзакций составляет всего 6 миллиардов долларов. Мы использовали метод фильтрации, аналогичный Visa Onchain Analytics Dashboard, но наш подход более сфокусирован на явном обозначении транзакций как платежных.
Второй метод, основанный на данных опросов компаний, был применен в «Отчете Fireblocks о состоянии стабильных монет за 2025 год» и «Отчете о платежах стабильными монетами с нуля». Оба отчета используют информацию, раскрытую основными компаниями на рынке блокчейн-платежей, для оценки прямого использования стабильных монет в платежах. В частности, «Отчет о платежах стабильными монетами с нуля» предоставляет общую оценку объема платежных транзакций стабильными монетами и делит эти платежи на категории, такие как B2B (бизнес для бизнеса), B2C (бизнес для потребителя), P2P (физическое лицо для физического лица) и другие. Согласно отчету, по состоянию на февраль 2025 года общий годовой объем расчетов составил около 72,3 миллиарда долларов, причем большая часть пришлась на B2B-транзакции.
Основной вклад данного исследования заключается в применении метода фильтрации данных для оценки использования стабильных монет в ончейн-платежах. Результаты исследования проливают свет на использование стабильных монет и предоставляют более точные оценки. Кроме того, мы предоставляем исследователям руководство по использованию методов фильтрации данных для обработки сырых данных блокчейна, снижения шума и улучшения оценок.
2. Данные
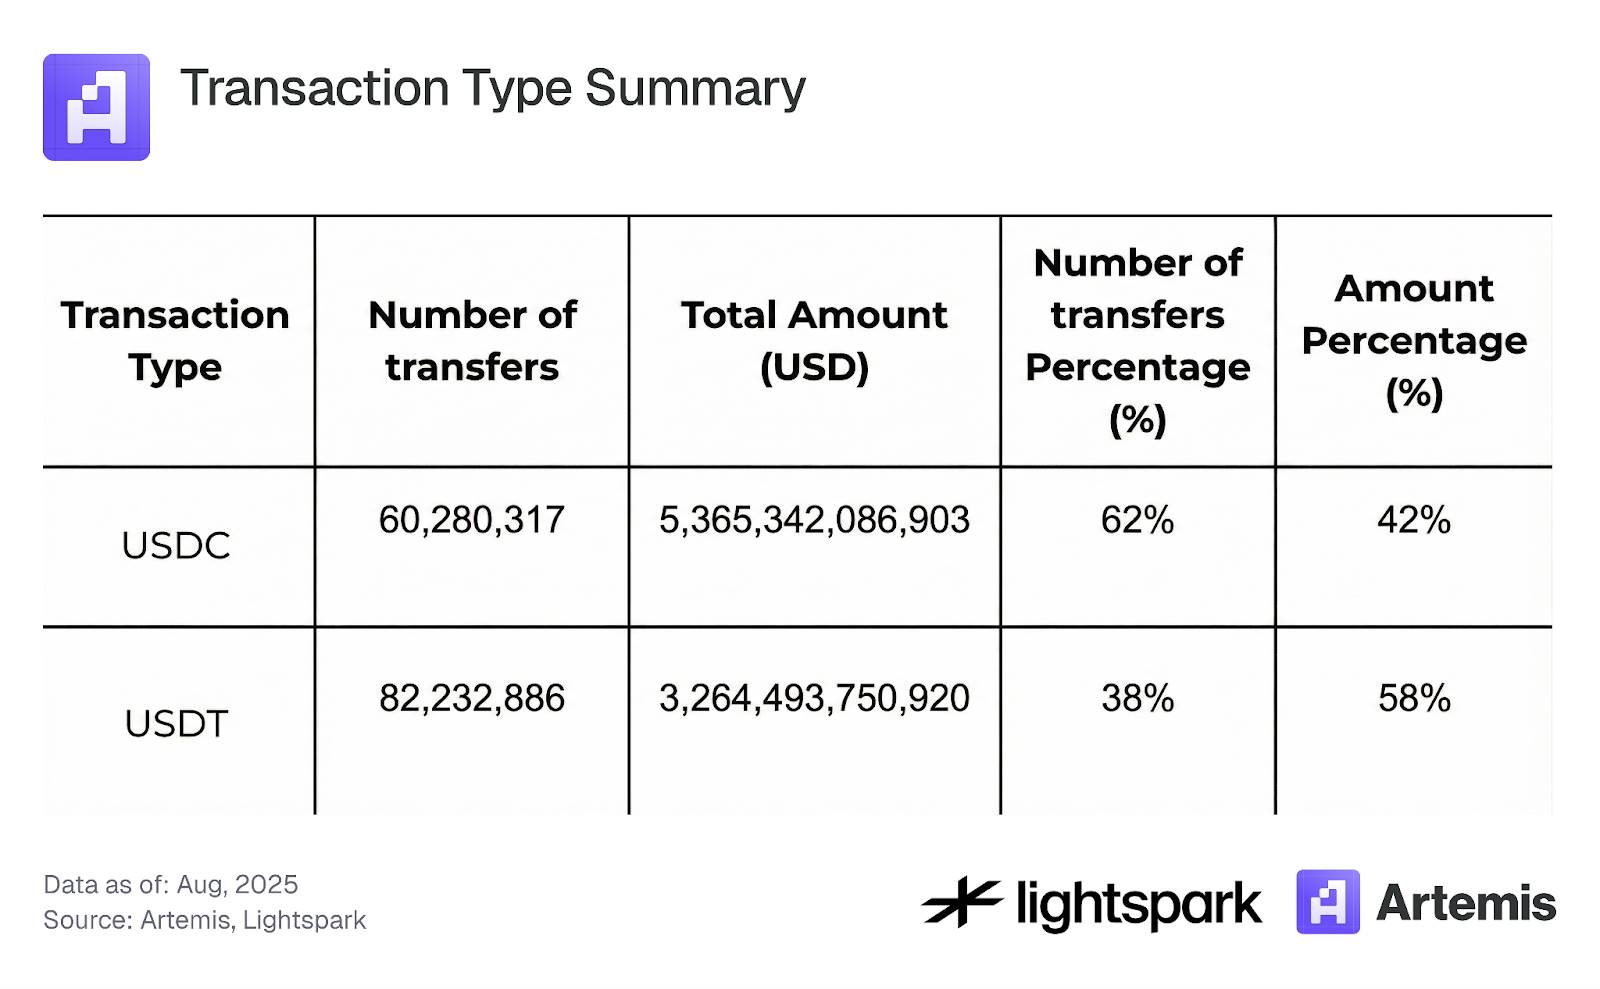
Наш набор данных охватывает все транзакции со стабильными монетами в блокчейне Ethereum в период с августа 2024 года по август 2025 года. Анализ сосредоточен на транзакциях с двумя основными стабильными монетами: USDC и USDT. Выбор этих двух монет обусловлен их высокой долей рынка и сильной ценовой стабильностью, что снижает шум в процессе анализа. Мы рассматриваем только транзакции перевода, исключая транзакции чеканки (mint), сжигания (burn) или мостов (bridge). В таблице 1 обобщена общая картина набора данных, использованного в нашем анализе.
Таблица 1: Сводка по типам транзакций
3. Методология и результаты
В этом разделе мы подробно описываем методологию, используемую для анализа использования стабильных монет, с акцентом на платежные транзакции. Сначала мы фильтруем данные, различая транзакции, связанные с взаимодействием со смарт-контрактами, и транзакции, представляющие переводы между EOA (внешними аккаунтами), и классифицируем последние как платежные транзакции. Этот процесс описан в разделе 3.1. Затем в разделе 3.2 объясняется, как использовать данные меток аккаунтов EOA, предоставленные Artemis, для дальнейшей категоризации платежных транзакций на P2P, B2B, B2P, P2B и внутренние B-транзакции. Наконец, в разделе 3.3 анализируется концентрация транзакций со стабильными монетами.
3.1 Платежи стабильными монетами (EOA) vs Транзакции со смарт-контрактами
В области децентрализованных финансов (DeFi) многие транзакции связаны с взаимодействием со смарт-контрактами и объединяют несколько финансовых операций в одной транзакции, например, обмен одного токена на другой через несколько пулов ликвидности. Эта сложность затрудняет анализ использования стабильных монет исключительно для платежных целей.
Чтобы упростить анализ и повысить способность маркировки транзакций блокчейна со стабильными монетами как платежных, мы определяем платеж стабильной монетой как любую транзакцию перевода ERC-20 стабильной монеты с одного адреса EOA на другой адрес EOA (исключая транзакции чеканки и сжигания). Любая транзакция, не помеченная как платеж, классифицируется как транзакция со смарт-контрактом, включая все транзакции, связанные с взаимодействием со смарт-контрактами (например, в основном транзакции DeFi).
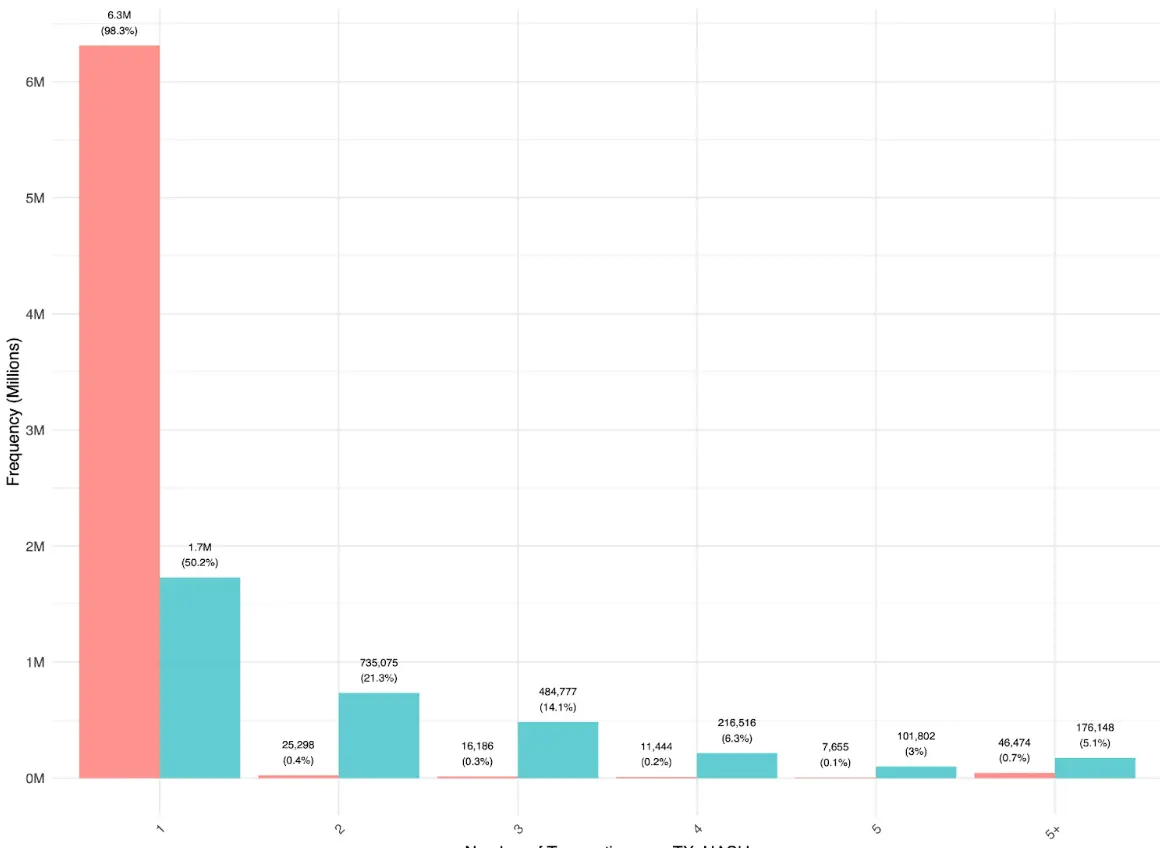
На Рисунке 1 показано, что большинство платежей между пользователями (EOA-EOA) выполняются напрямую, причем каждый хэш транзакции соответствует одному переводу. Некоторые множественные переводы EOA-EOA в рамках одного хэша транзакции в основном выполняются через агрегаторы, что указывает на то, что использование агрегаторов для простых переводов все еще невелико. Напротив, распределение транзакций со смарт-контрактами отличается, поскольку они содержат больше множественных переводов. Это говорит о том, что в операциях DeFi стабильные монеты часто перемещаются между различными приложениями и маршрутизаторами, в конечном итоге возвращаясь на аккаунты EOA.
Рисунок 1:
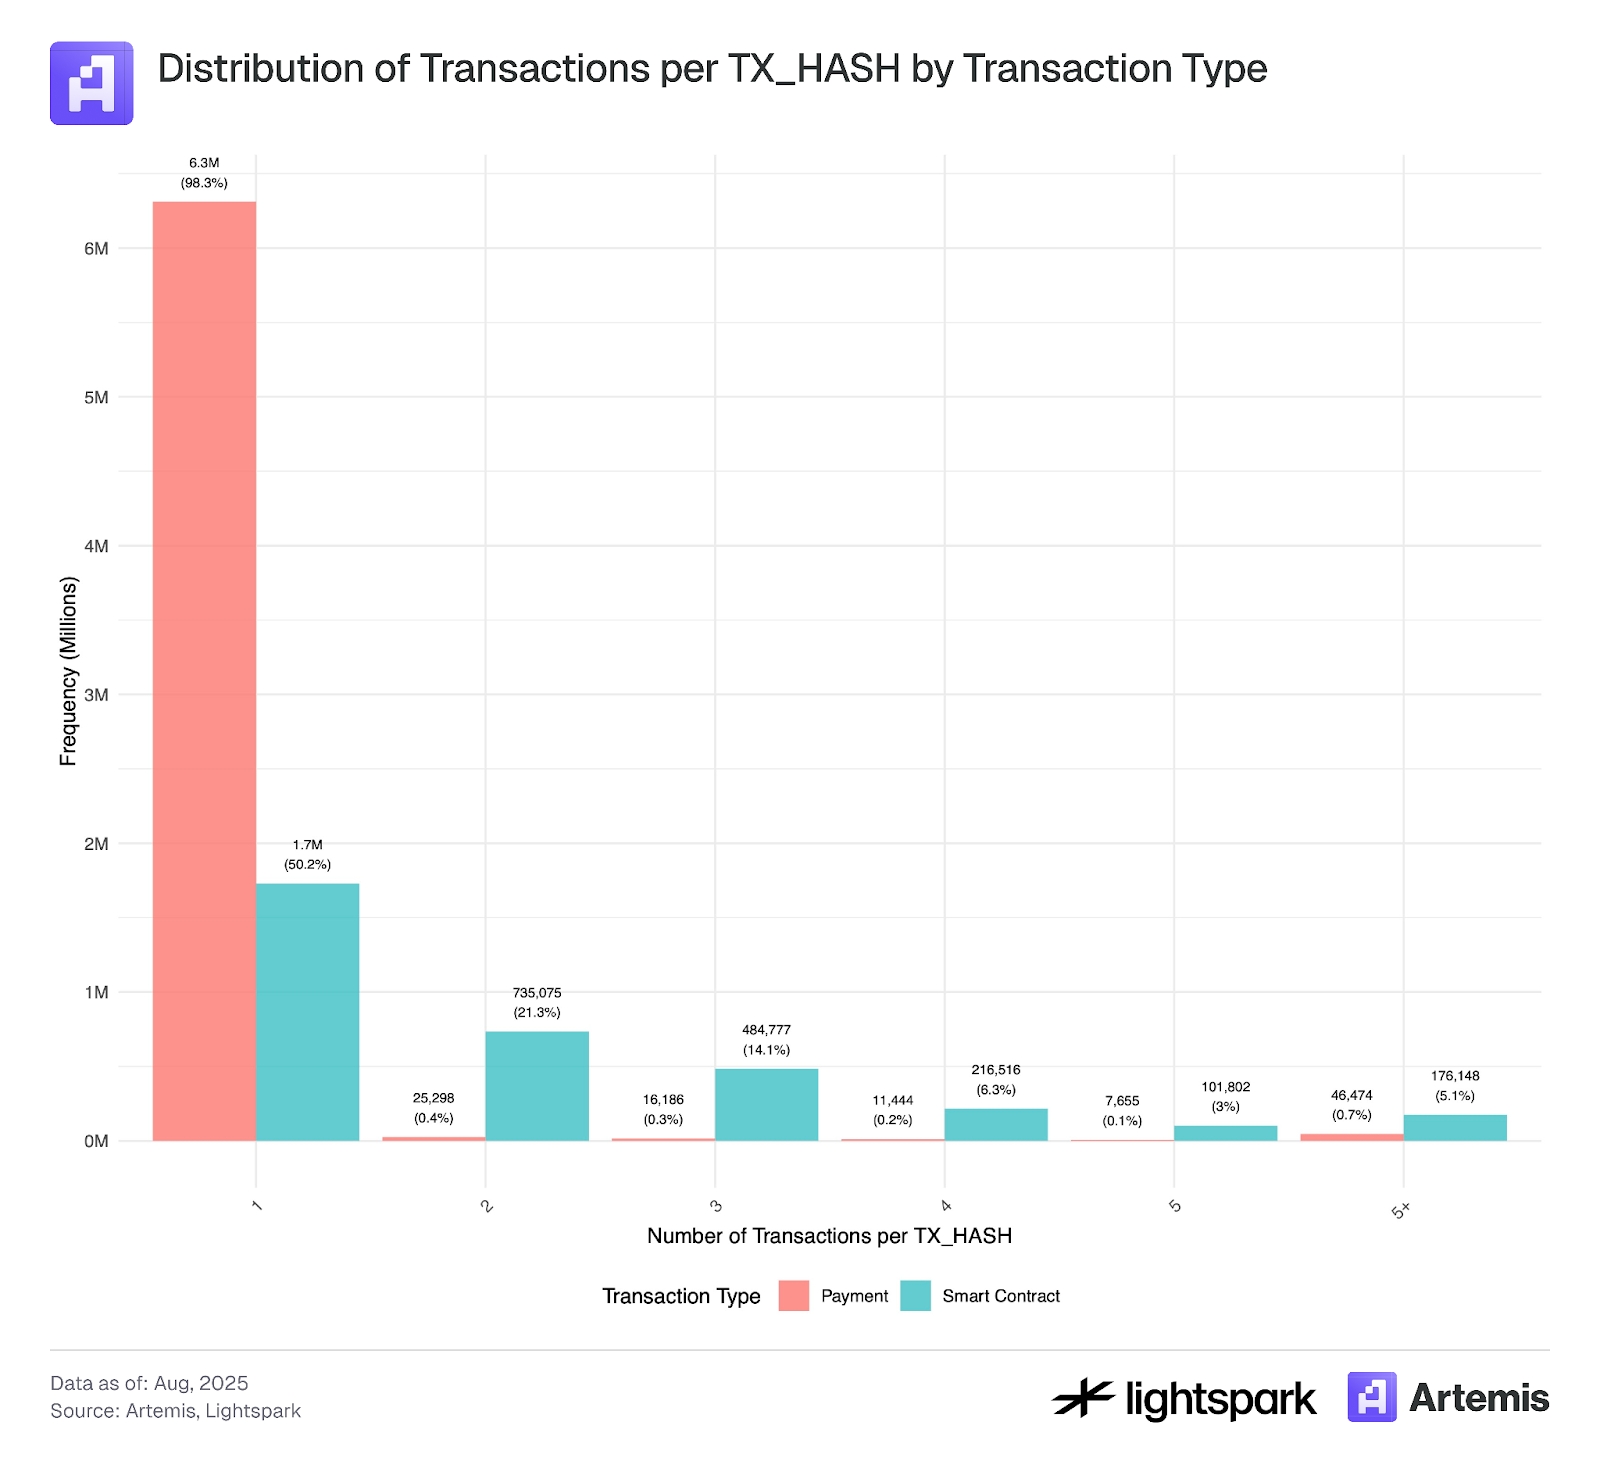
*Данные для этого анализа охватывают период с 4 июля 2025 года по 31 июля 2025 года.
Таблица 2 и Рисунок 2 показывают, что с точки зрения количества транзакций соотношение платежей (EOA-EOA) и транзакций со смарт-контрактами (DeFi) составляет примерно 50:50, при этом на транзакции со смарт-контрактами приходится 53,2% объема. Однако Рисунок 2 показывает, что объем транзакций (общая сумма переводов) более волатилен, чем количество транзакций, что позволяет предположить, что эти колебания вызваны в основном крупными переводами EOA-EOA от институциональных игроков.
Таблица 2: Сводка по типам транзакций
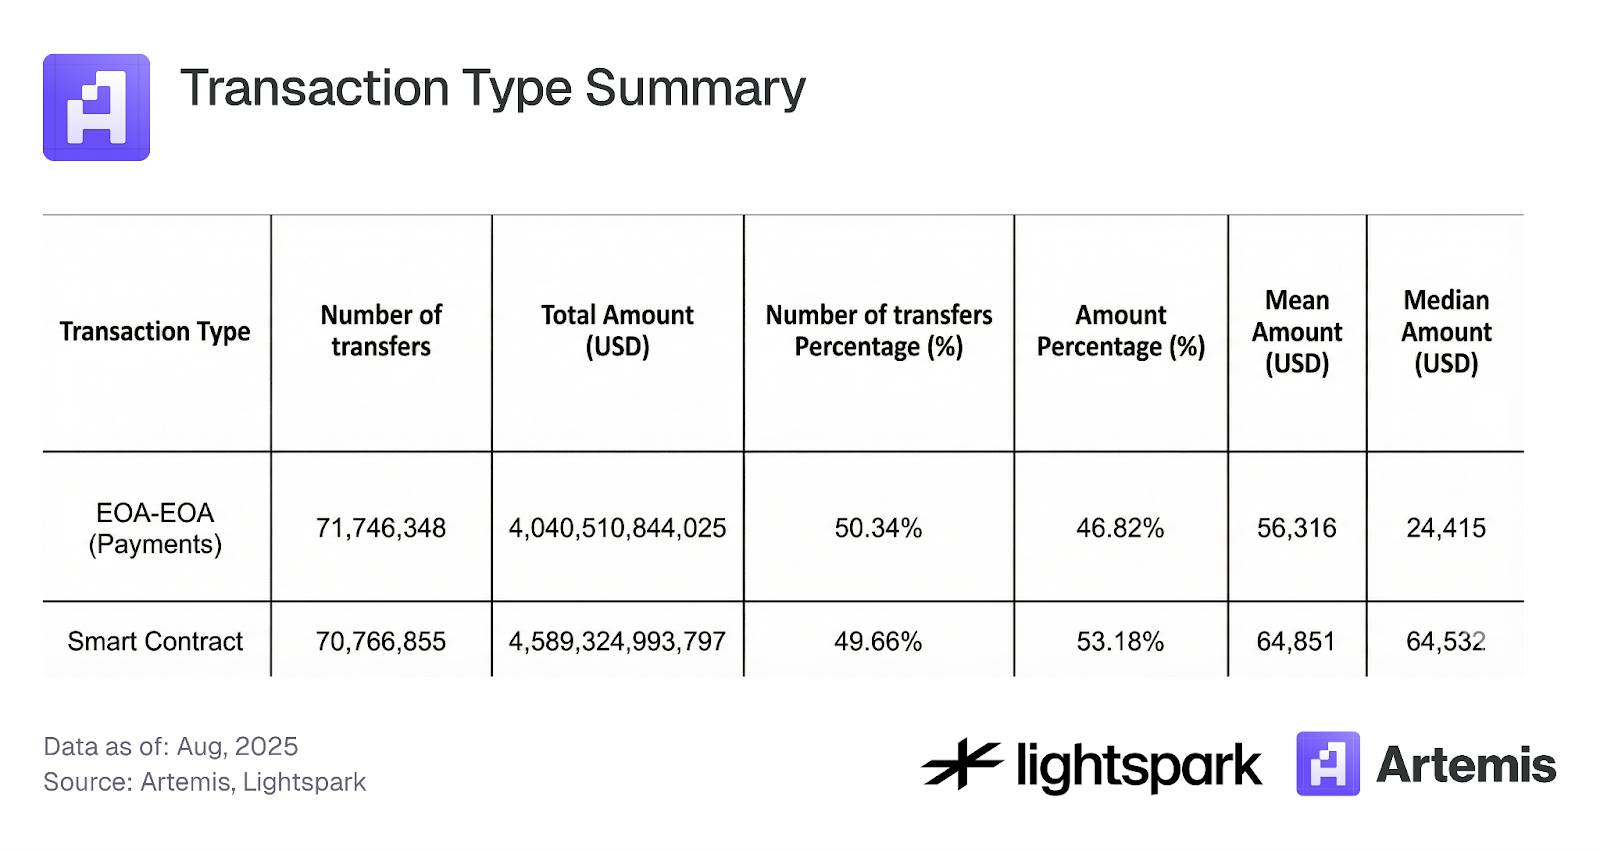
Рисунок 2:
На Рисунке 3 исследуется распределение сумм транзакций для платежей (EOA-EOA) и транзакций со смарт-контрактами. Распределение сумм как для платежных транзакций, так и для транзакций со смарт-контрактами напоминает нормальное распределение с тяжелыми хвостами, со средним значением около 100 до 1000 долларов.
Однако наблюдается значительный пик для транзакций на сумму менее 0,1 доллара, что может указывать на активность ботов или манипулирование транзакциями, связанное с поддельными транзакциями и накруткой объема (wash trading), как описано Halaburda et al. (2025) и Cong et al. (2023).
Поскольку комиссия за газ в Ethereum обычно превышает 0,1 доллара, транзакции ниже этого порога требуют дальнейшей тщательной проверки и, возможно, исключения из анализа.
Рисунок 3:
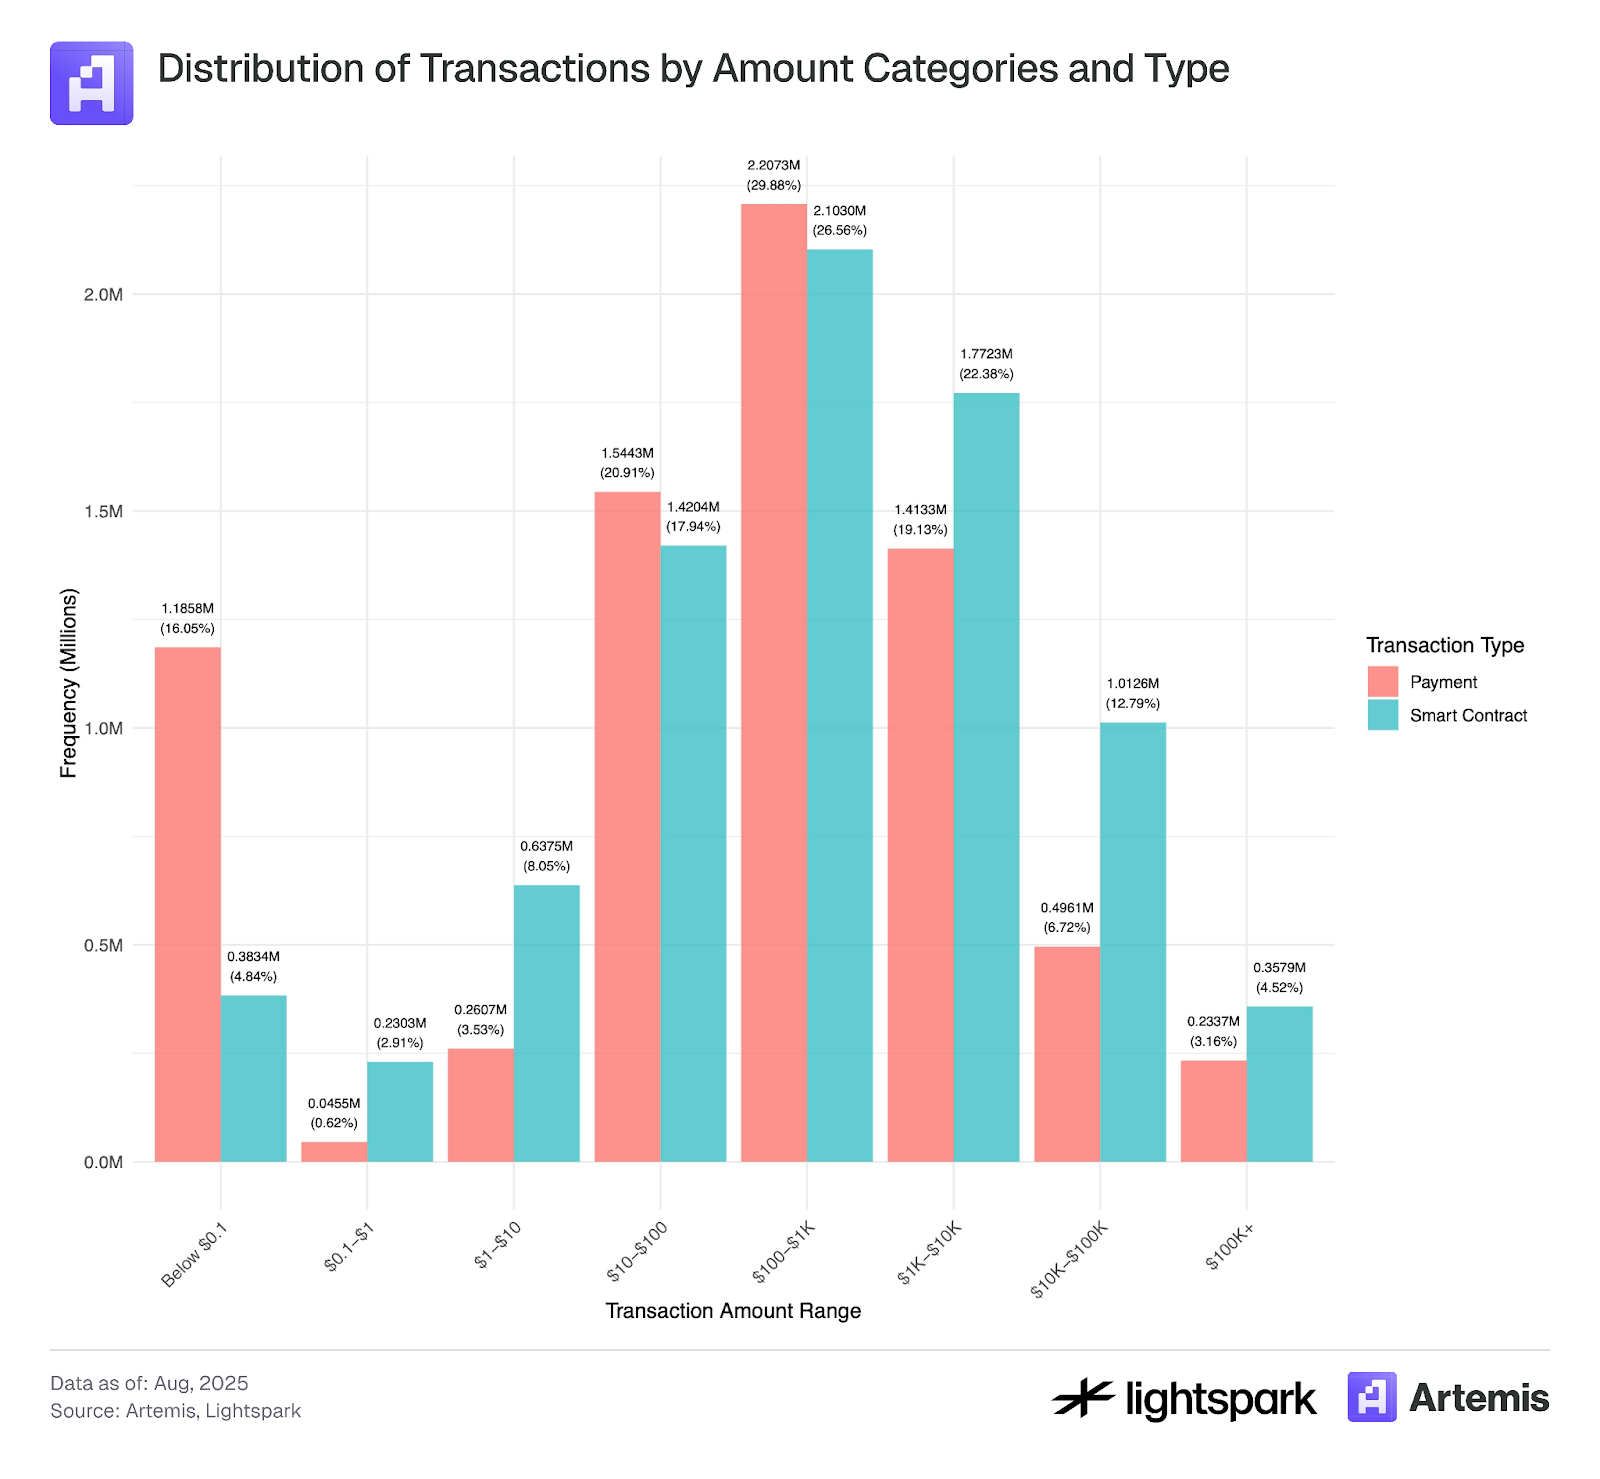
Данные для этого анализа охватывают период с 4 июля 2025 года по 31 июля 2025 года.
3.2 Типы платежей
Используя информацию о метках, предоставленную Artemis, можно провести дальнейший анализ платежей между двумя EOA (внешними аккаунтами). Artemis предоставляет информацию о метках для многих адресов кошельков Ethereum, позволяя идентифицировать кошельки, принадлежащие институциональным организациям (например, Coinbase). Мы разделили платежные транзакции на пять категорий: P2P, B2B, B2P, P2B и внутренние B-транзакции. Ниже приведено подробное описание каждой категории.
P2P-платежи:
P2P (от человека к человеку) блокчейн-платежи — это транзакции по переводу средств напрямую от одного пользователя к другому через блокчейн-сеть. В блокчейнах на основе аккаунтов, таких как Ethereum, такие P2P-транзакции определяются как процесс передачи цифровых активов из кошелька одного пользователя (аккаунт EOA) в кошелек EOA другого пользователя. Все транзакции записываются и проверяются в блокчейне без участия посредников.
Основные проблемы:
Основная проблема заключается в том, чтобы определить, происходит ли транзакция между двумя кошельками в аккаунтной системе действительно между двумя независимыми субъектами (т.е. физическими лицами, а не компаниями), и правильно классифицировать ее как P2P-транзакцию. Например, переводы пользователя между своими собственными аккаунтами (т.е. сибульные аккаунты) не должны учитываться как P2P-транзакции. Однако, если мы просто определим все транзакции между EOA (внешними аккаунтами) как P2P-транзакции, то такие переводы могут быть ошибочно классифицированы как P2P.
Другая проблема возникает, когда EOA-аккаунт принадлежит компании, например, централизованной бирже (CEX, такой как Coinbase) — такой EOA-кошелек фактически не принадлежит реальному физическому лицу. В нашем наборе данных мы можем добавить метки для многих институциональных и корпоративных EOA-кошельков; однако, поскольку информация о метках не является полной, некоторые EOA-кошельки, принадлежащие компаниям, но не зарегистрированные в нашем наборе данных, могут быть ошибочно помечены как личные кошельки.
Наконец, этот метод не улавливает блокчейн-P2P платежи, осуществляемые через посредников — также известные как модель «сэндвича стабильных монет». В этой модели средства передаются между пользователями через посредников, использующих блокчейн для расчетов. Конкретно, фиатные средства сначала отправляются посреднику, который конвертирует их в криптовалюту, затем средства переводятся через блокчейн-сеть, и, наконец, посредник получателя (который может быть тем же или другим) конвертирует их обратно в фиат. Блокчейн-перевод является «средним слоем» «сэндвича», а конвертация фиата составляет «внешние слои». Основная проблема идентификации этих транзакций заключается в том, что они выполняются посредниками, которые могут объединять несколько транзакций в одну для уменьшения комиссии за газ. Таким образом, некоторые ключевые данные (такие как точная сумма транзакции и количество вовлеченных пользователей) доступны только на платформе посредника.
B2B-платежи:
Транзакции между предприятиями (B2B) — это электронные переводы от одного предприятия к другому через блокчейн-сеть. В нашем наборе данных платежи стабильными монетами — это переводы между двумя известными институциональными EOA-кошельками, например, от Coinbase к Binance.
Внутренние B-платежи:
Транзакции между двумя EOA-кошельками одного и того же учреждения помечаются как внутренние B-транзакции.
P2B (или B2P) платежи:
Транзакции между физическим лицом и предприятием (P2B) или между предприятием и физическим лицом (B2P) — это электронные переводы между физическим лицом и предприятием, транзакции могут быть двунаправленными.
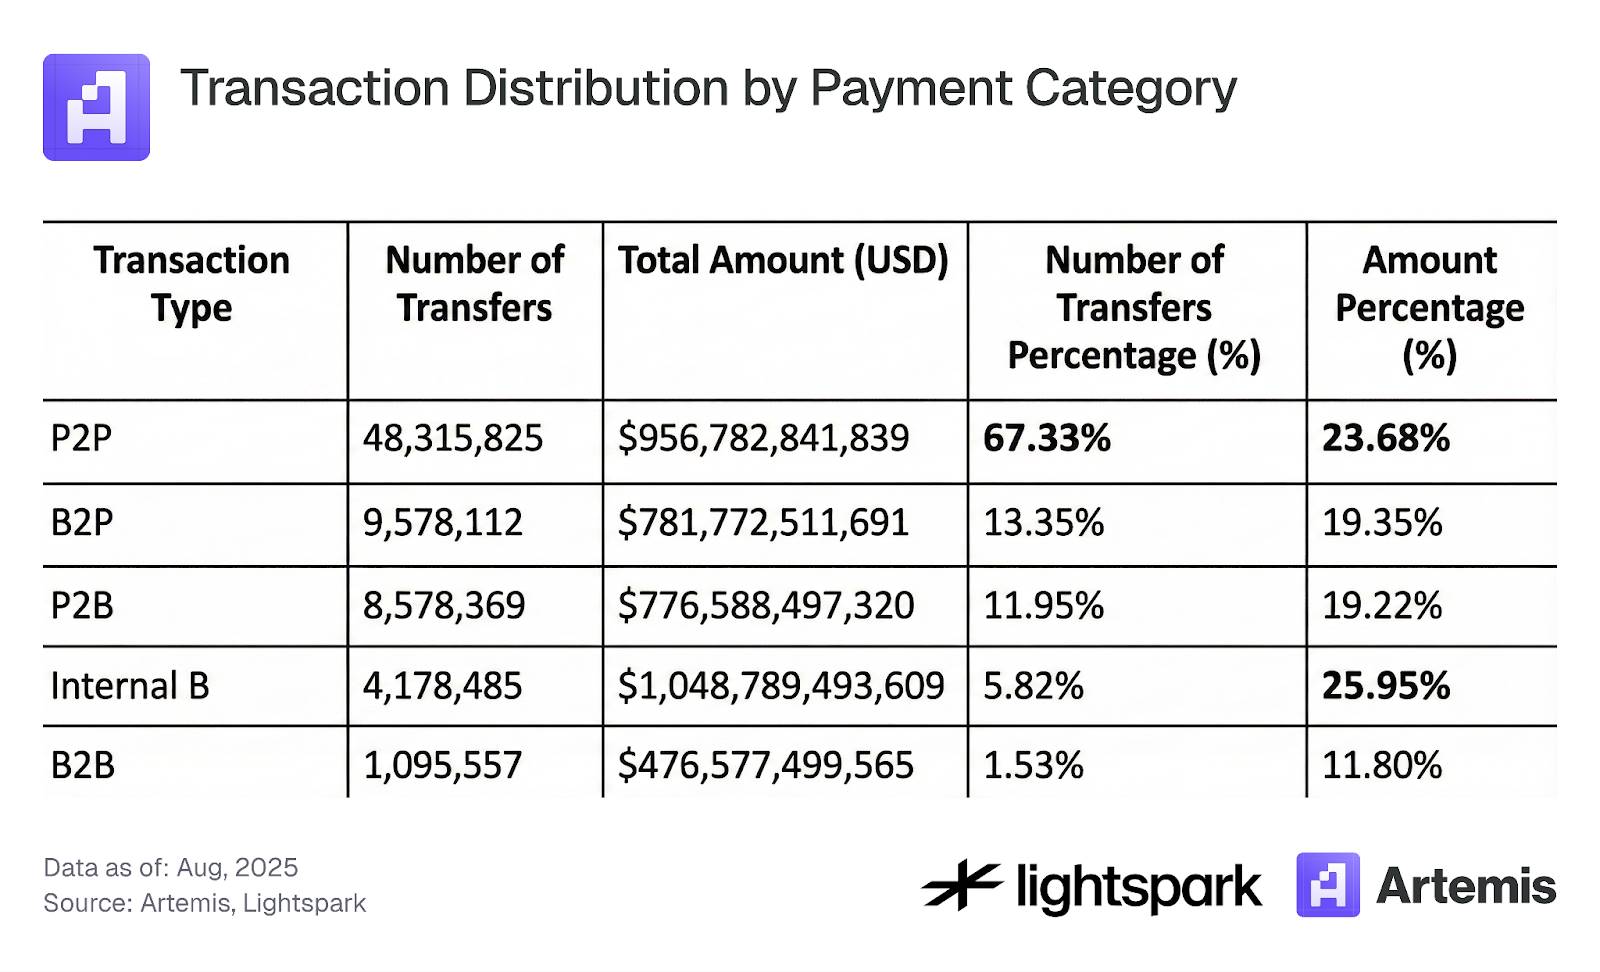
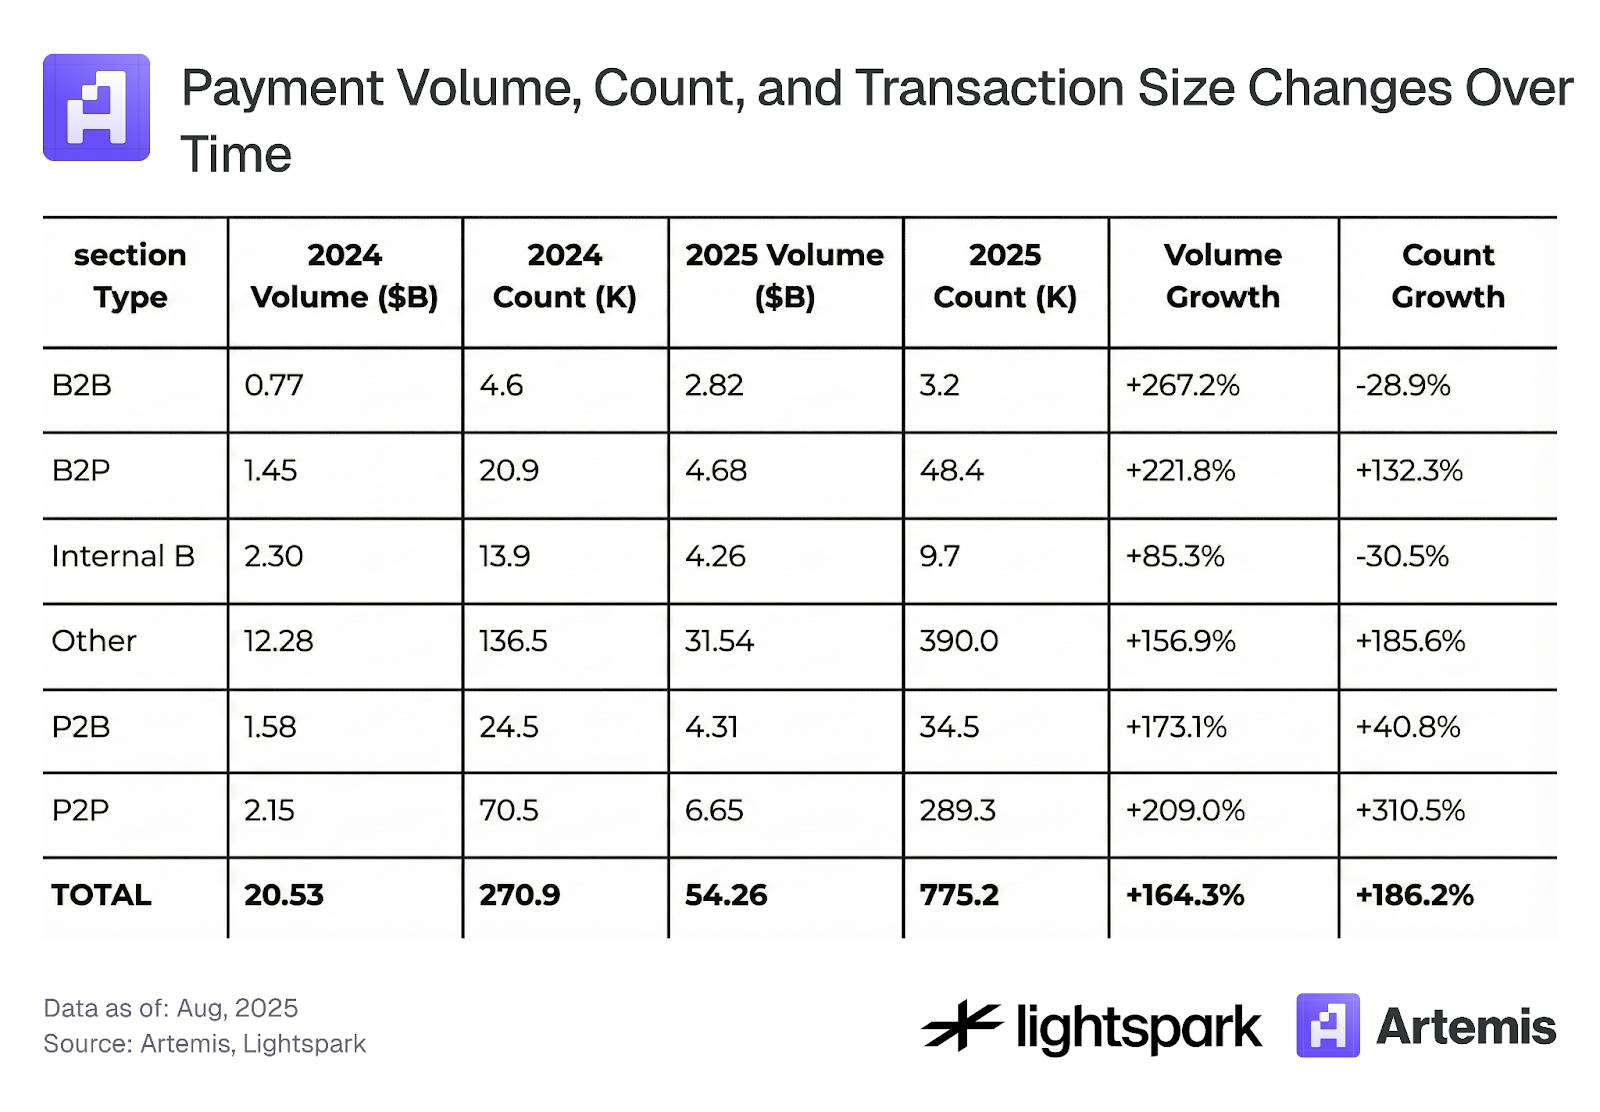
Используя этот метод маркировки, мы проанализировали данные о платежах (только переводы EOA-EOA), основные результаты обобщены в Таблице 3. Данные показывают, что 67% транзакций EOA-EOA относятся к типу P2P, но на их долю приходится только 24% от общего объема платежей. Этот результат дополнительно свидетельствует о том, что пользователи P2P переводят меньшие суммы по сравнению с институциональными игроками. Кроме того, одной из категорий с наибольшим объемом платежных транзакций являются внутренние B-транзакции, что означает, что переводы внутри одной организации составляют значительную долю. Изучение того, что именно представляют собой внутренние B-транзакции и как их учитывать в анализе платежной активности, остается интересным вопросом для исследований.
Таблица 3: Распределение транзакций по платежным категориям
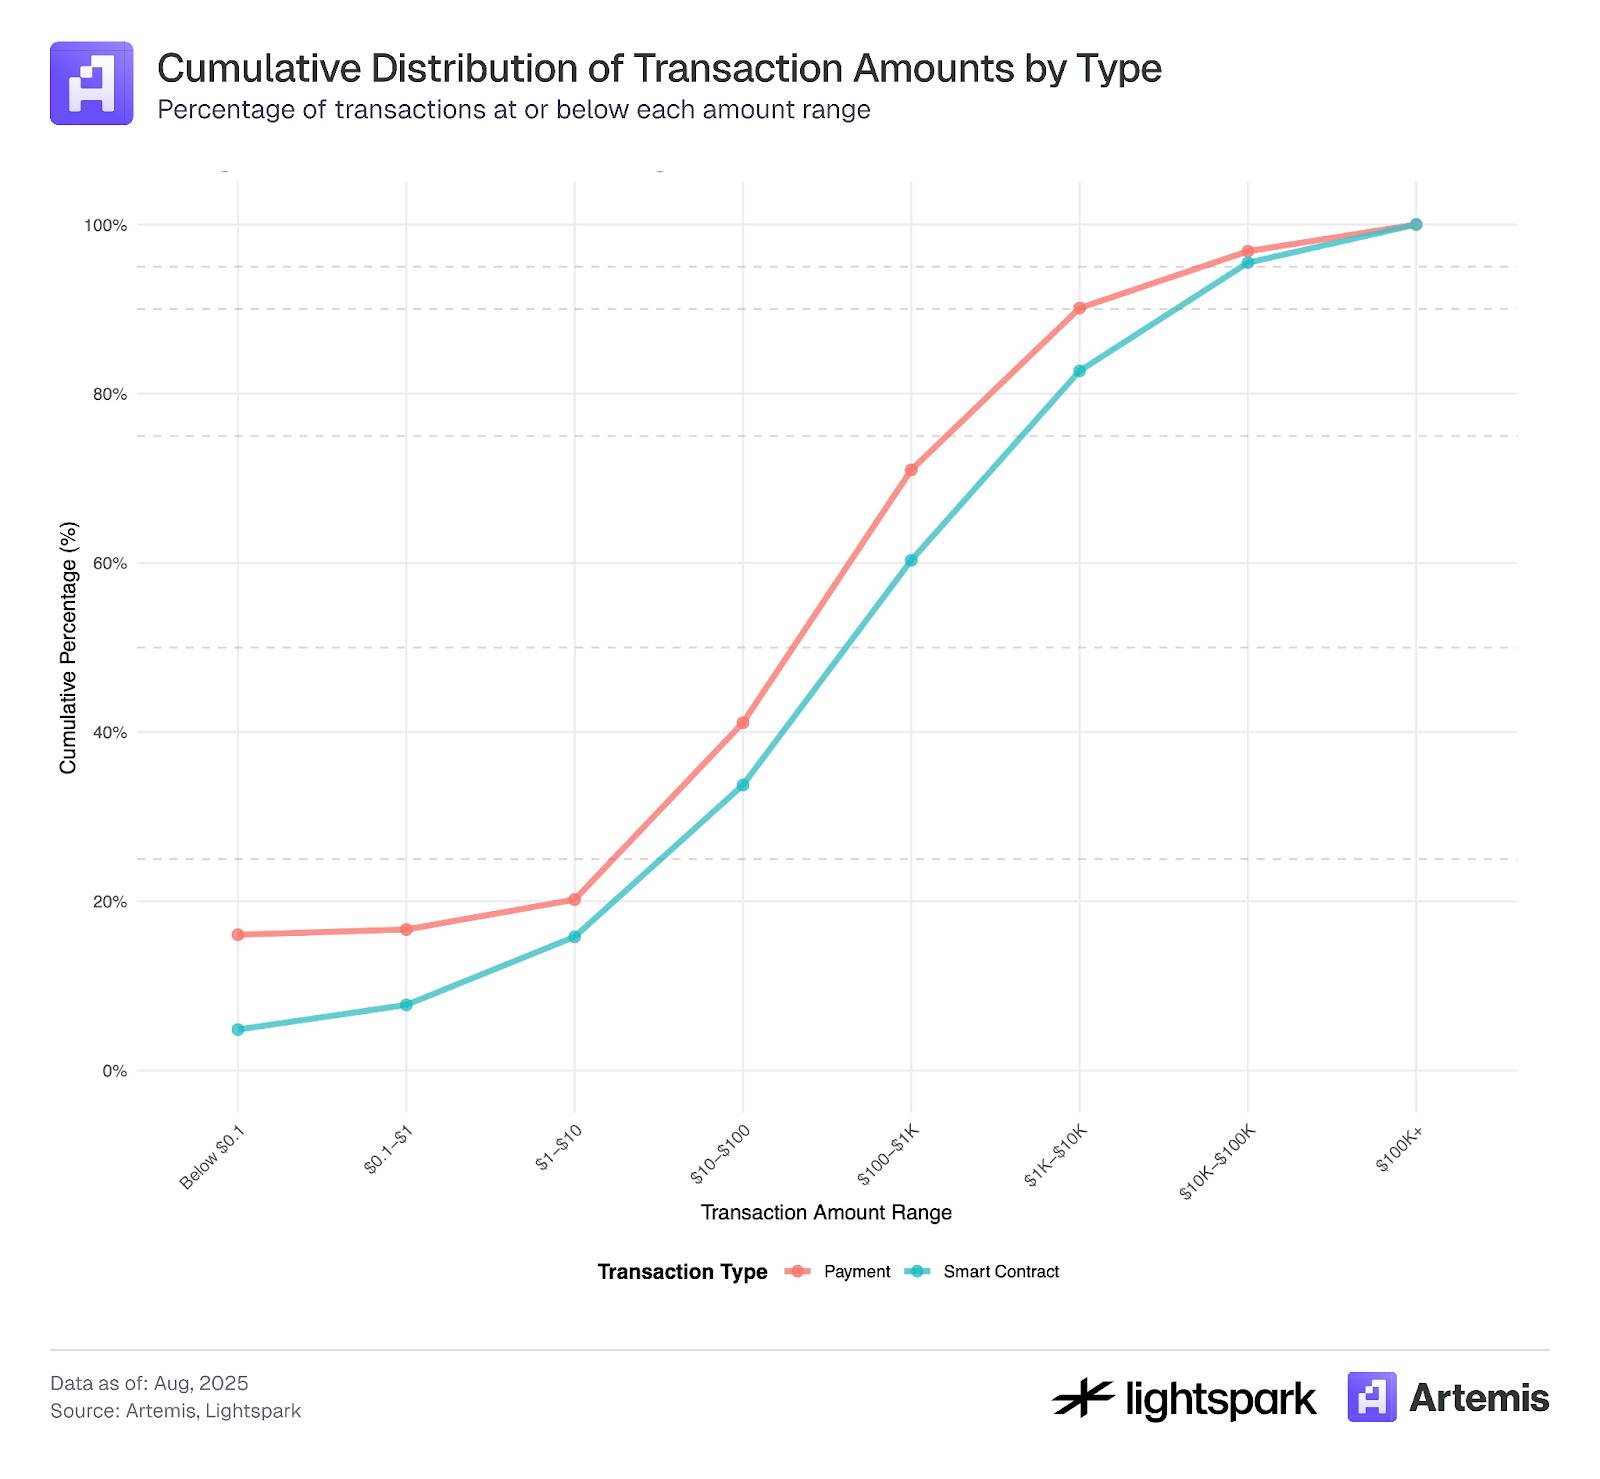
Наконец, на Рисунке 4 показана кумулятивная функция распределения (CDF) сумм транзакций для каждой платежной категории. Из CDF четко видно, что существуют явные различия в распределении сумм транзакций по разным категориям. Большинство транзакций на сумму менее 0,1 доллара в аккаунтах EOA-EOA относятся к типу P2P, что дополнительно доказывает, что эти транзакции, скорее всего, в большей степени driven ботами и управляемыми кошельками, а не инициированы институциональными организациями, помеченными в нашем наборе данных. Кроме того, CDF для P2P-транзакций дополнительно подтверждает, что большинство транзакций имеют небольшие суммы, в то время как транзакции, помеченные как B2B и внутренние B, согласно их CDF, показывают значительно более высокие суммы транзакций. Наконец, CDF для транзакций P2B и B2P находятся между P2P и B2B.
Рисунок 4:
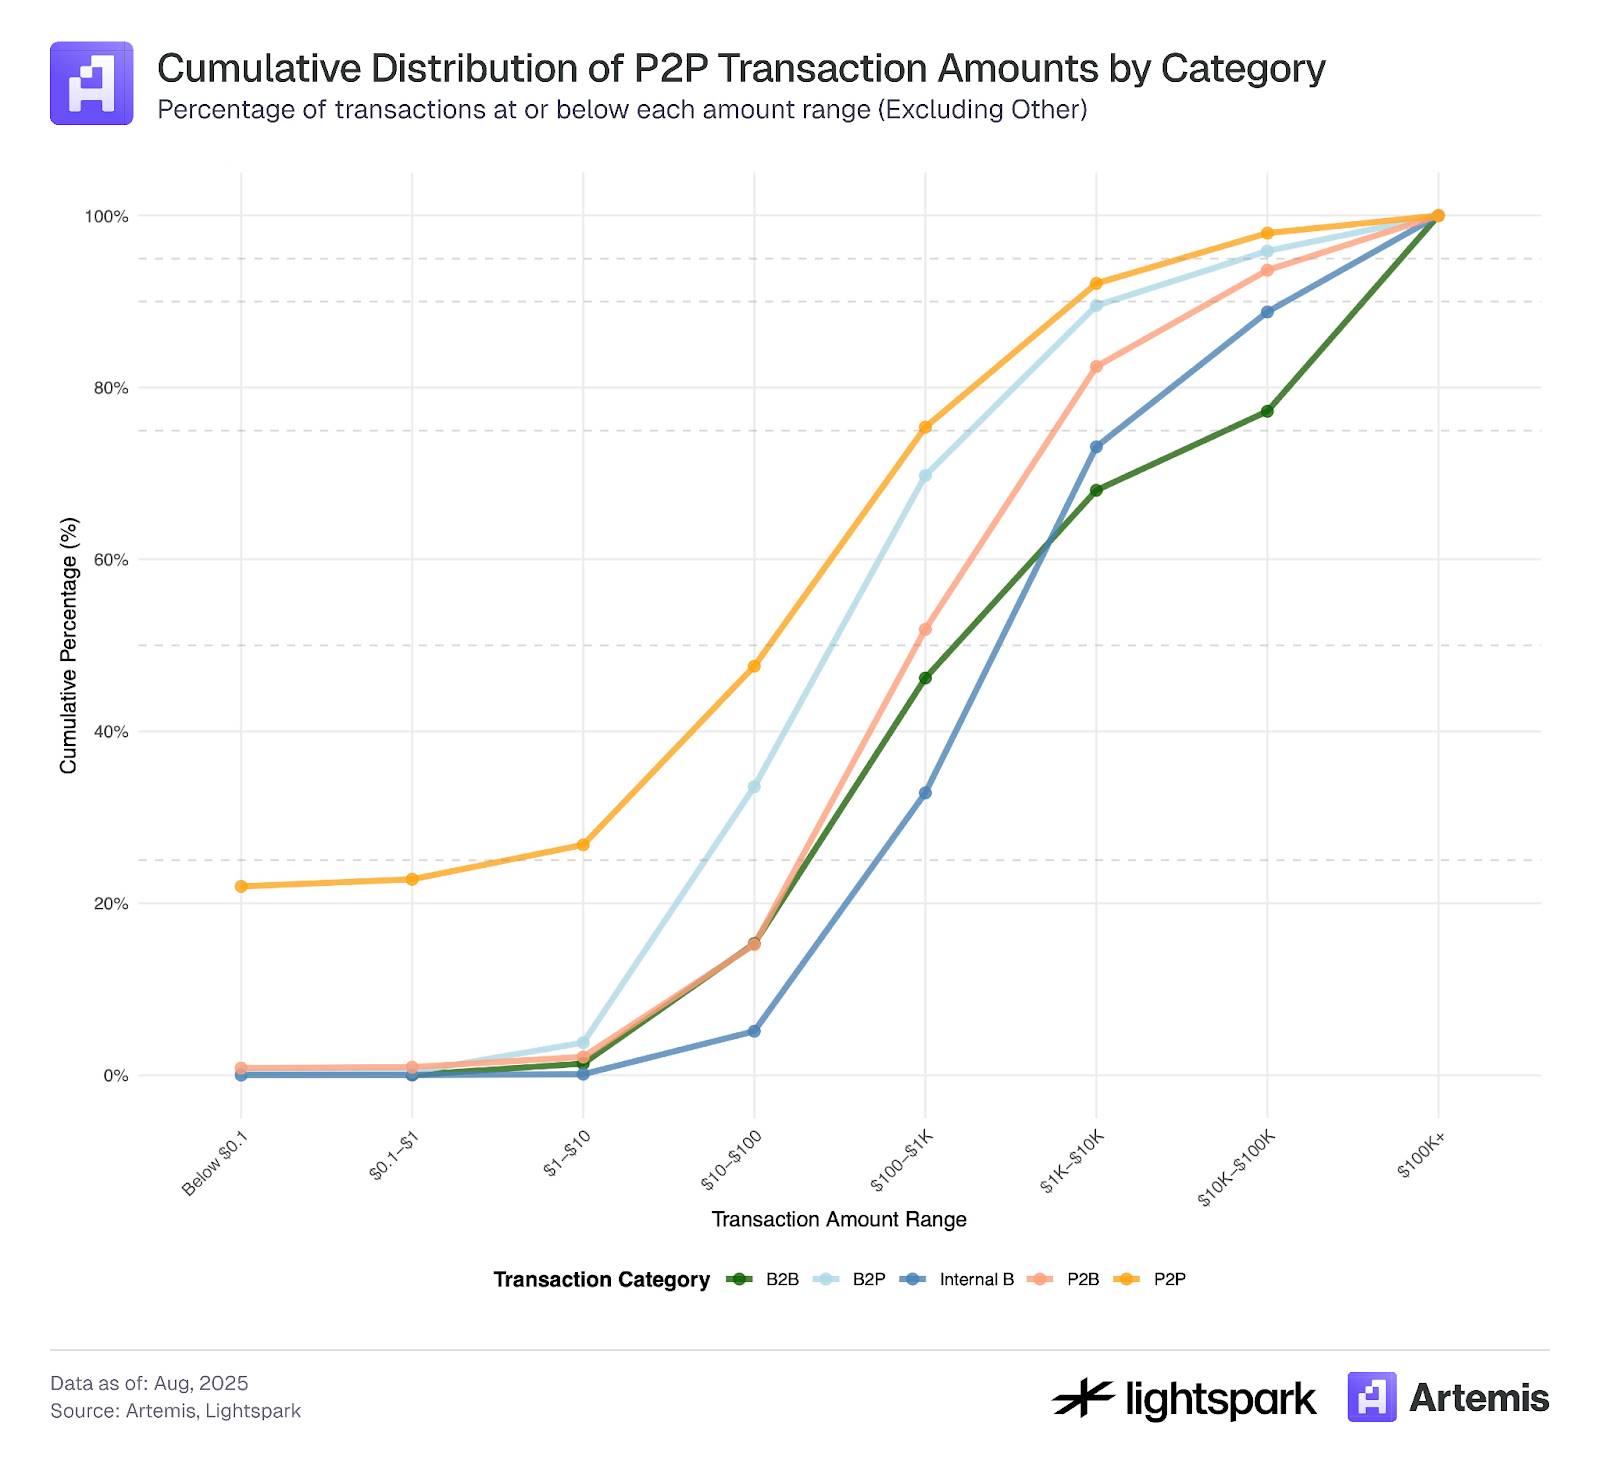
Данные для этого анализа охватывают период с 4 июля 2025 года по 31 июля 2025 года.
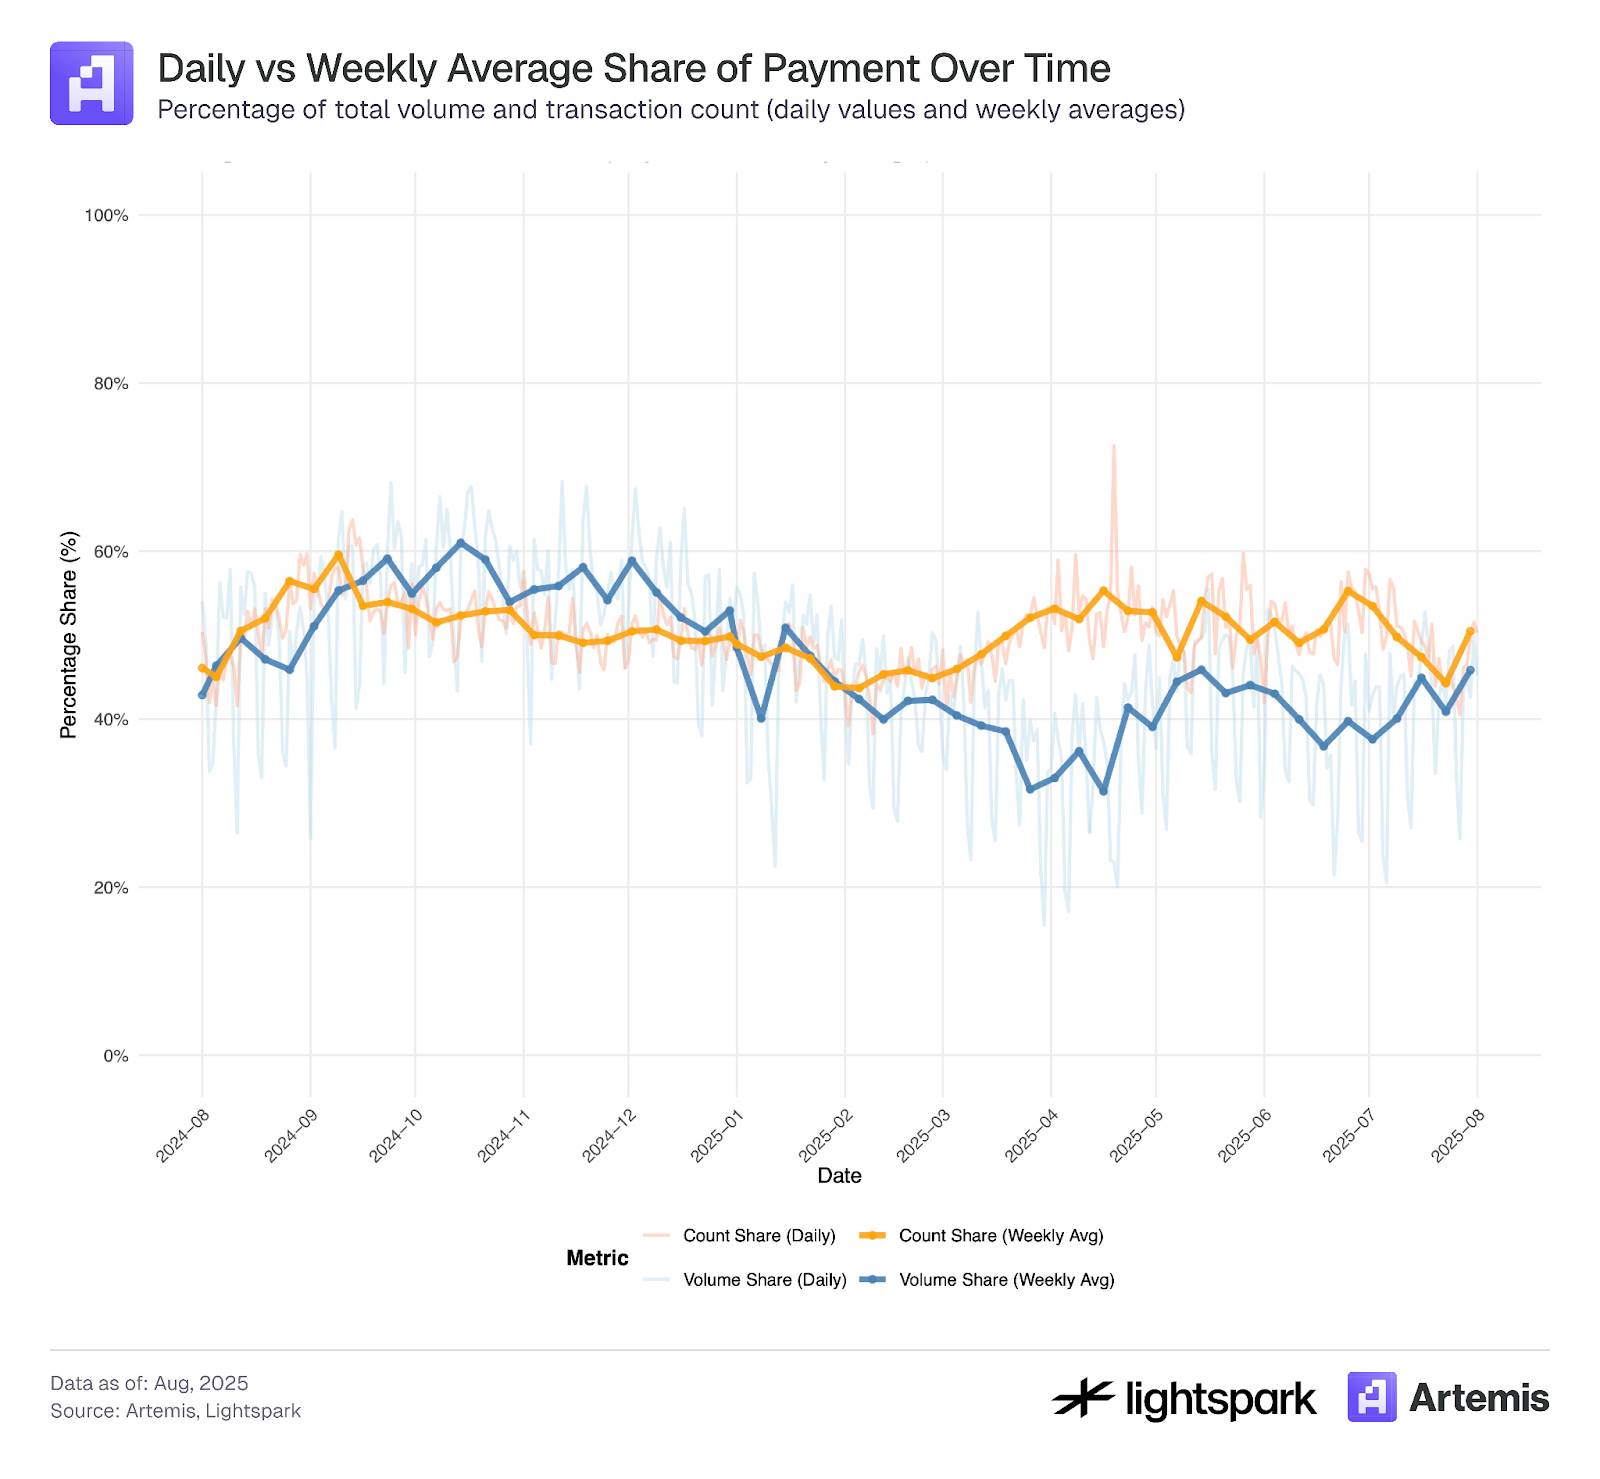
На Рисунках 5 и 6 показана динамика каждой платежной категории с течением времени.
Рисунок 5, сфокусированный на еженедельных изменениях, показывает последовательную тенденцию внедрения и рост недельного объема платежных транзакций по всем категориям. В Таблице 4 дополнительно обобщены общие изменения за период с августа 2024 года по август 2025 года.
Кроме того, на Рисунке 6 показана разница в платежах между рабочими днями и выходными, где можно четко увидеть снижение объема платежных транзакций в выходные дни. В целом, использование платежных транзакций во всех категориях демонстрирует тенденцию роста как в рабочие дни, так и в выходные.
Рисунок 5:
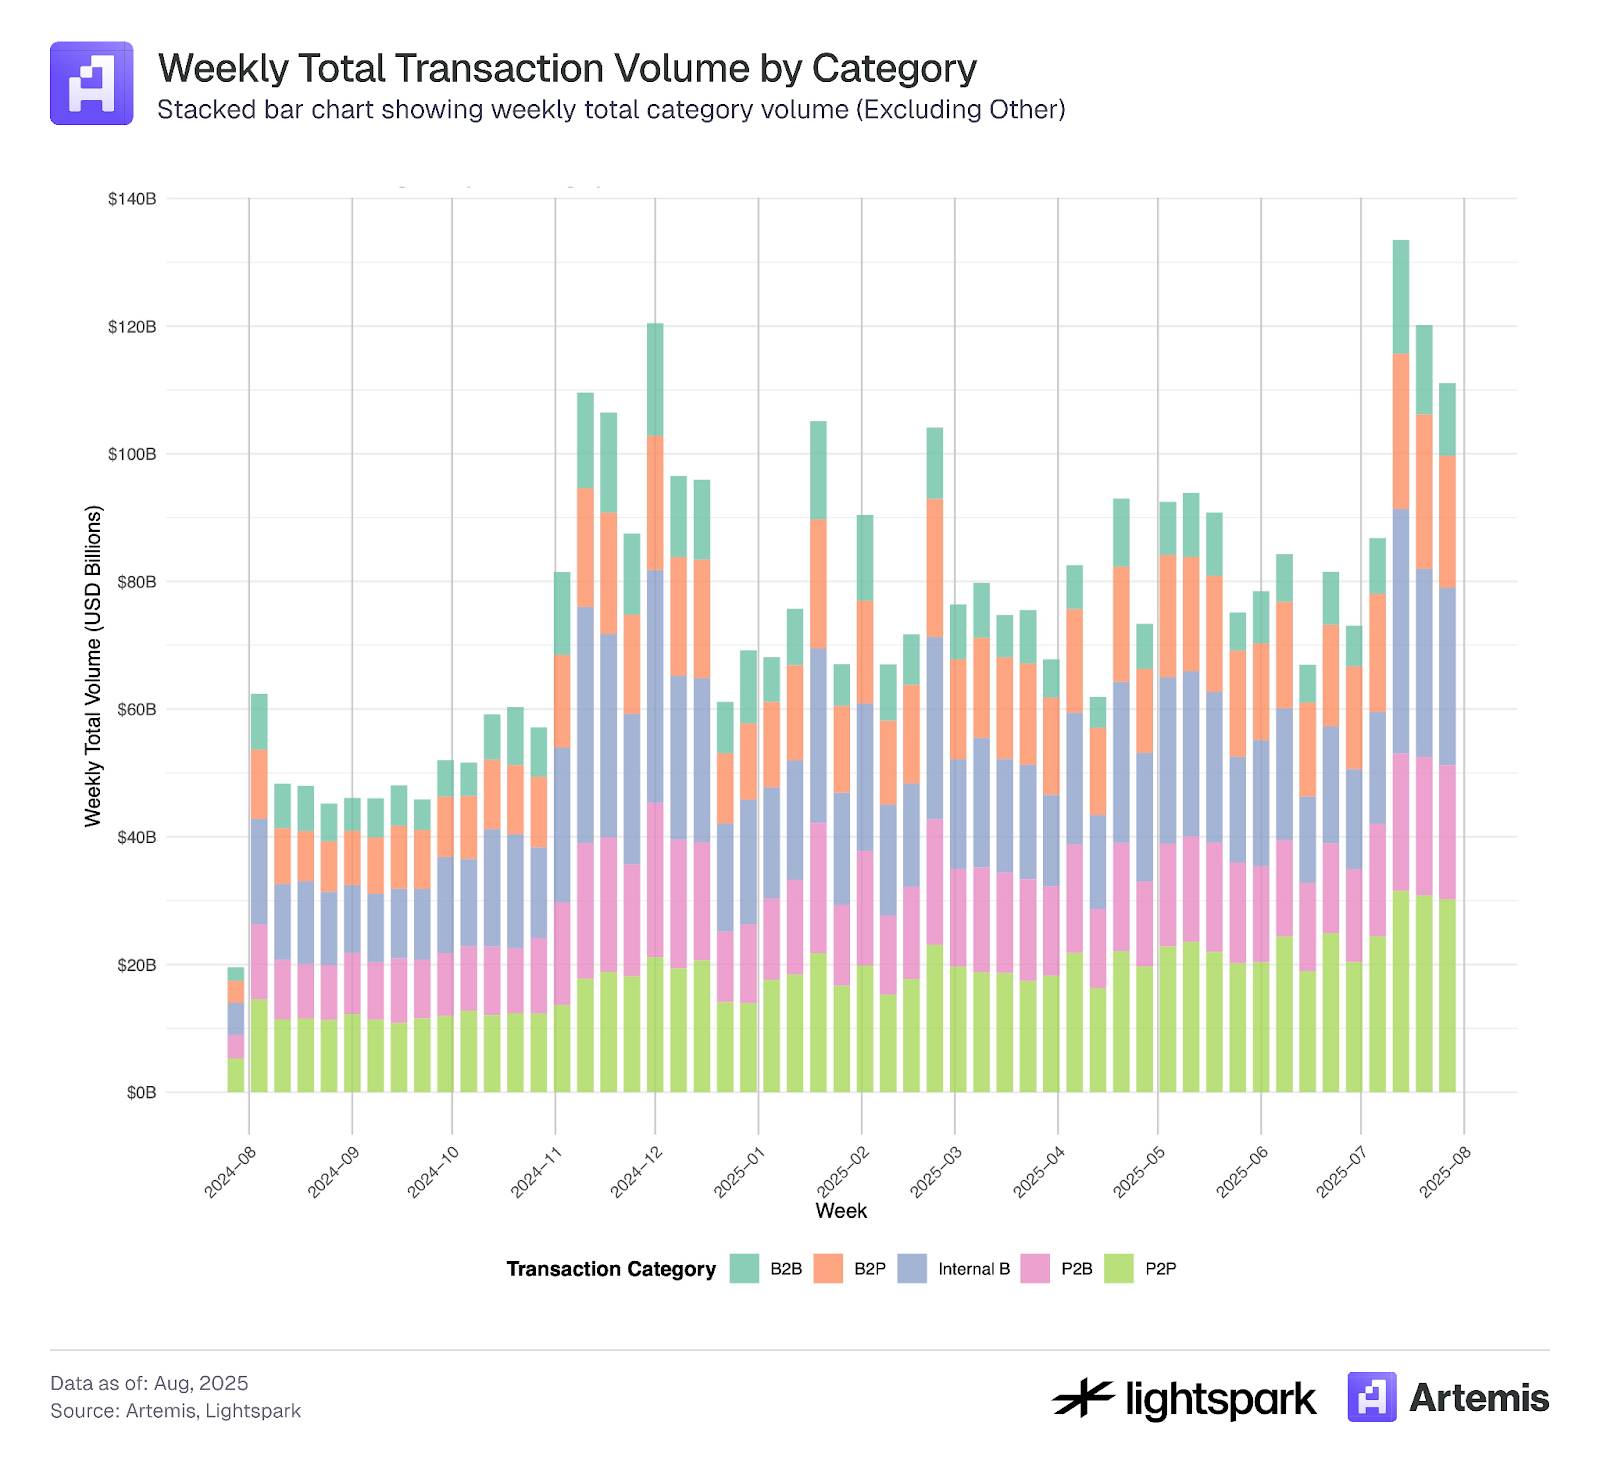
Рисунок 6:
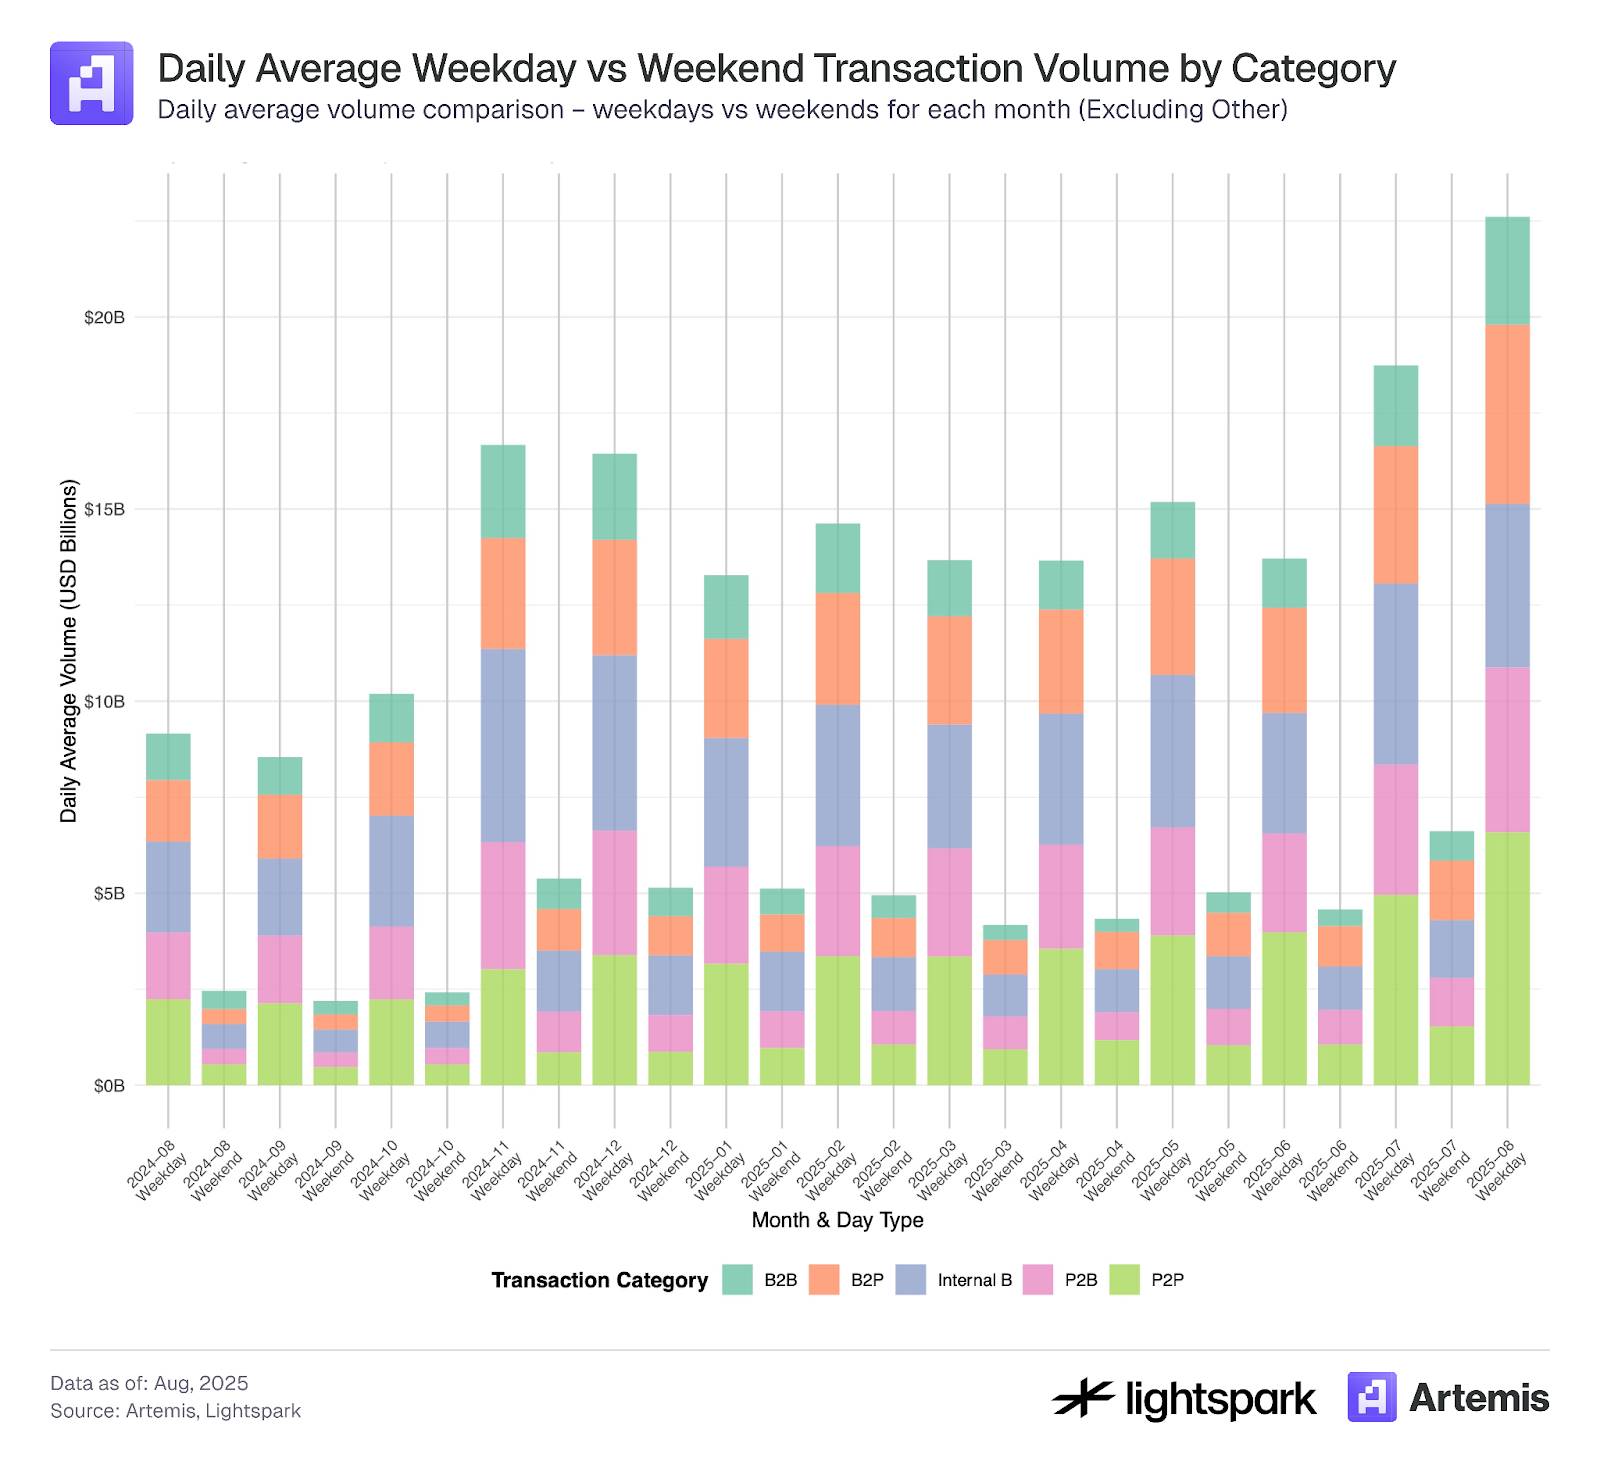
Таблица 4: Динамика объема платежных транзакций, количества транзакций и суммы транзакций с течением времени
3.3 Концентрация транзакций со стабильными монетами
На Рисунке 9 мы рассчитали концентрацию основных кошельков-отправителей, отправляющих стабильные монеты через блокчейн Ethereum. Очевидно, что большая часть объема переводов стабильных монет сосредоточена в небольшом количестве кошельков. В течение нашего периода выборки топ-1000 кошельков обеспечили около 84% объема транзакций.
Это указывает на то, что, несмотря на то, что DeFi и блокчейн предназначены для поддержки и содействия децентрализации, в некоторых аспектах они по-прежнему демонстрируют высокую степень централизации.
Рисунок 9:
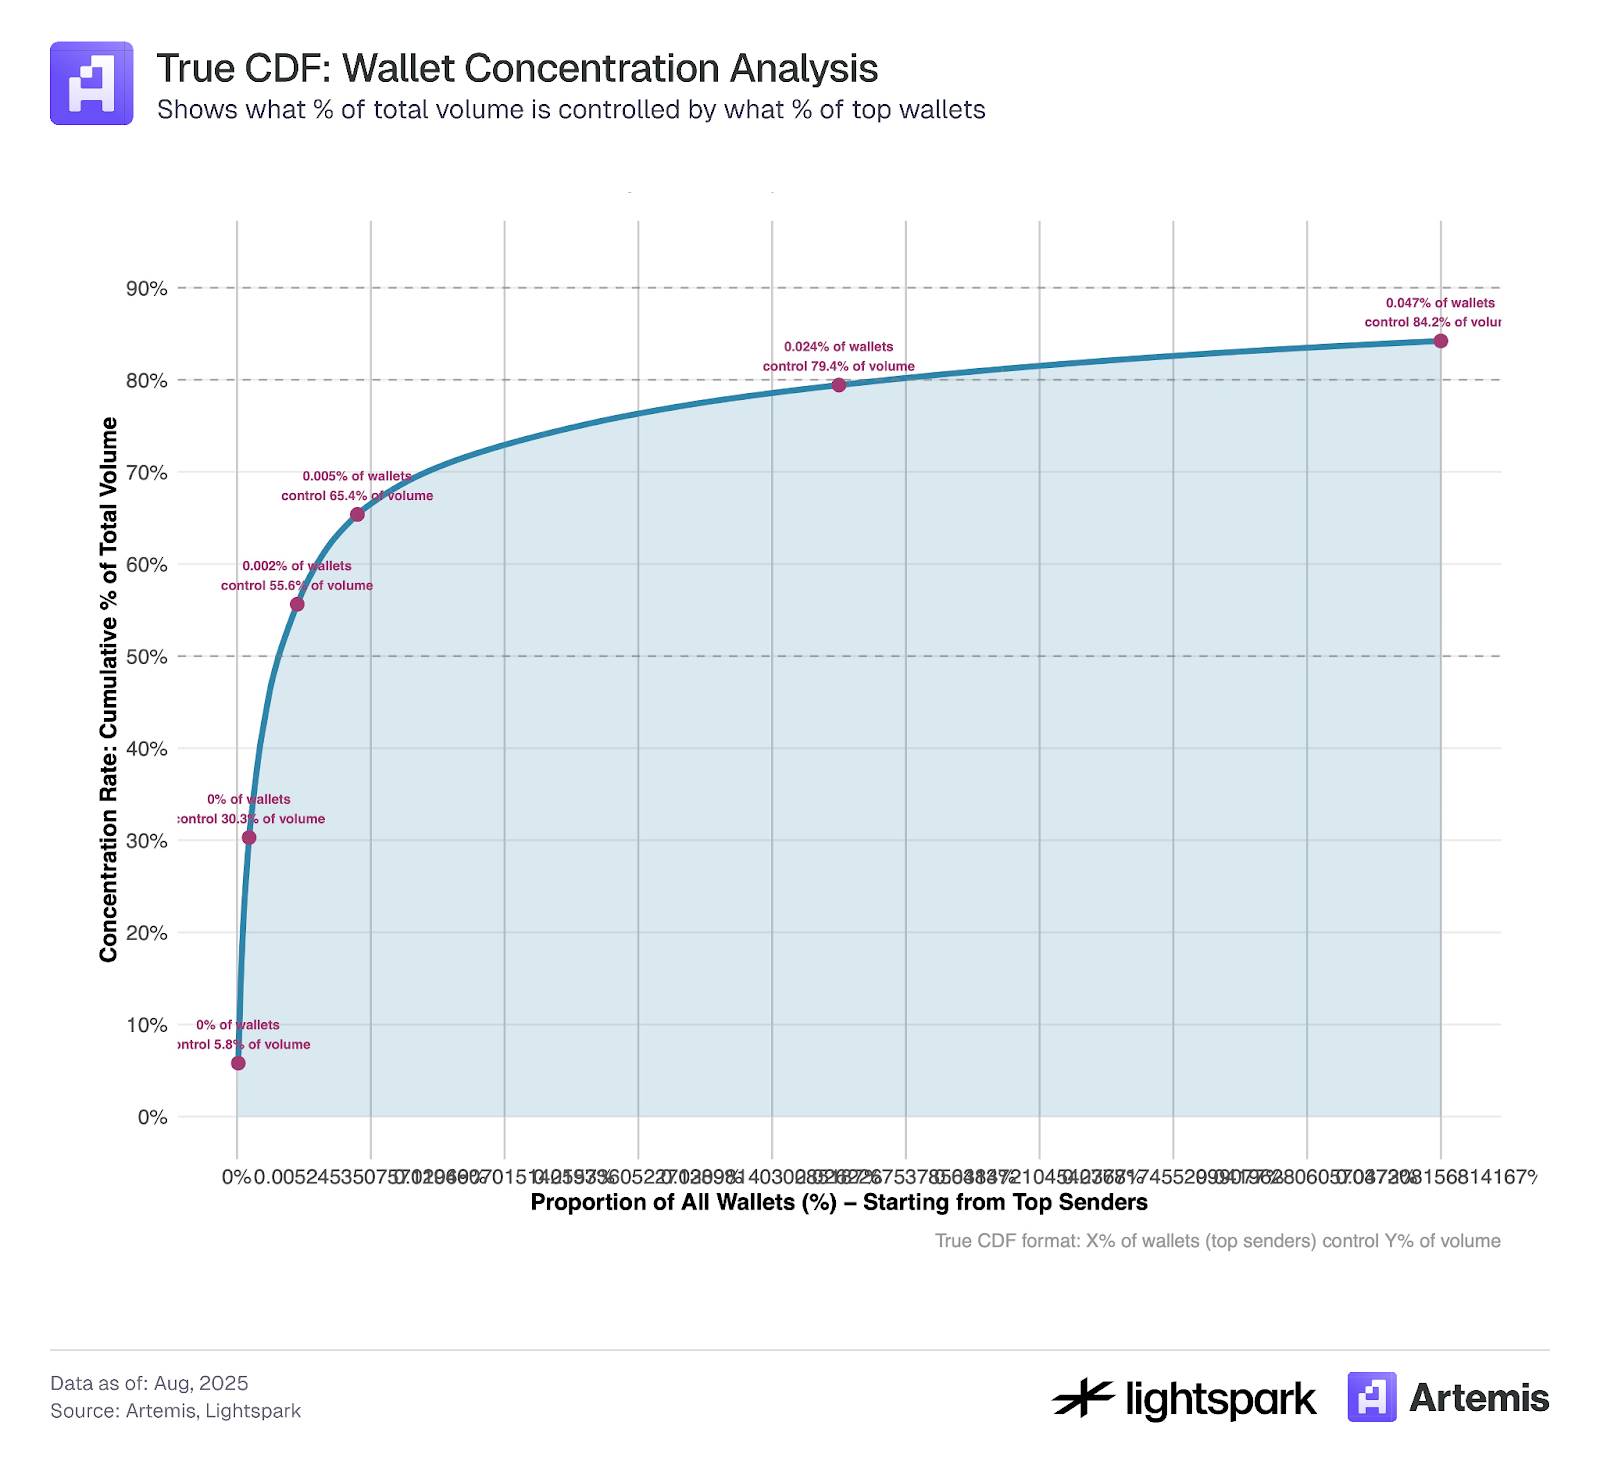
Данные для этого анализа охватывают период с 4 июля 2025 года по 31 июля 2025 года.
4. Обсуждение
Очевидно, что внедрение стабильных монет продолжает расти с течением времени, их объем транзакций и количество транзакций более чем удвоились в период с августа 2024 года по август 2025 года. Оценка использования стабильных монет в платежах является сложной задачей, и все больше инструментов разрабатывается для помощи в улучшении этой оценки. В этом исследовании с использованием данных меток, предоставленных Artemis, исследуется и оценивается использование стабильных монет в платежах, зарегистрированных в блокчейне (Ethereum).
Наши оценочные результаты показывают, что платежи стабильными монетами составляют 47% от общего объема транзакций (или 35%, если исключить внутренние B-транзакции). Поскольку наши критерии классификации платежей менее строгие (в основном основанные на переводах EOA-EOA), эту оценку можно рассматривать как верхний предел. Однако исследователи могут дополнительно применять методы фильтрации, такие как установление верхнего и нижнего пределов суммы транзакции, в зависимости от своих исследовательских целей. Например, добавление минимального ограничения в 0,1 доллара может исключить манипуляции с транзакциями с низкой суммой, упомянутые в разделе 3.1.
В разделе 3.2, путем дальнейшего разделения платежных транзакций на P2P, B2B, P2B, B2P и внутренние B-транзакции с использованием данных меток Artemis, мы обнаружили, что P2P-платежи составляют только 23,7% от общего объема платежных транзакций (все исходные данные) или 11,3% (исключая внутренние B-транзакции). Предыдущие исследования указывали, что P2P-платежи составляют примерно 25% платежей стабильными монетами, что близко к нашим результатам.
Наконец, в разделе 3.3 мы наблюдаем, что с точки зрения объема транзакций большинство транзакций со стабильными монетами сосредоточено в топ-1000 кошельков. Это поднимает интересный вопрос: развивается ли использование стабильных монет как платежного инструмента, движимого посредниками и крупными компаниями, или как инструмента расчетов для P2P-транзакций? Время покажет.
Ссылки
-
Yaish, A., Chemaya, N., Cong, L. W., & Malkhi, D. (2025). Inequality in the Age of Pseudonymity. arXiv preprint arXiv:2508.04668.
-
Awrey, D., Jackson, H. E., & Massad, T. G. (2025). Stable Foundations: Towards a Robust and Bipartisan Approach to Stablecoin Legislation. Available at SSRN 5197044.
-
Halaburda, H., Livshits, B., & Yaish, A. (2025). Platform building with fake consumers: On double dippers and airdrop farmers. NYU Stern School of Business Research Paper Forthcoming.
-
Cong, L. W., Li, X., Tang, K., & Yang, Y. (2023). Crypto wash trading. Management Science, 69(11), 6427-6454.
Больше информации на:
https://www.stablecoin.fyi/#stablecoin-payments-by-type