Venice Token [VVV] surges 14% – Why THIS is the next KEY hurdle

ambcryptoPublicado em 2026-03-26Última atualização em 2026-03-26

Resumo

Venice Token (VVV) surged 14.37% to $6.40, supported by a 26.54% increase in trading volume, indicating strong spot market demand. The price broke out of a pennant pattern, shifting the market structure from consolidation to expansion, with immediate resistance at $6.68 and a potential target near $8.50. Key support now lies at $5.14. However, the MACD shows weakening bullish momentum with a negative histogram, suggesting a divergence between price action and underlying strength. Additionally, persistent sell pressure in Spot CVD indicates aggressive selling, though buyers appear to be absorbing it. Open Interest rose 18.74%, reflecting leveraged positioning that could fuel volatility. The rally's sustainability depends on holding above $5.14; a break below could quickly reverse gains.

Venice Token [VVV] has surged 14.37% to $6.40 as trading volume climbs 26.54% to $23.12M, signaling strong demand expansion across the spot market.

This expansion shows that price is not drifting upward but rather advancing through strong spot demand.

As participation increases, the rally reflects conviction instead of low-liquidity spikes. The VVV price increase toward $6.40 highlights alignment between demand and price action.

However, volume expansion at this stage also suggests that traders are reacting to the breakout rather than anticipating it.

As a result, this phase often defines whether continuation can hold or begin to fade under pressure.

VVV breaks free as structure shifts upward

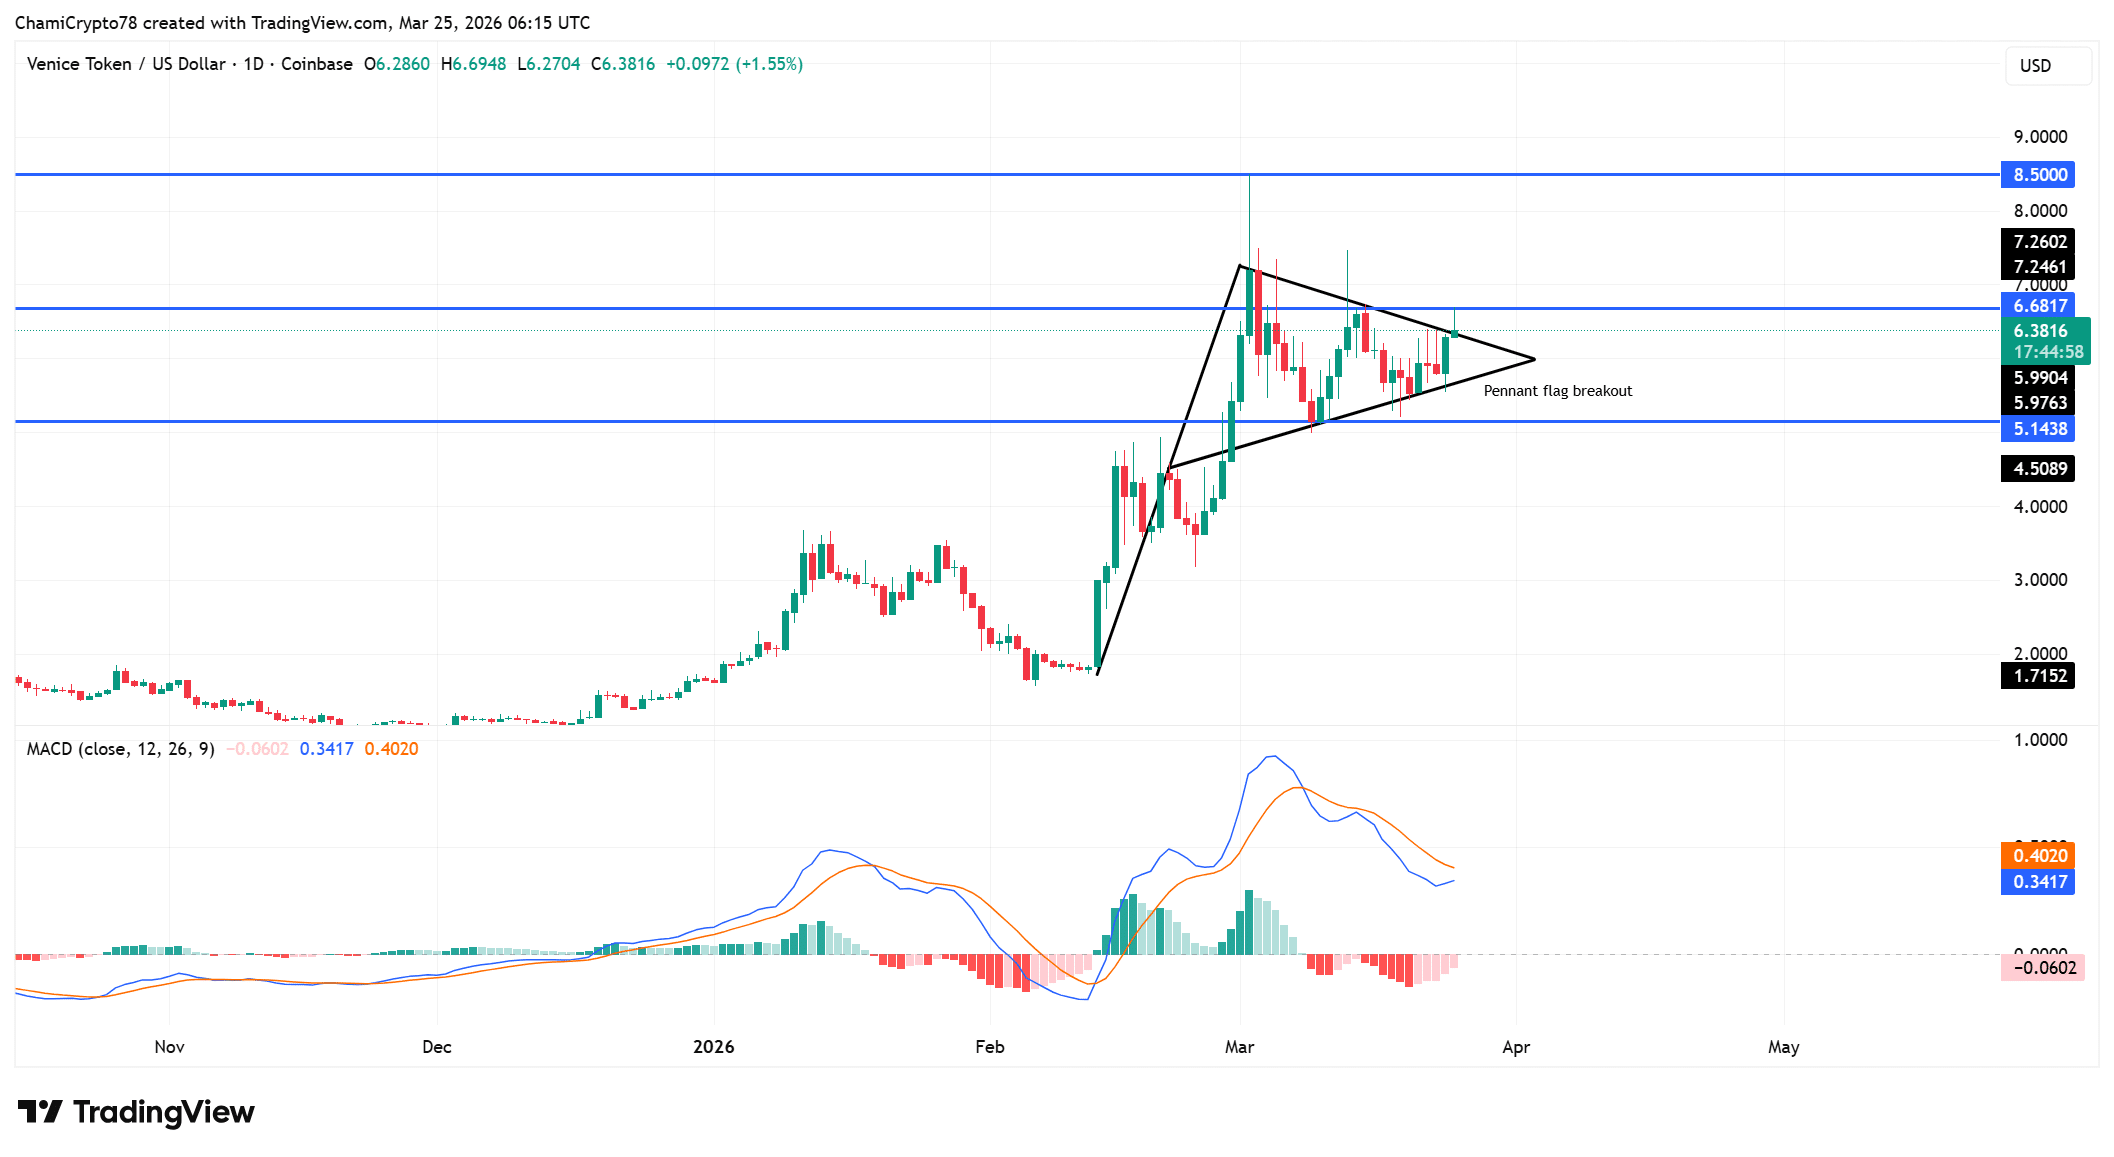
Price has broken out of the pennant flag, ending the prior compression phase and shifting structure toward expansion.

The breakout places immediate resistance at $6.68, while a broader target forms near $8.50 if continuation holds.

Besides, the former consolidation region around $5.14 now acts as a key support base. This transition reflects a shift from indecision into directional control.

However, price now approaches resistance zones where sellers may respond. As a result, holding above the breakout zone remains critical.

If price maintains this structure, the breakout could extend, but failure to hold support would quickly weaken the setup.

The MACD structure shows that bullish strength has not fully aligned with price action.

The indicator has not crossed above the signal line, which limits confirmation of sustained upside pressure.

Additionally, the histogram has turned negative, reflecting weakening strength after the breakout.

This divergence highlights a gap between structural expansion and internal strength. However, price continues holding above key levels, suggesting that buyers still defend the move.

As a result, the current setup reflects early-stage expansion rather than fully confirmed continuation.
Source: TradingView

CVD divergence exposes underlying sell pressure

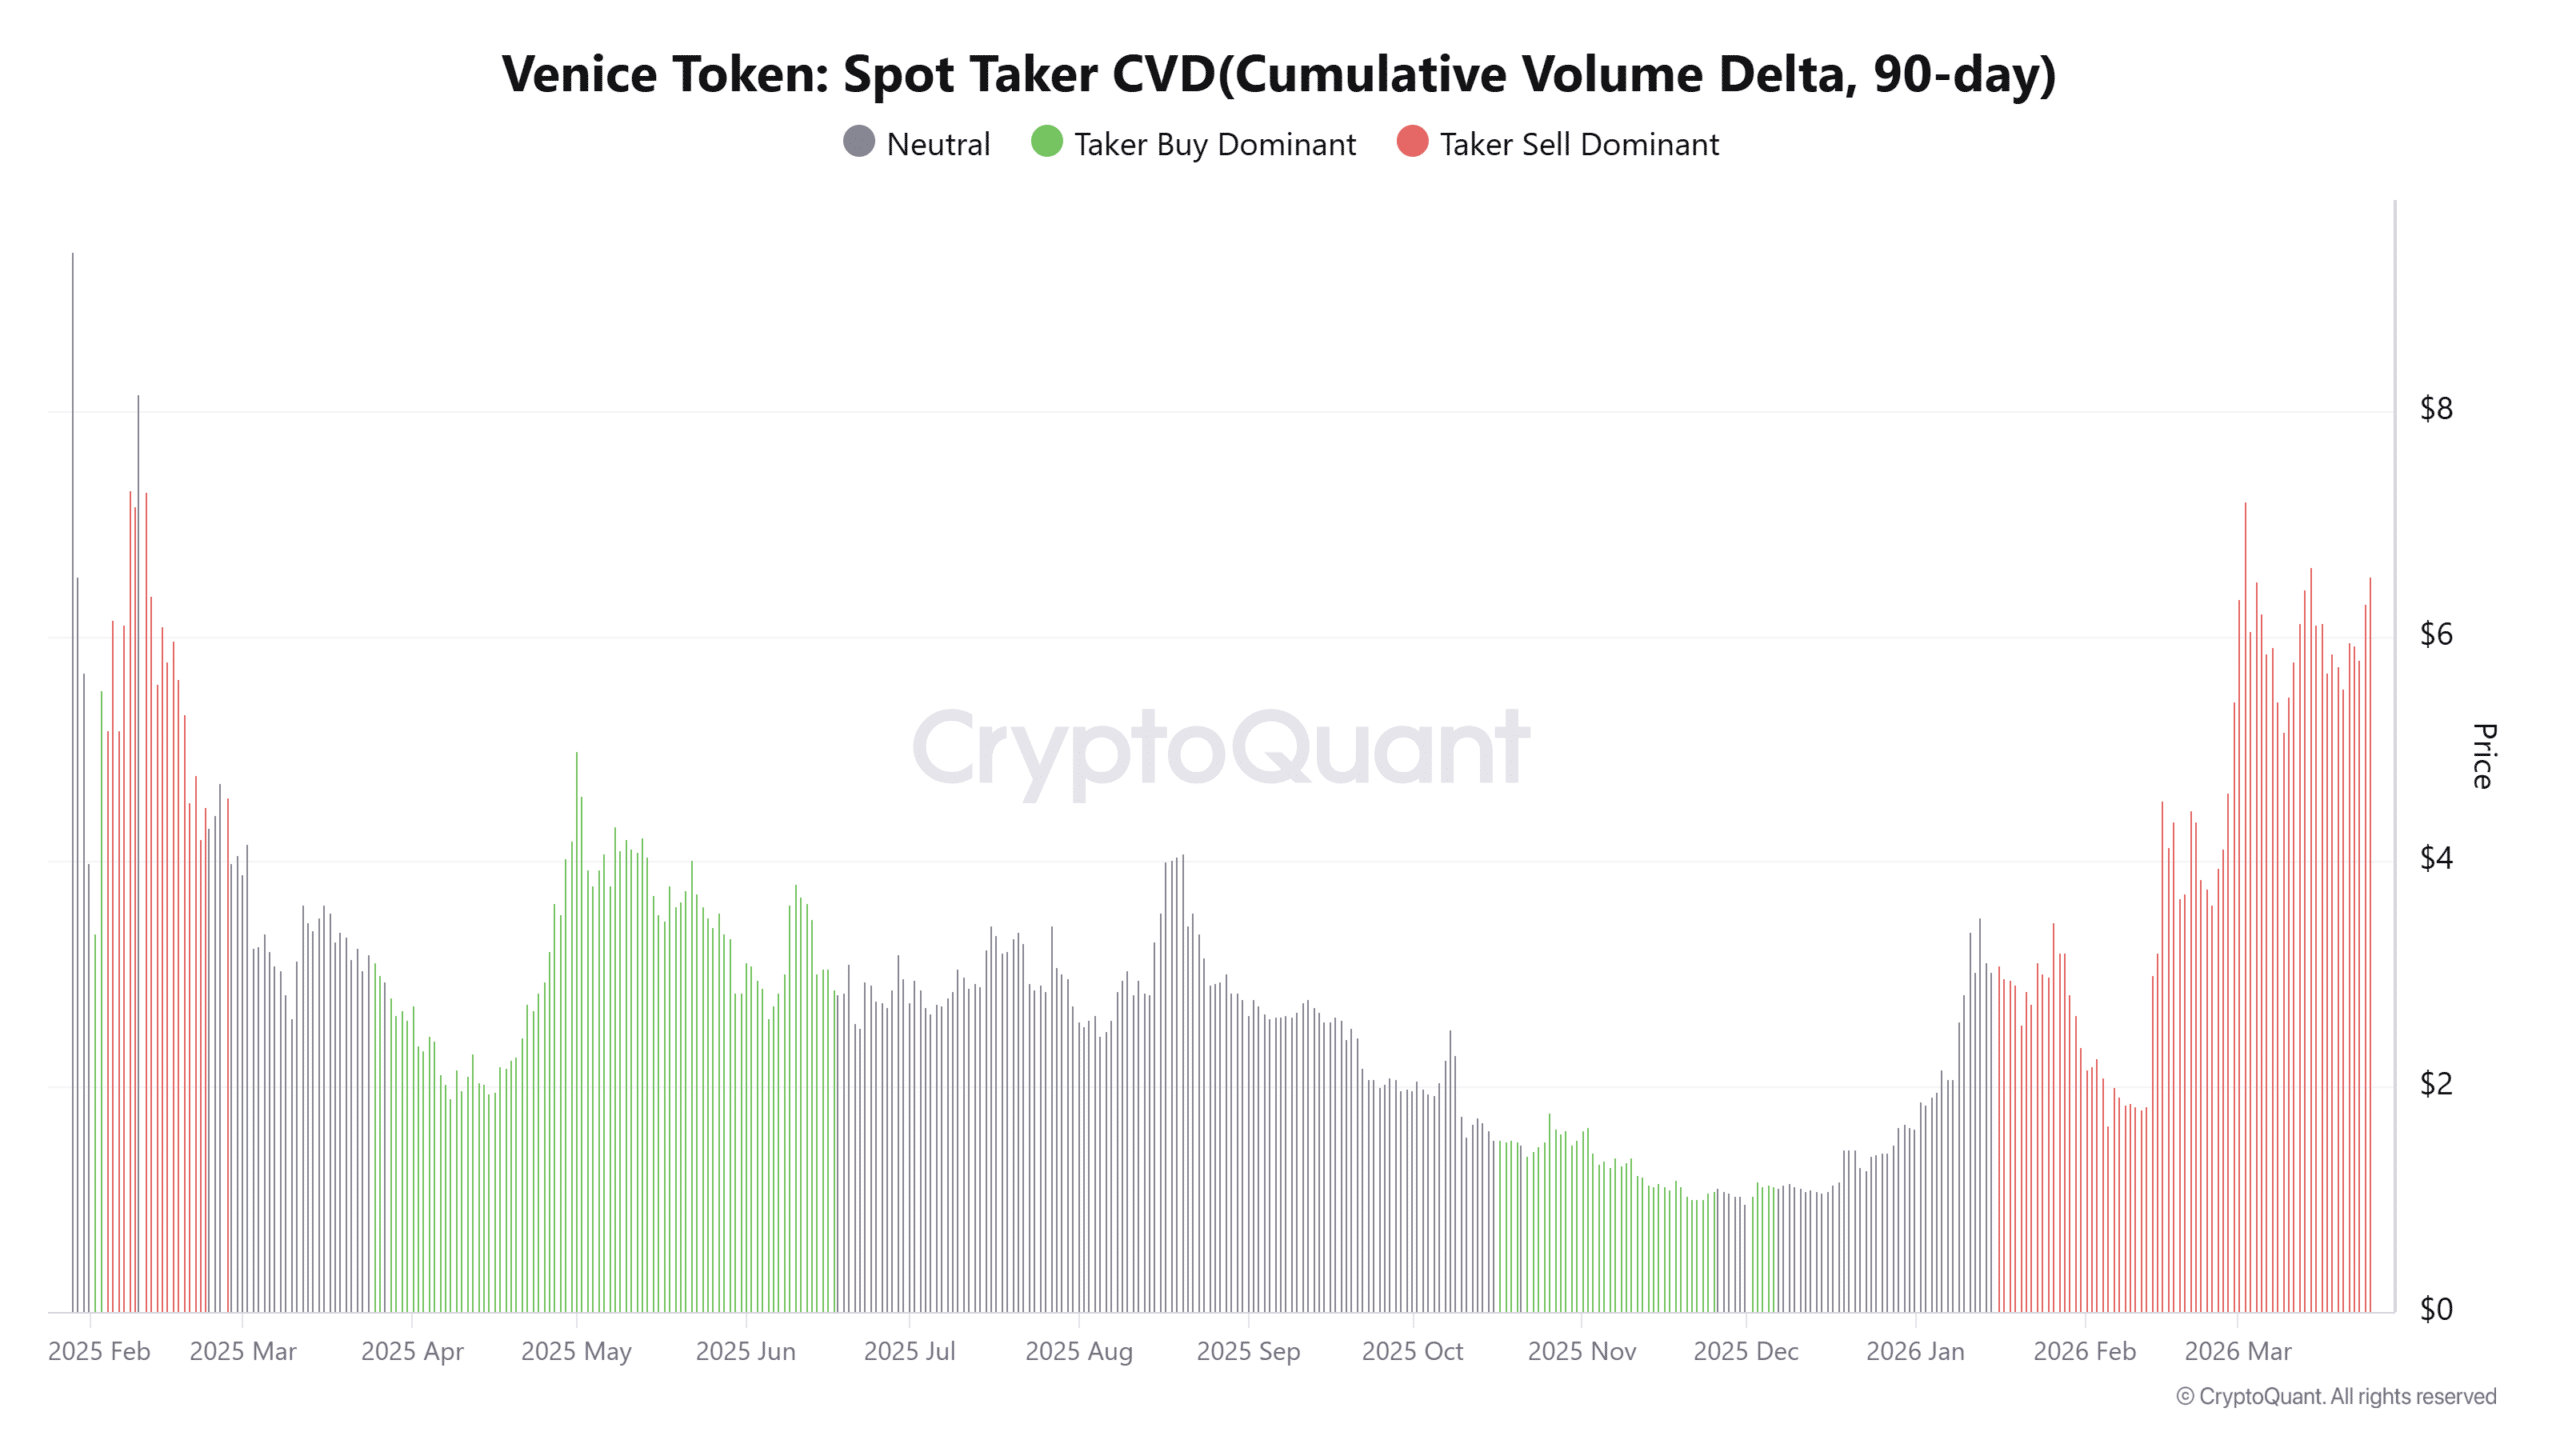
Spot Taker CVD remains sell-dominant over the past 90 days, revealing persistent aggressive selling beneath the rally.

This structure indicates that market participants continue executing sell orders even as price rises.

However, price has not declined, which suggests that larger buyers may be absorbing this supply.

This divergence highlights a key imbalance between visible selling and hidden demand. As a result, the rally depends on continued absorption to sustain upward movement.

If selling pressure intensifies without matching demand, the structure could weaken. However, as long as price holds, this absorption continues supporting the current trend.
Source: CryptoQuant

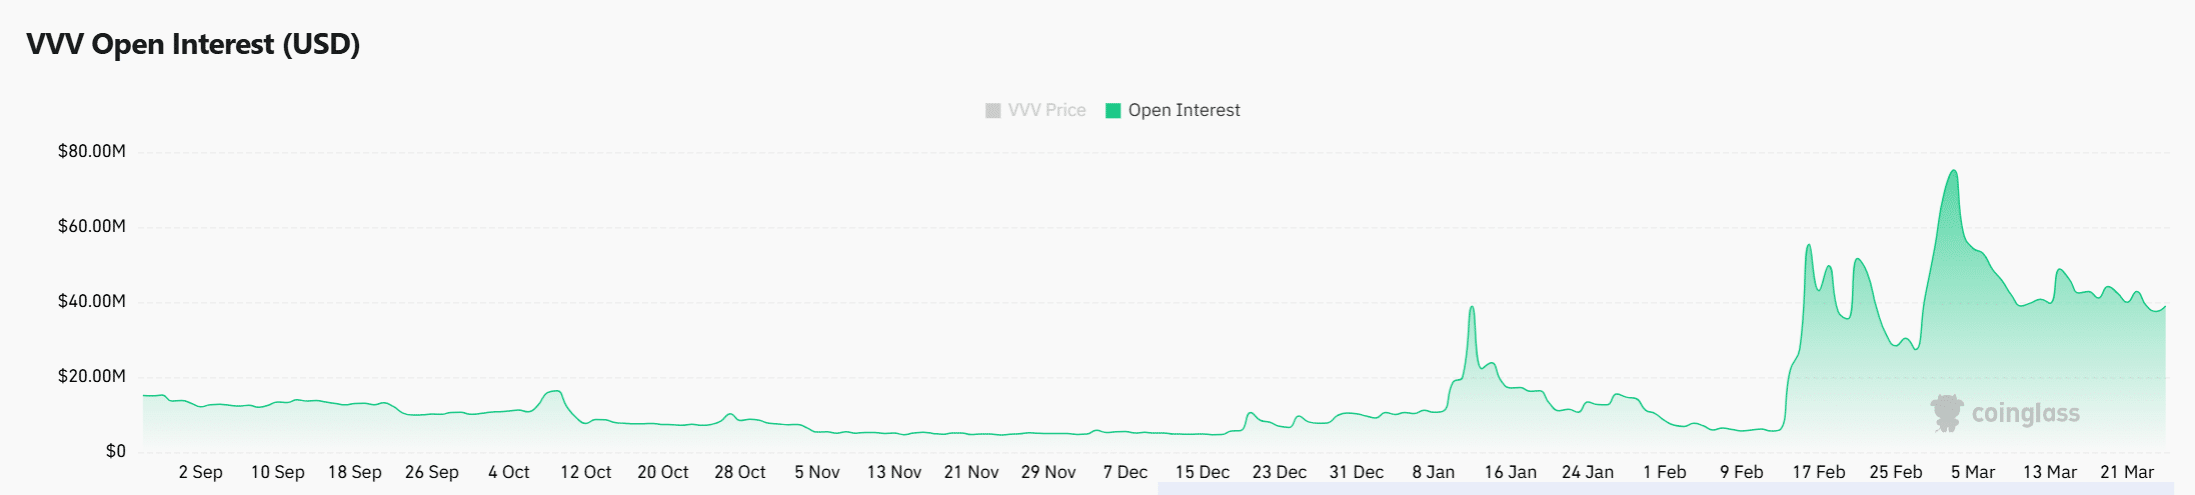
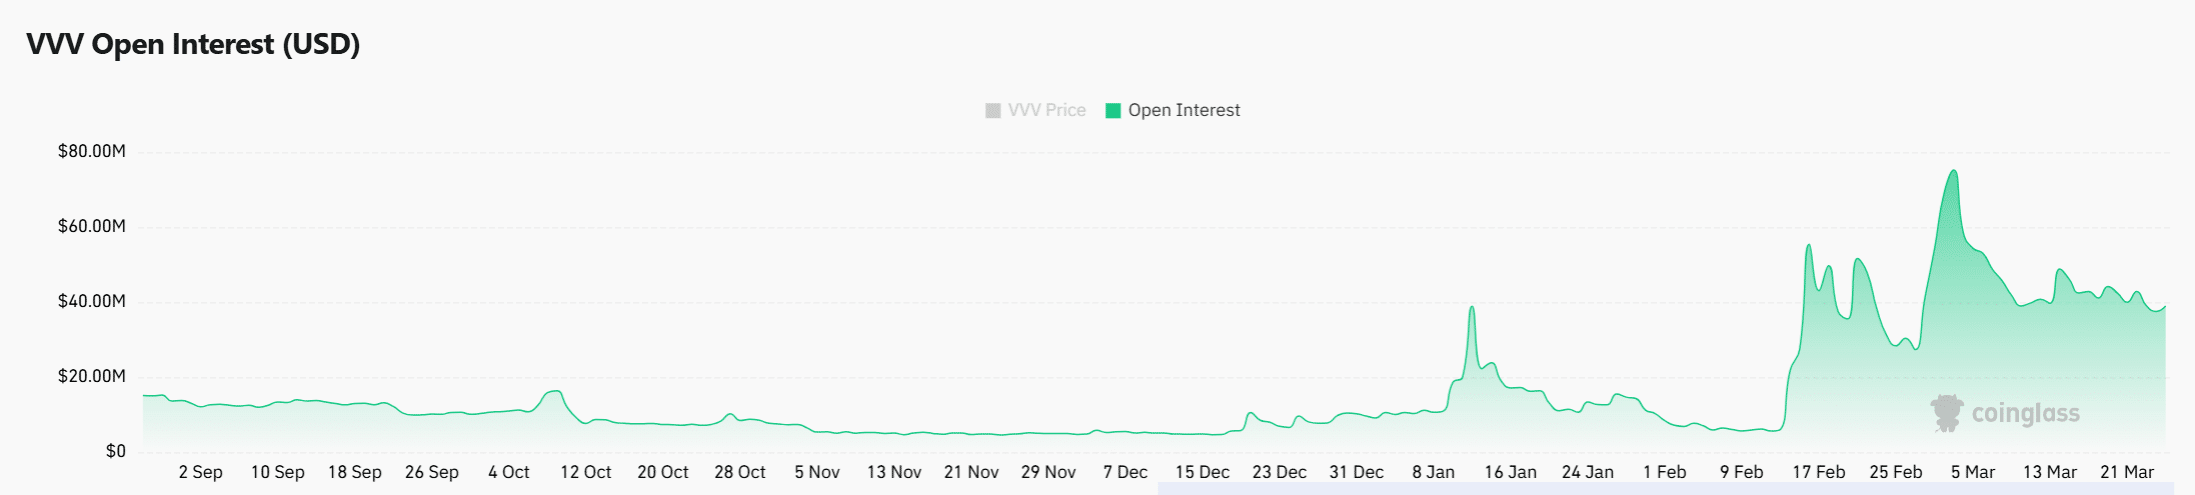
Open interest rise shows leveraged buildup into VVV breakout

Open interest has increased by 18.74% to $43.21M, reflecting growing participation in derivatives markets.

This rise shows that traders are positioning aggressively as price breaks out of consolidation. However, leveraged positioning introduces volatility, especially near resistance zones.

As positions build, the market becomes sensitive to rapid price movements in either direction. This setup often leads to sharp expansions once liquidity gets triggered.

At the same time, rising open interest without strong confirmation from other indicators increases risk.

If price continues higher, these positions could fuel continuation, but any reversal would quickly unwind these leveraged trades.
Source: CoinGlass


VVV has broken out with strong volume support, which strengthens its bullish structure. However, weakening MACD signals and persistent sell pressure create underlying tension.

The rally can sustain if buyers continue absorbing supply and hold above $5.14. If that support fails, the breakout would likely weaken quickly under pressure.


Final Summary

  • VVV surged 14% to $6.40, backed by a 26% jump in Spot Volume. Breakout above the pennant shifted the structure from consolidation to expansion.
  • Open Interest rose 18%, signaling aggressive leveraged positioning. Rising leverage increases the risk of sharp moves, especially near resistance


Perguntas relacionadas

QWhat is the current price of Venice Token (VVV) and by what percentage has it surged?

AThe current price of Venice Token (VVV) is $6.40, and it has surged by 14.37%.

QWhat key resistance level does the article identify for VVV after its breakout?

AThe article identifies $6.68 as the immediate resistance level for VVV after its breakout.

QAccording to the MACD indicator, what divergence suggests a lack of full confirmation for the upward price movement?

AThe MACD has not crossed above the signal line, and the histogram has turned negative, indicating a divergence between the price expansion and the underlying bullish strength.

QWhat does the persistent sell-dominant Spot Taker CVD indicate about the market activity?

AThe persistent sell-dominant Spot Taker CVD indicates that there is aggressive selling pressure happening beneath the rally, which is being absorbed by larger buyers to sustain the price increase.

QWhy does the rise in Open Interest introduce increased risk for VVV price movement?

AThe 18.74% rise in Open Interest to $43.21M shows that traders are using significant leverage. This introduces volatility and the risk of sharp price movements in either direction, as these leveraged positions could quickly unwind if the price reverses.

Leituras Relacionadas

Breaking: Google Earth Urgently Pulls Back Nano Banana 2 Image Generation Feature!

Google Earth's newly launched "Create image" feature, powered by the Nano Banana 2 AI image generation model, was abruptly withdrawn shortly after its release due to being "played" by users. The feature allowed users to generate and overlay AI-created visuals directly onto real-world satellite and 3D maps in Google Earth. The tool enabled creative applications like historical recreations (e.g., visualizing ancient Pompeii), generating informational graphics for landmarks, and envisioning architectural projects or futuristic cityscapes on real terrain. It operated under "geospatial grounding," meaning the AI respected the underlying geography, topography, and perspective of the chosen map view. The model also integrated with Gemini to retrieve relevant factual information. However, upon release, users quickly tested its limits. A prominent example involved reimagining Philadelphia's historic Independence Hall as a post-apocalyptic ruin overrun by "happy" zombies, evil clowns, and giant alien mechs. This highlighted both the feature's playful potential and its risks regarding the generation of inappropriate or misleading content on realistic maps, leading to its swift temporary removal. Google stated it would re-release the feature after implementing "enhanced guardrails." Analysts note this move strategically leverages Google's vast proprietary geospatial data, positioning its AI not just for artistic generation but for spatially accurate world visualization—a unique advantage in the competitive AI image generation landscape.

marsbitHá 11m

Breaking: Google Earth Urgently Pulls Back Nano Banana 2 Image Generation Feature!

marsbitHá 11m

Altman Admits: Overestimated AI Snatching Jobs! Huang Renxun: The Unemployment Narrative Is Completely Backwards

Sam Altman has revised his earlier predictions about AI rapidly replacing jobs, admitting he overestimated the speed at which AI would eliminate entry-level white-collar roles. Speaking on the "Invest Like the Best" podcast, he stated that people do not truly want an AI CEO, as accountability and human connection remain critical. He found that individuals prefer interacting with people who can be held responsible for decisions. Similarly, NVIDIA's Jensen Huang argued that the narrative of AI destroying jobs is misguided. He distinguishes between tasks and jobs, noting that while AI can automate specific tasks, entire jobs—encompassing communication, judgment, coordination, and accountability—are not eliminated. He cited examples like radiologists and software engineers, where demand for these roles has increased as AI handles repetitive tasks, allowing for business expansion and the creation of more positions. Data from a University of Maryland and LinkUp study supports this, showing that U.S. job postings for new graduates have actually risen, countering the fear of vanishing entry-level roles. However, a significant shift is occurring: the traditional entry-level tasks that help newcomers gain experience are being automated, making initial career access more challenging. The key insight is that as AI takes over standardized tasks, the enduring value of human work shifts toward areas of responsibility, trust-building, and final decision-making—aspects that AI cannot replicate. The real "moat" for professionals lies in these irreplaceable human elements.

marsbitHá 17m

Altman Admits: Overestimated AI Snatching Jobs! Huang Renxun: The Unemployment Narrative Is Completely Backwards

marsbitHá 17m

Weekly Editor's Picks (0725-0731)

Weekly Editor's Picks (0725-0731) provides a curated selection of deep analysis, filtering out market noise. Key themes from this week include: **Macro & Policy:** The Federal Reserve's upcoming meeting is marked by high uncertainty, balancing cooling inflation data against persistent price pressures. Meanwhile, the U.S. crypto regulatory Clarity Act faces critical political hurdles, with its 2026 passage probability seen as low. **Investing & Crypto:** Analysis suggests long-term crypto success depends on conviction through volatile cycles, focusing on assets like Bitcoin and core smart contract platforms. A trend noted is the increasing similarity between global equity markets (especially tech) and crypto, driven by narrative and leverage. Several major crypto protocols show strong revenue growth, but this isn't always translating to token price appreciation due to sell pressure and structural factors. **AI & Semiconductors:** Nvidia's rising credit default swap rates signal market concern over AI infrastructure financing risks. The storage sector experienced volatility as markets began pricing in potential 2027 oversupply. Despite a record profitable quarter, SK Hynix's results were deemed "below expectations," reflecting heightened investor demands for future growth visibility. **Markets & DeFi:** TradeXYZ demonstrated remarkable accuracy in pre-market pricing for a major A股 listing. The token ONDO saw gains, linked to its growing role in the on-chain tokenized stock ecosystem. **Ethereum:** Post-Pectra upgrade, a major structural shift is underway as Lido begins migrating millions of ETH to new validator architectures designed for capital efficiency. **Also Highlighted:** Butian's bullish stock market move; OpenAI's Altman promising major advances; Samsung and SK Hynix securing large AI chip deals; Apple reaching a $5T market cap; and ongoing discussions around exchange security following Poolin's bankruptcy case.

marsbitHá 51m

Weekly Editor's Picks (0725-0731)

marsbitHá 51m

Low Investment Isn't Apple's Immunity Pass

While Meta and Google face investor scrutiny over ballooning AI capital expenditures, Apple's minimal AI investment has paradoxically become a strength. Its market cap recently reclaimed the global top spot, surpassing $5 trillion. The irony is deep: Apple's own AI efforts have lagged, with "Apple Intelligence" delayed and core talent lost, forcing reliance on partners like Google Gemini and Alibaba's Qianwen. Its Q3 FY2026 (Q2 CY) earnings initially seemed stellar. Revenue hit $109.4B (up 16% YoY), with iPhone and Mac sales, growing 22% and 29% respectively, driving most of the growth. However, the stock fell over 8% post-earnings. The primary concern was a weaker Q4 revenue growth forecast of 9-11%, below expectations, due to looming supply chain constraints. Apple is feeling the indirect cost of the AI boom. Soaring memory and chip prices, fueled by massive data center investments from Microsoft, Amazon, and others, are forcing Apple to raise Mac and iPad prices significantly. The upcoming iPhone launch is also expected to see substantial price hikes. Despite avoiding heavy AI infrastructure spending—its capital expenditures are actually down 28%—Apple cannot escape the industry-wide supply and cost pressures. While Apple's operating cash flow remains robust, its substantial R&D spending (up 32% YoY) has yet to yield major AI breakthroughs. As Tim Cook prepares to step down as CEO, Apple faces a challenging transition: balancing its premium hardware success against the strategic and cost pressures of the AI era it has so far cautiously navigated.

marsbitHá 1h

Low Investment Isn't Apple's Immunity Pass

marsbitHá 1h

Trading

Spot
活动图片