Author: Prathik Desai
Compilation: Chopper, Foresight News
Original title: Who Controls the Revenue Lifeline of the Crypto Industry?
I love the seasonal traditions in the crypto industry, like Uptober and Recktober. People in the community always bring out a ton of data around these events, and humans naturally enjoy such anecdotes, right?
The trend analysis and reports around these events are even more interesting: "This time, ETF fund flows are different," "Crypto industry financing has matured this year," "Bitcoin is poised for a rally this year," and so on. Recently, while browsing the "2025 DeFi Industry Report," I was drawn to several charts about how crypto protocols generate "substantial revenue."
These charts list the top crypto protocols with the highest annual revenue, confirming a fact many in the industry have discussed over the past year: the crypto industry is finally making revenue attractive. But what is driving this revenue growth?
Behind these charts lies another lesser-known question worth exploring: Where do these fees ultimately flow?
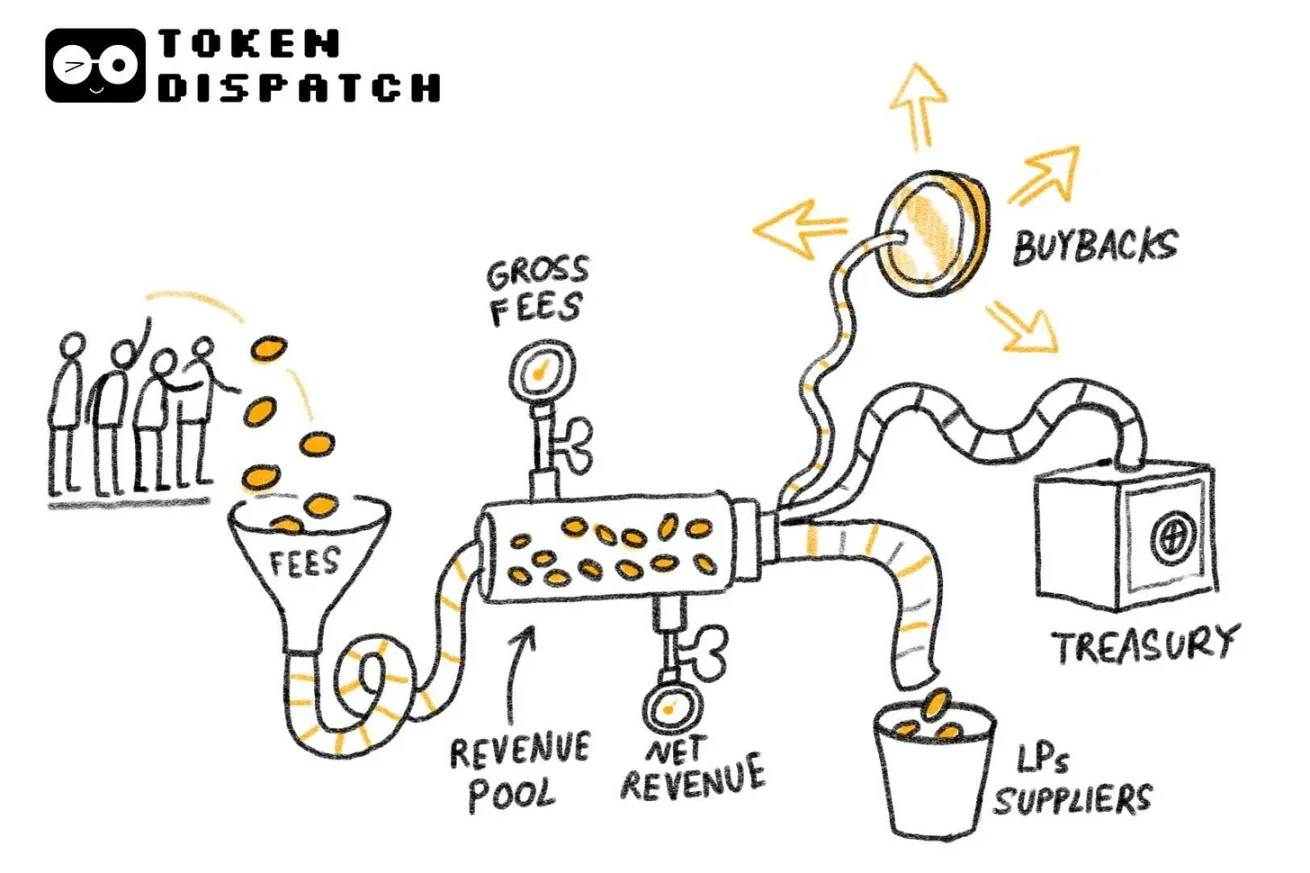
Last week, I delved into DefiLlama's fee and revenue data (Note: Revenue refers to fees retained after paying liquidity providers and suppliers) to find answers. In today's analysis, I will add more details to this data, dissecting how and where funds flow in the crypto industry.
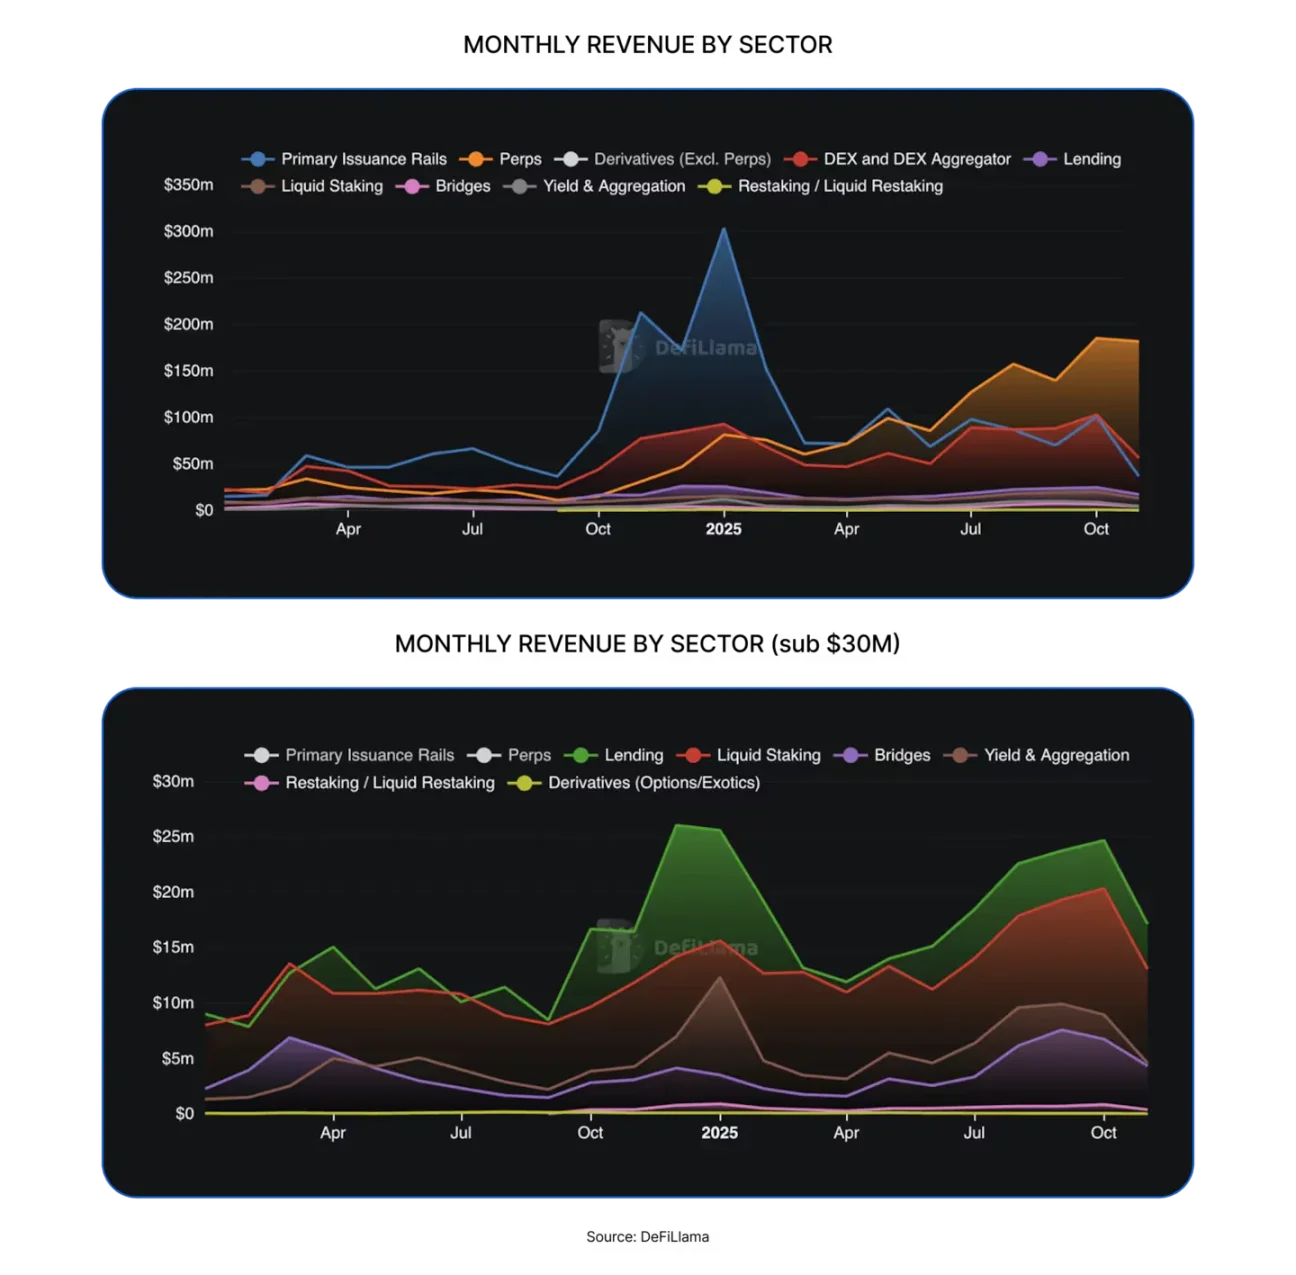
Crypto protocols generated over $16 billion in revenue last year, more than double the approximately $8 billion in 2024.
The value capture capability of the crypto industry has全面提升, with many new tracks emerging in the decentralized finance (DeFi) space over the past 12 months, such as decentralized exchanges (DEX), token issuance platforms, and decentralized perpetual contract exchanges (perp DEX).
However, the profit centers generating the highest revenue are still concentrated in traditional tracks, with stablecoin issuers being the most prominent.
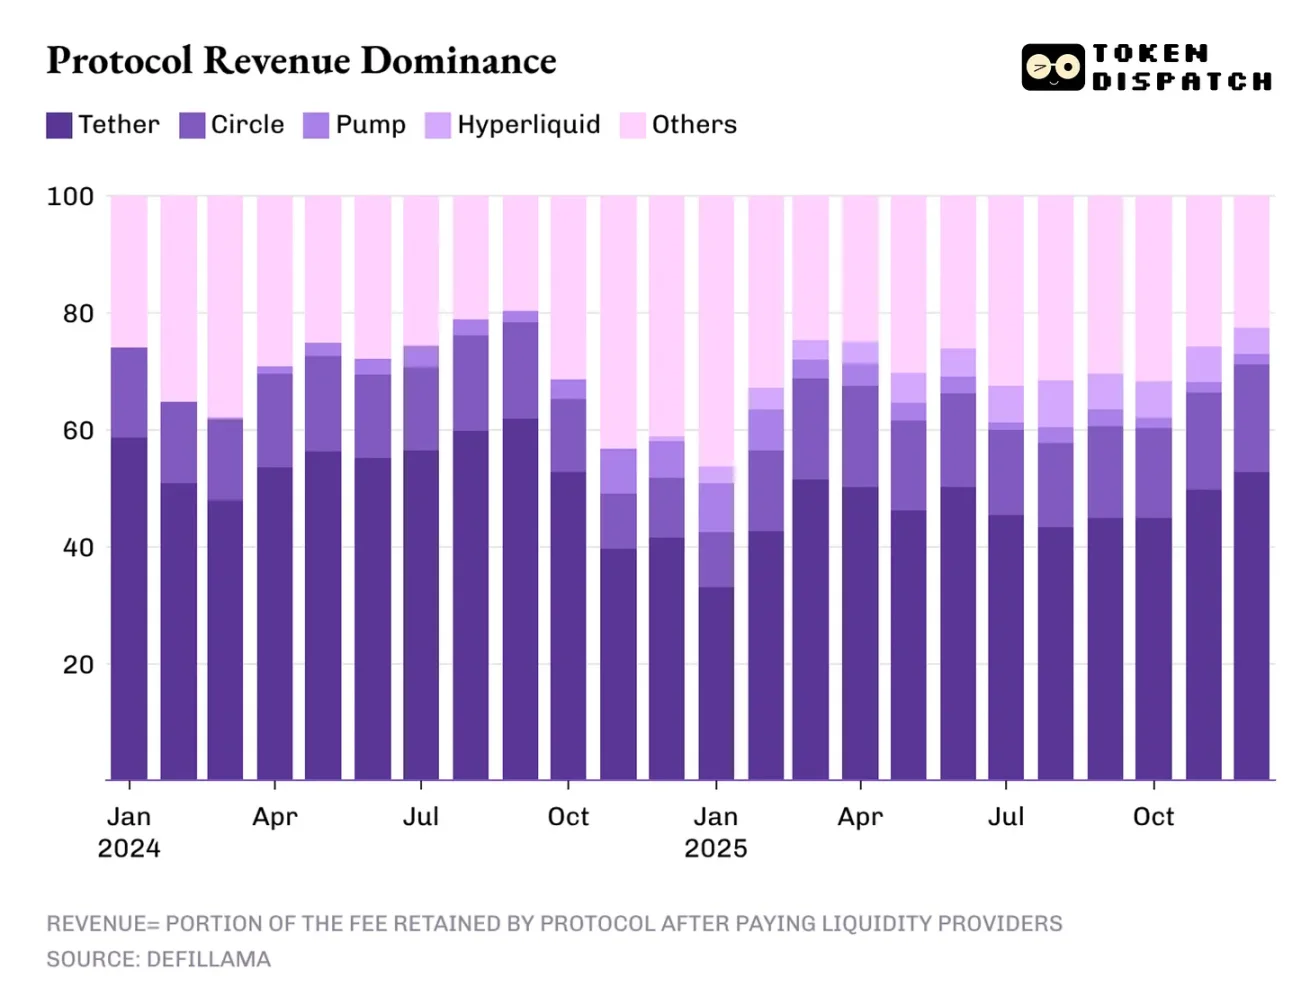
The top two stablecoin issuers, Tether and Circle, contributed over 60% of the crypto industry's total revenue. In 2025, their market share slightly decreased from about 65% in 2024 to 60%.
But the performance of decentralized perpetual contract exchanges in 2025 cannot be underestimated; this track was almost insignificant in 2024. Four platforms—Hyperliquid, EdgeX, Lighter, and Axiom—collectively accounted for 7% to 8% of the industry's total revenue, far exceeding the combined revenue of mature DeFi tracks such as lending, staking, cross-chain bridges, and decentralized exchange aggregators.
So, what will drive revenue in 2026? I found the answer in the three major factors that influenced the crypto industry's revenue landscape last year: spread income, trade execution, and distribution channels.
Spread trading means that whoever holds and transfers funds can profit from the process.
The revenue model of stablecoin issuers is both structural and fragile. Its structural nature lies in the fact that revenue scales with the supply and circulation of stablecoins; every digital dollar issued by the issuer is backed by U.S. Treasury bonds and generates interest. The fragility lies in the fact that this model relies on macroeconomic variables that the issuer has almost no control over: the Federal Reserve's interest rates. Now, the monetary easing cycle has just begun, and as interest rates are further cut this year, the dominant revenue position of stablecoin issuers will weaken accordingly.
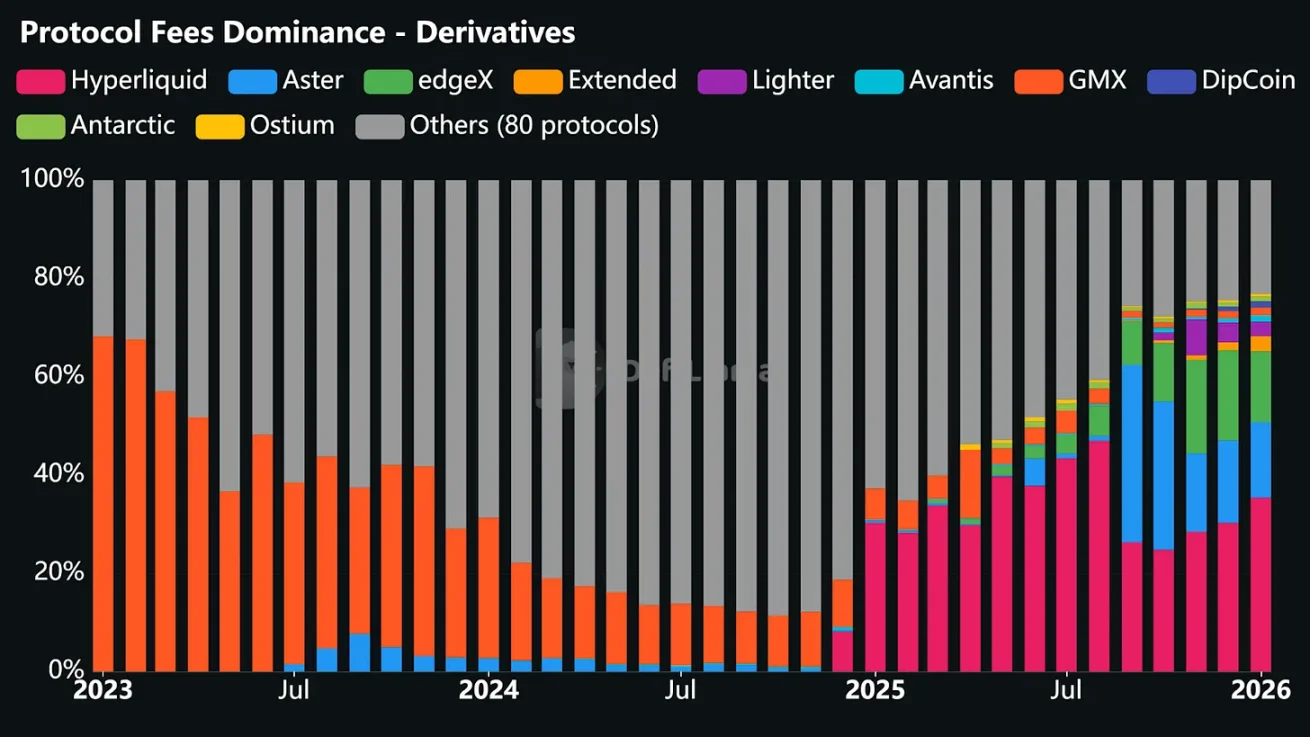
Next is the trade execution layer, which is the birthplace of the most successful track in the DeFi space in 2025: decentralized perpetual contract exchanges.
The simplest way to understand why decentralized perpetual contract exchanges quickly captured a significant market share is to see how they help users complete trading operations. These platforms create low-friction trading venues where users can enter and exit risk positions as needed. Even if market volatility is flat, users can still hedge, leverage, arbitrage, adjust positions, or build positions early for future layouts.
Unlike spot decentralized exchanges, decentralized perpetual contract exchanges allow users to conduct continuous, high-frequency trades without the hassle of transferring underlying assets.
Although the logic of trade execution sounds simple and the operation speed is extremely fast, the technical support behind it is far more complex than it appears. These platforms must build stable trading interfaces that do not crash under high load; create reliable order matching and liquidation systems that remain stable in market chaos; and provide sufficient liquidity depth to meet traders' needs. In decentralized perpetual contract exchanges, liquidity is the key to victory: whoever can continuously provide ample liquidity will attract the most trading activity.
In 2025, Hyperliquid dominated the decentralized perpetual contract trading track with the most market makers providing ample liquidity on its platform. This also made the platform the decentralized perpetual contract exchange with the highest fee income for 10 of the 12 months last year.
Ironically, the success of these DeFi track perpetual contract exchanges is precisely because they do not require traders to understand blockchain and smart contracts but instead adopt the familiar operational model of traditional exchanges.
Once all the above issues are resolved, exchanges can achieve automated revenue growth by charging small fees for traders' high-frequency, large-volume trades. Even if spot prices are range-bound, revenue can continue because the platform provides traders with a wealth of operational choices.
This is precisely why I believe that although decentralized perpetual contract exchanges accounted for only a single-digit percentage of revenue last year, they are the only track that could potentially challenge the dominance of stablecoin issuers.
The third factor is distribution channels, which bring incremental revenue to crypto projects such as token issuance infrastructure, like pump.fun and LetsBonk platforms. This is not much different from the models we see in Web2 companies: Airbnb and Amazon do not own any inventory, but with their vast distribution channels, they have long surpassed the定位 of aggregation platforms and also reduced the marginal cost of new supply.
Crypto token issuance infrastructure similarly does not own the crypto assets such as Meme coins, various tokens, and micro-communities created through their platforms. But by creating a frictionless user experience, automating the listing process, providing ample liquidity, and simplifying trading operations, these platforms have become the preferred choice for people to issue crypto assets.
In 2026, two questions may determine the development trajectory of these revenue drivers: Will the industry revenue share of stablecoin issuers fall below 60% as interest rate cuts impact spread trading? Can perpetual contract trading platforms break through the 8% market share as the landscape of the trade execution layer becomes concentrated?
Spread income, trade execution, and distribution channels—these three factors reveal the sources of revenue in the crypto industry, but this is only half the story. Equally important is understanding what proportion of the total fees is allocated to token holders before the protocol retains net revenue.
Value transfer through token buybacks, burns, and fee sharing means that tokens are no longer just governance credentials but represent economic ownership of the protocol.
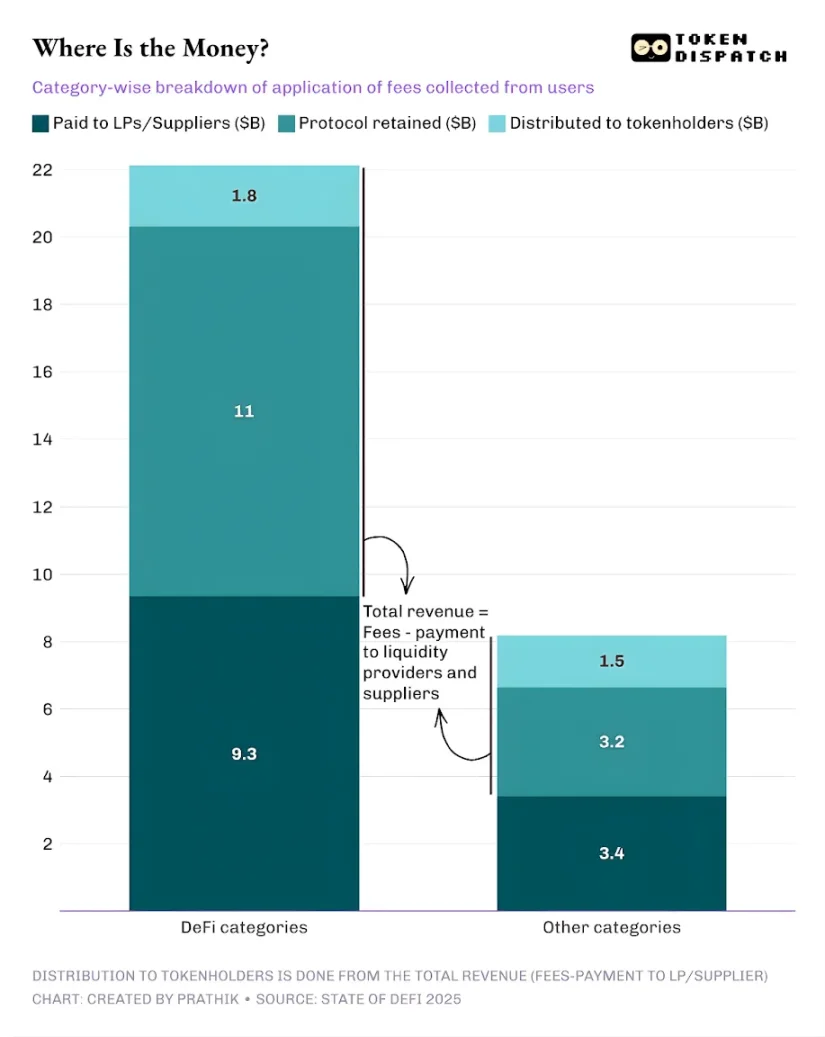
In 2025, the total fees paid by users of decentralized finance and other protocols were approximately $30.3 billion. Of this, the revenue retained by the protocols after paying liquidity providers and suppliers was about $17.6 billion. About $3.36 billion of the total revenue was returned to token holders through staking rewards, fee sharing, token buybacks, and burns. This means that 58% of the fees were converted into protocol revenue.
This is a significant shift compared to the previous industry cycle. More and more protocols are beginning to experiment with making tokens represent ownership claims on operational performance, providing investors with tangible incentives to continue holding and going long on the projects they favor.
The crypto industry is far from perfect, and most protocols still do not distribute any收益 to token holders. But from a macro perspective, the industry has undergone considerable changes, a signal that everything is moving in a good direction.
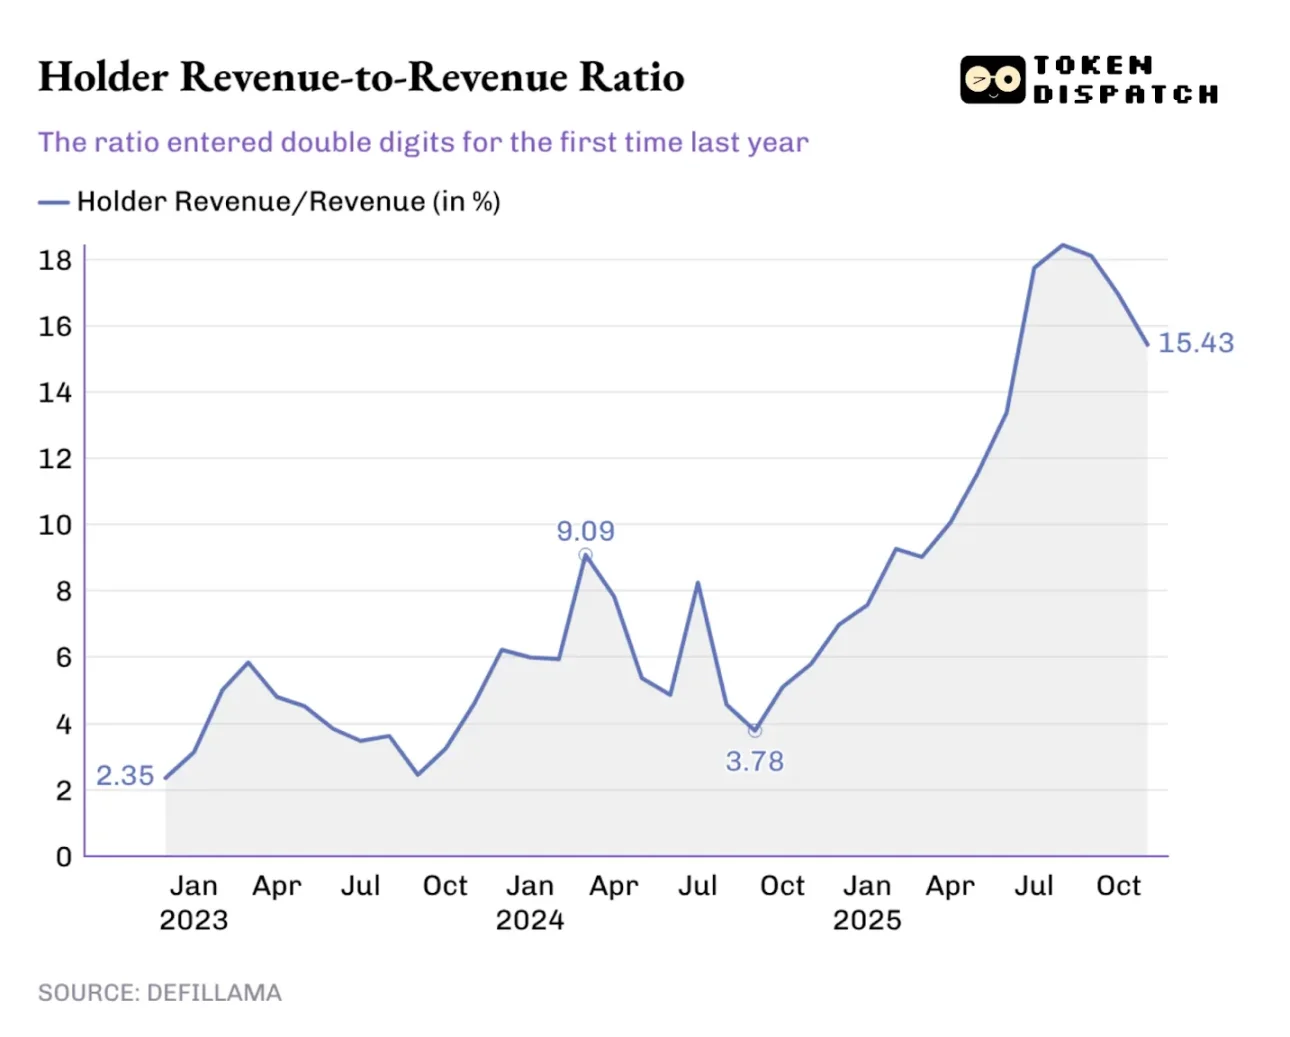
Over the past year, the proportion of token holder收益 to total protocol revenue has continued to rise, breaking through the historical high of 9.09% early last year and even exceeding 18% at its peak in August 2025.
This change is also reflected in token trading: If the tokens I hold never bring any return, my trading decisions will only be influenced by media narratives; but if the tokens I hold can bring me收益 through buybacks or fee sharing, I will regard them as interest-bearing assets. Although they may not be safe and reliable, this shift will still affect how the market prices tokens, making their valuation closer to fundamentals rather than being swayed by media narratives.
When investors look back at 2025 and try to predict where crypto industry revenue will flow in 2026, incentive mechanisms will be an important consideration. Last year, project teams that prioritized value transfer did stand out.
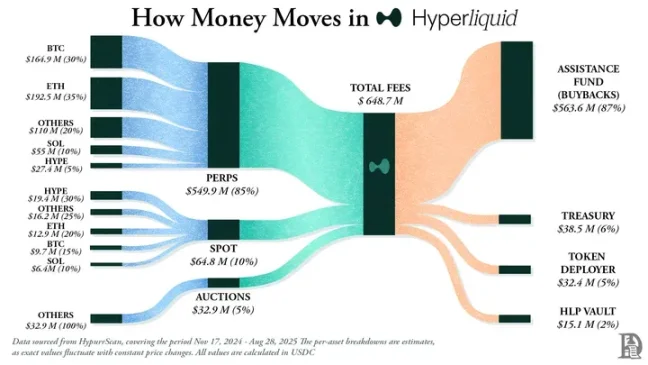
Hyperliquid built a unique community ecosystem, returning about 90% of its revenue to users through the Hyperliquid Aid Fund.
Among token issuance platforms, pump.fun strengthened the concept of "rewarding active platform users" and has burned 18.6% of the circulating supply of the native token PUMP through daily buybacks.
In 2026, "value transfer" is expected to no longer be a niche choice but a necessary strategy for all protocols that want their tokens to trade based on fundamentals. Last year's market changes taught investors to distinguish between protocol revenue and token holder value. Once token holders realize that the tokens in their hands can represent ownership claims, returning to the previous model seems irrational.
I believe that the "2025 DeFi Industry Report" did not reveal a completely new nature of the crypto industry's exploration of revenue models; this trend has been hotly discussed over the past few months. The value of this report lies in using data to reveal the truth, and after digging deep into this data, we can find the secret to the most likely revenue success in the crypto industry.
By analyzing the revenue dominance trends of various protocols, the report clearly points out: whoever controls the core channels, spread income, trade execution, and distribution channels will earn the most profits.
In 2026, I expect more projects to convert fees into long-term returns for token holders, especially as the attractiveness of spread trading declines due to the interest rate cut cycle, making this trend even more apparent.
Twitter:https://twitter.com/BitpushNewsCN
Bitpush TG Communication Group:https://t.me/BitPushCommunity
Bitpush TG Subscription: https://t.me/bitpush