Solana overtakes major CEXs with $1.6T spot volume – Details

ambcryptoPublicado em 2026-01-05Última atualização em 2026-01-05

Resumo

Solana recorded the second-highest spot trading volume in 2025, reaching $1.6 trillion, surpassing all major centralized exchanges except Binance. This represents a significant shift, as Solana's share of total spot activity grew from barely 1% three years ago to 12% by January 4th, 2025. The change reflects a gradual migration of liquidity toward faster and cheaper blockchain networks. This growth is supported by an increase in stablecoin supply on Solana, which has risen alongside its trading volumes. While Ethereum still holds the largest stablecoin share and Tron remains a major hub, Solana is quickly closing the gap. Stablecoins serve as essential fuel for spot trading, creating a reinforcing cycle where liquidity attracts volume and volume sustains liquidity. Additionally, SOL's price has shown strong momentum, breaking above $130 after a period of consolidation. Technical indicators, including an RSI around 58, a move above the 20-day moving average, and a positive MACD, suggest continued upward potential. Overall, Solana’s performance highlights the growing role of high-performance blockchains as serious competitors to centralized exchanges, contributing to a more fragmented and decentralized market structure.

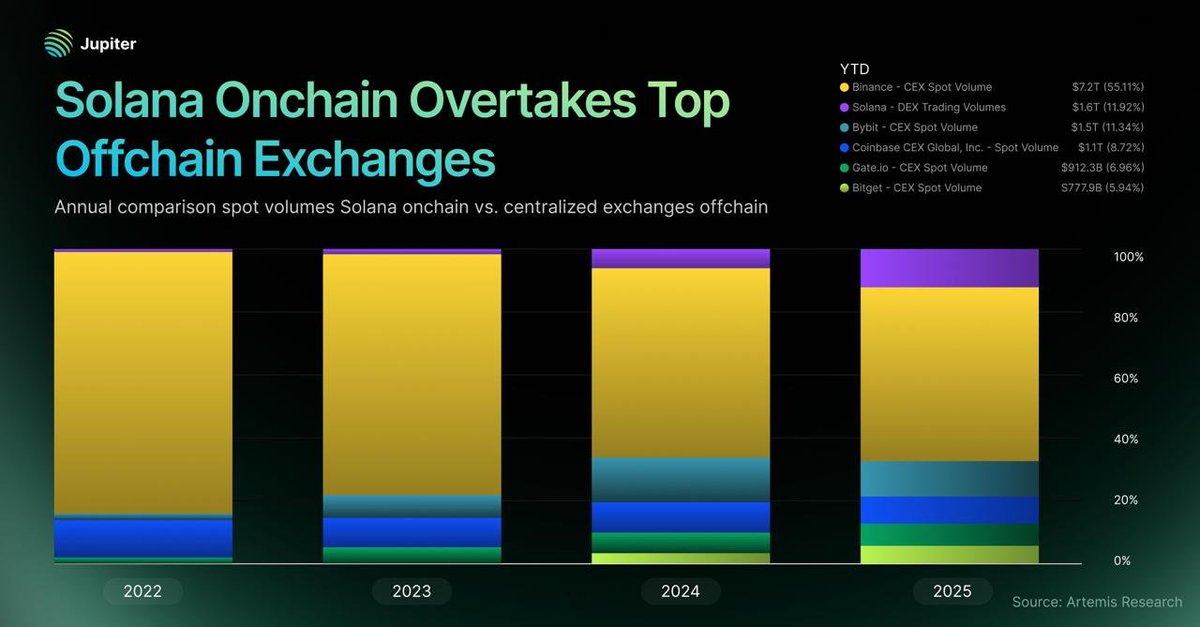
Solana [SOL] recorded the second-highest Spot Volume in 2025, behind only Binance [BNB]! As it surges ahead, liquidity and stablecoin supply are moving toward high-functioning blockchains. Here’s the rundown.

Is crypto trading going through a change?

In 2025, Solana’s on-chain Spot Volumes reached $1.6 trillion, overtaking every centralized exchange except Binance. Just three years ago, Solana accounted for barely 1% of total Spot activity. On the 4th of January, that figure was at 12%, according to Jupiter data.

Source: X

The change has been gradual, with liquidity moving toward faster, cheaper networks.

One does wonder… if Solana [SOL] surpasses platforms like Coinbase, Bybit, and Bitget, where does real market activity live? Even Binance’s dominance has narrowed, so there’s a more fragmented market structure.

Liquidity follows speed

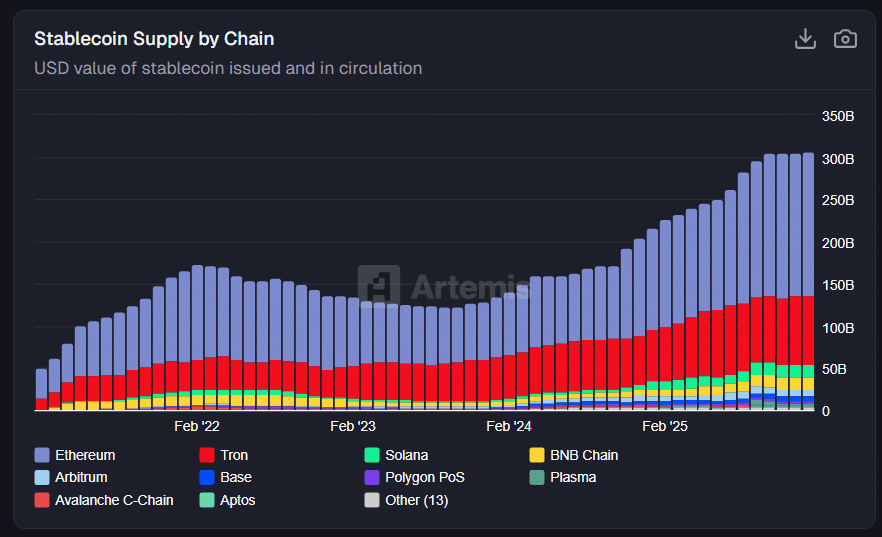
While Ethereum [ETH] still holds the largest share of Stablecoin Supply, there’s been a clear redistribution since early 2024. Solana’s Stablecoin Supply, once negligible, has climbed alongside its rise in on-chain trading volumes.

Tron [TRX] is also a major hub for stablecoins, but newer networks are beginning to close the gap.

Source: Artemis

Stablecoins are the fuel for Spot trading. As more of that capital settles on chains like Solana, there’s a loop of sorts (liquidity attracts volume, and volume keeps liquidity steady).

Price is moving too

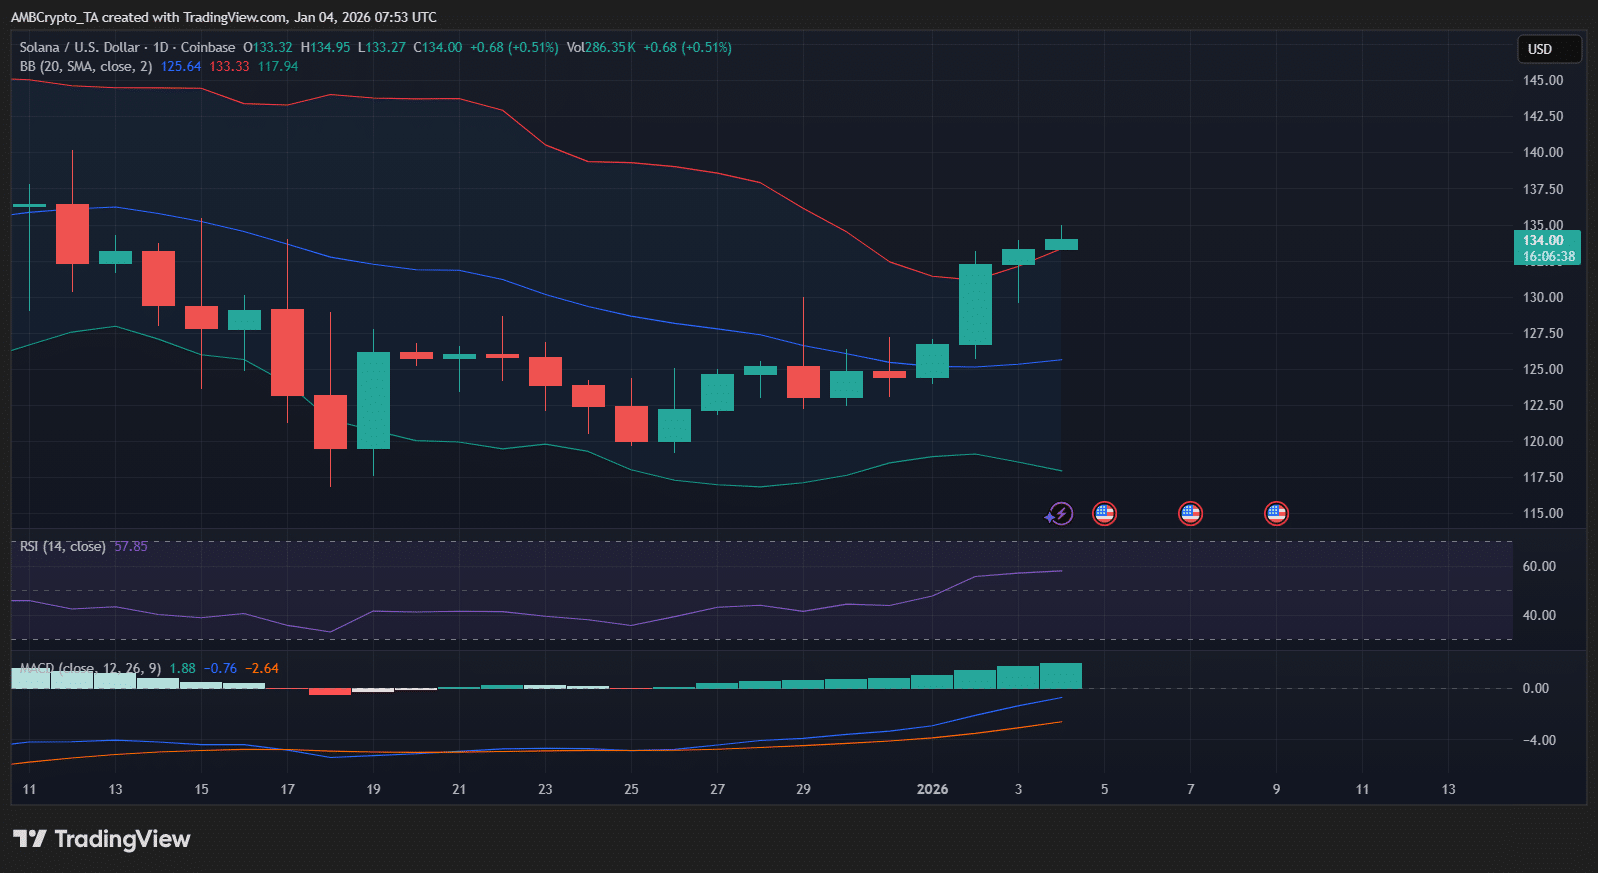
After weeks of consolidation, SOL has pushed back above the $130 level. The move has helped regain the ground lost during the end-of-year pullback. With steady movement, many long-term plays are probably afoot.

Source: TradingView

The RSI was around 58, with what looks like room for continuation.

Price had also pushed above the 20-day MA and is pressing toward the mid-range of the Bollinger Bands. MACD has flipped positive, too. Put together, all this is a show of strong upside momentum, with a setup that favors follow-through.


Final Thoughts

  • Solana hits $1.6 trillion on-chain spot volume in 2025!
  • High-performance blockchains like Solana are emerging as serious contenders to CEXs.
Next: TRUMP memecoin jumps 15% – What traders should watch next
Share
  • Share
  • Tweet

Criptomoedas em alta

Perguntas relacionadas

QWhat was Solana's spot trading volume in 2025 and how does it rank compared to centralized exchanges?

ASolana recorded $1.6 trillion in on-chain spot volume in 2025, ranking second highest overall and surpassing all centralized exchanges except Binance.

QWhat percentage of total spot activity did Solana account for on January 4th according to Jupiter data?

ASolana accounted for 12% of total spot activity on January 4th, according to Jupiter data.

QWhat two key factors are driving liquidity movement according to the article?

ALiquidity is moving toward faster and cheaper blockchain networks, with high-performance chains like Solana attracting more trading activity and stablecoin supply.

QWhat technical indicators suggest strong upside momentum for SOL's price?

AThe RSI at around 58, price above the 20-day moving average, movement toward the mid-range of Bollinger Bands, and a positive MACD flip all indicate strong upside momentum for SOL.

QHow has Solana's stablecoin supply changed since early 2024?

ASolana's stablecoin supply, which was once negligible, has climbed significantly since early 2024 alongside its rise in on-chain trading volumes.

Leituras Relacionadas

BPI: Digital Gold Least Popular Bitcoin Narrative, as Implementation Methods Defy Concepts

A national study by the Bitcoin Policy Institute (BPI) reveals that the "digital gold" narrative for Bitcoin holds little appeal for everyday Americans. The research, conducted with Cygnal and Neighborhood Bitcoin, involved surveys and focus groups with registered voters. Key barriers to adoption included concerns over control of the asset, security, accessibility, and ease of use. Messaging focused on personal control (e.g., "you decide how much") or Bitcoin as "freedom money" (savings that can't be frozen by banks or governments) resonated much more strongly than the "digital gold" concept. The study also found potential buyers are more influenced by stories from peers like friends, family, or financial advisors than by abstract narratives. After exposure to effective messages, the share of those "extremely" or "very" interested in owning Bitcoin rose from 19% to 24%. A separate Federal Reserve Bank of Cleveland research paper analyzed household data from 2018-2025. It found that expectations of Bitcoin's returns were a stronger driver of ownership than all demographic factors combined. For example, in 2021, Bitcoin holders expected a 22% annual return versus just 7% for non-holders. An experiment in 2025 showed that informing participants about Bitcoin's past performance (14.3% return) increased their planned crypto investments by 47% and raised their likelihood of purchasing by 23%. U.S. household crypto ownership grew from under 2% in 2018 to about 12% in 2025.

cryptonews.ruHá 7m

BPI: Digital Gold Least Popular Bitcoin Narrative, as Implementation Methods Defy Concepts

cryptonews.ruHá 7m

The Most Difficult Thing Here Is to Buy. What Bitcoin Needs for Growth

The article discusses the recent 25% surge in Bitcoin's price from mid-August, pushing it back to around $80,000. However, analysts from Galaxy Research suggest that for this to confirm a definitive trend reversal from a bear market, Bitcoin needs to sustainably break above a key technical level: the 50-week simple moving average (SMA), located slightly above $81,000. Historically, this level has acted as significant resistance, often taking weeks to overcome decisively. Experts note that the 50-week SMA is a widely followed indicator, making it a self-fulfilling prophecy for support and resistance. While the current upward move is seen as a strong breakout, the path forward may not be straightforward. Analysts point to historical patterns where Bitcoin traded near this average for weeks or even months after an initial break. The macroeconomic backdrop is mixed, with the US Federal Reserve yet to cut interest rates and the US Treasury's plans to increase debt buybacks adding to market uncertainty. High long-term bond yields are also putting pressure on riskier assets like cryptocurrencies. Some experts caution that the recent sharp rally was partly driven by technical factors like high trader leverage, and sustained growth will likely depend on continued institutional demand through Bitcoin ETFs. The consensus is that while a cycle bottom may be in, navigating the volatility and potential resistance on the way to higher prices, such as $100,000, remains challenging.

cryptonews.ruHá 10m
The Most Difficult Thing Here Is to Buy. What Bitcoin Needs for Growth

cryptonews.ruHá 10m

Trading

Spot

Artigos em Destaque

Como comprar T

Bem-vindo à HTX.com!Tornámos a compra de Threshold Network Token (T) simples e conveniente.Segue o nosso guia passo a passo para iniciar a tua jornada no mundo das criptos.Passo 1: cria a tua conta HTXUtiliza o teu e-mail ou número de telefone para te inscreveres numa conta gratuita na HTX.Desfruta de um processo de inscrição sem complicações e desbloqueia todas as funcionalidades.Obter a minha contaPasso 2: vai para Comprar Cripto e escolhe o teu método de pagamentoCartão de crédito/débito: usa o teu visa ou mastercard para comprar Threshold Network Token (T) instantaneamente.Saldo: usa os fundos da tua conta HTX para transacionar sem problemas.Terceiros: adicionamos métodos de pagamento populares, como Google Pay e Apple Pay, para aumentar a conveniência.P2P: transaciona diretamente com outros utilizadores na HTX.Mercado de balcão (OTC): oferecemos serviços personalizados e taxas de câmbio competitivas para os traders.Passo 3: armazena teu Threshold Network Token (T)Depois de comprar o teu Threshold Network Token (T), armazena-o na tua conta HTX.Alternativamente, podes enviá-lo para outro lugar através de transferência blockchain ou usá-lo para transacionar outras criptomoedas.Passo 4: transaciona Threshold Network Token (T)Transaciona facilmente Threshold Network Token (T) no mercado à vista da HTX.Acede simplesmente à tua conta, seleciona o teu par de trading, executa as tuas transações e monitoriza em tempo real.Oferecemos uma experiência de fácil utilização tanto para principiantes como para traders experientes.

714 Visualizações TotaisPublicado em {updateTime}Atualizado em 2026.06.02

Como comprar T

Discussões

Bem-vindo à Comunidade HTX. Aqui, pode manter-se informado sobre os mais recentes desenvolvimentos da plataforma e obter acesso a análises profissionais de mercado. As opiniões dos utilizadores sobre o preço de T (T) são apresentadas abaixo.

活动图片