Don't Be Fooled by the Rebound! Bitcoin Could Retest Lows at Any Moment | Exclusive Analysis

marsbitPublicado em 2025-12-08Última atualização em 2025-12-08

Resumo

**Bitcoin Weekly Analysis: Beware of a Potential Secondary Pullback** Last week, Bitcoin experienced significant volatility, forming a weekly doji candle with a slight gain of 0.03% and a wide 12.36% range. The price action perfectly validated the pre-defined key level of $89,000. Our analyst successfully executed two short-term trades based on this framework, resulting in a total gain of 6.93%. **Technical Outlook:** The weekly chart indicates Bitcoin is on the verge of entering a bear market, with momentum indicators pointing south. The daily chart shows a weakening bullish rebound within a broader bearish structure. **Price Projections for the Week (Dec 8-14):** The market is expected to remain range-bound. Key resistance levels are identified at $91,000, $94,000-$96,500, and $98,500-$100,000. Crucial support zones lie at $85,500-$87,500, $83,500, and around $80,000. **Trading Strategy:** A core medium-term short position (65% allocation) is maintained. For short-term swings (30% allocation), two scenarios are outlined: * **Scenario A (Rebound & Short):** Sell into strength if the price rallies to the $91,000-$94,200 or $98,500 resistance zones, with a stop-loss above $100,000. * **Scenario B (Dip & Buy):** Buy a potential bounce if the price drops to the $83,500-$80,000 support area, with a stop-loss below $80,000. **Macro Focus: The Fed's "Super Week":** This week's price action is heavily dependent on the Federal Reserve's policy decision. While a December rate...

Market Analyst Conaldo, Master of Financial Statistics from Columbia University, USA, focused on quantitative trading of US stocks during university and gradually expanded into digital assets such as Bitcoin. He has built a systematic quantitative trading model and risk control system through practical experience; possesses keen data insight into market fluctuations and is committed to continuous深耕 in the professional trading field, pursuing stable returns; will delve into BTC technical, macro, and capital flow changes weekly, review and display practical strategies, and preview noteworthy upcoming events for reference.
Trading Weekly Report Core Summary: Last week's trading strictly followed the established strategy, successfully completed two short-term operations, achieving a cumulative return of 6.93%. The following will detail the market forecast, strategy execution, and specific trading process.

I. Bitcoin Market Review Last Week (12.01~12.07)

1. Review of Last Week's Core Views and Operation Strategies:

In last week's journal, the author clearly stated: Using $89,000 as the bull-bear dividing line for研判, and formulated corresponding operation strategies accordingly. The specific content review is as follows:

1. Market Trend Prediction Review: Regarded $89,000 as the short-term key watershed. If it can provide effective support, the price is expected to rebound upwards; if it is effectively broken below, it will initiate a downward探底.

Core Resistance Levels:

  • First Resistance Zone: $94,000~$96,500
  • Second Resistance Zone: $98,500~$100,000

Core Support Levels:

  • First Support Level: Near $89,000
  • Second Support Level: $85,500~$88,000 area
  • Important Support Level: Near $80,500

2. Operation Strategy Review:

  • Mid-term Strategy: Maintain about 65% mid-term short position.
  • Short-term Strategy: All short-term operations are based on the final decision of the gain or loss of $89,000, and two sets of plans were formulated:
  • Plan A: If the $89,000 support is effective, when the price rebounds to the $94,000-$96,500 interval and shows resistance signals, initially establish a 10% short position, stop loss set above $100,000. If the rebound continues to near $98,500 and encounters resistance again, add an additional 20% short position, unified stop loss above $100,000.
  • Plan B: If the price effectively breaks below $89,000, directly establish a 20% short position, stop loss set near $92,000.
  • Unified Closing Rule: When the price runs near the aforementioned important support levels​ and shows bottom resistance signals,酌情 close part or all of the short-term positions for profit.

2. Last week, two short-term operations were successfully completed as planned (Figure 1), achieving a cumulative return of 6.93%. Specific trading details and review are as follows:

Bitcoin 30-minute K-line Chart: (Momentum Quantitative Model + Spread Trading Model)
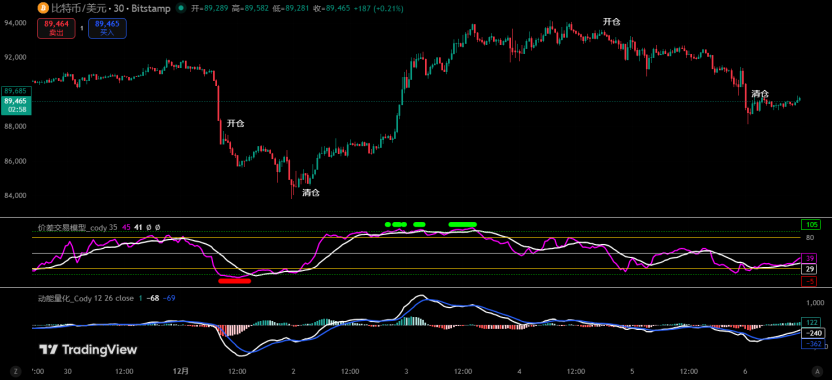
Figure 1

1. Trading Details Summary:

2. First Trade (Profit 2.14%): This operation was a classic execution of Plan B. After the Bitcoin price effectively broke below the key point of $89,000, decisively established a 20% short position at $87,103, and finally took profit near the second support area of $84,989. This operation perfectly reflected the trading discipline of "following the break".

3. Second Trade (Profit 4.44%): This operation was the precise implementation of Plan A. After the price found support at $89,000 and rebounded, patiently waited for it to enter the first resistance zone ($94,000~$96,500). When the price showed a signal at $93,321, established a 10% short position as planned, successfully capturing the subsequent回调 band, and took profit near $89,355.

4. Profit Summary: Last week's strategy execution had a high degree of fit with the market. Both trades strictly followed the preset entry, stop loss, and closing rules, successfully converting market fluctuations into actual profits, with a total profit of 6.93%, verifying the effectiveness of the previous strategy framework.

3. Review of Bitcoin Core Data Last Week:

  • Opening Price​​: $90,369
  • Lowest​ Price​: $83,814 (Monday)
  • Highest Price​​: $94,172 (Wednesday)
  • Closing​ Price​: $90,405
  • Price Change: Weekly increase 0.03%, maximum amplitude 12.36%
  • Trading Volume: $13.429 billion
  • Trend: Wide-range fluctuation, weekly chart closed with a "cross star" K-line with upper and lower shadows

4. Review of Actual Market Movement Last Week:

Last week, Bitcoin showed a typical "violent wide-range fluctuation" pattern, with a曲折 trend. The week finally closed up 0.03%, forming a "cross star"阳 K-line with upper and lower shadows. Specifically, after opening on Monday, the price quickly dived, effectively breaking through the key support of $89,000,探底 to a low of $83,814 before stabilizing and rebounding, closing down 4.53% for the day. In the following two days, the market上演 a "V"-shaped reversal, with prices continuing to rise, not only recovering all Monday's losses but also once touching the weekly high of $94,172, with a cumulative increase of 8.18% over two trading days. After mid-week, the market weakened again, with prices falling 4.45% cumulatively over two consecutive days before转入 narrow fluctuations until the weekend. It is worth noting that the mid-week high of $94,172高度吻合 with the lower limit of the first resistance zone of $94,000~$96,500 predicted by the author last week,differing by only $172. This再次验证 the accuracy of the previous judgment on key resistance levels.

II. Systematic Technical Analysis: Comprehensive研判 Based on Multi-Model and Multi-Dimensional Analysis

Combining last week's market operation, the author will conduct an in-depth analysis of the evolution of Bitcoin's internal structure using multi-dimensional analysis models.

Weekly Level:
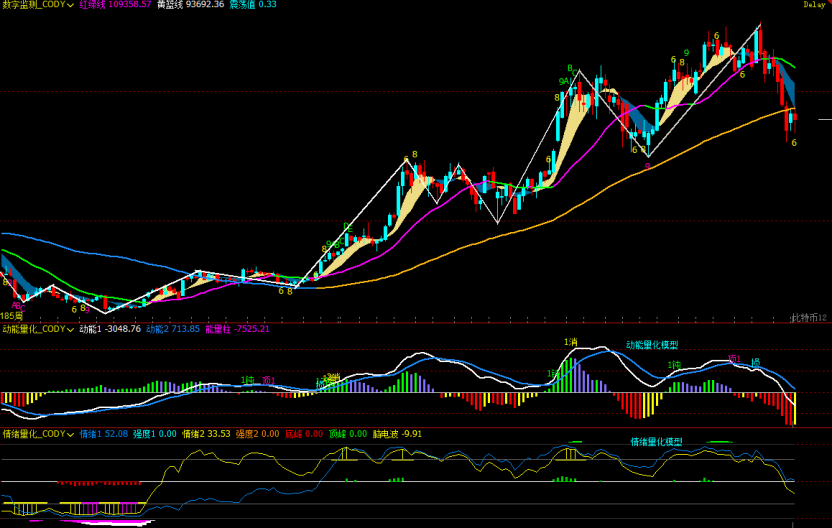
Figure 2

1. As shown in (Figure 2), analysis from the weekly chart:

  • Momentum Quantitative Model: After last week's movement, the two momentum lines continue to run downward, with the white momentum line having been below the zero axis for three weeks, and the blue momentum line about to cross below the zero axis. After two consecutive weeks of oversold rebound, the energy (negative) column has begun to shorten compared to previous weeks. The多头 force must now organize a relatively strong counterattack to pull the two momentum lines back above the zero axis, otherwise the空头 will release greater shorting energy.

Momentum Quantitative Model Indicates: Price decline index: High

  • Sentiment Quantitative Model: Blue sentiment line value 52.08, intensity zero; yellow sentiment line value 33.53, intensity zero, peak value is 0.

Sentiment Quantitative Model Indicates: Price pressure and support index: Neutral

  • Digital Monitoring Model: No digital signals shown currently.

The above data indicates: Bitcoin is in a downward trend, and the weekly level is about to enter a bear market.

Daily Level:
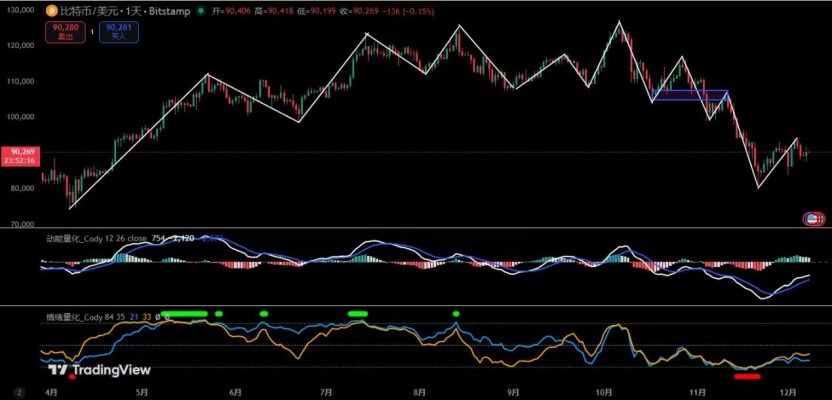
Figure 3

2. As shown in (Figure 3), analysis from the daily chart:

  • Momentum Quantitative Model: After a week of rebound, the two momentum lines continue to run upward below the zero axis and are gradually approaching the zero axis, but the energy column is gradually shortening compared to previous days.

Momentum Quantitative Model Indicates: The momentum of the多头 rebound is gradually exhausting.

  • Sentiment Quantitative Model: Blue sentiment line 21, intensity zero; yellow sentiment line 32, intensity zero.

Sentiment Quantitative Model Indicates: Pressure and support index: Neutral

The above data suggests: The daily level is in a bear market, an oversold rebound is in progress, but shows signs of weakening.

III. This Week's Market Forecast (12.08~12.14)

1. It is预计 that the price will maintain区间震荡 this week with high probability. The author divides the market into three areas, namely $94200~$91000~$87500~$83500. It is currently fluctuating narrowly within the $91,000~$87,000 range, and the market will choose a direction next.

2. Resistance Levels: First resistance at $91,000, second resistance at the $94,000~$96,500 area, important resistance at the $98,500~$100,000 area.

3. Support Levels: First support at the $85,500~$87,500 area, second support at $83,500, important support near $80,000.

IV. This Week's Operation Strategy (Excluding the Impact of Sudden News)

1. Mid-term Strategy: Maintain about 65% mid-term position (short).

2. Short-term Strategy: Utilize 30% of the position, set stop loss points, and look for "spread" opportunities based on support and resistance levels. (Using 60 minutes/240 minutes as the operation cycle).

3. Based on the high probability of区间震荡 this week, the author formulates the following two sets of plans for short-term operations to cope with market movements.

Plan A: If the market fluctuates upwards at the beginning of the week: (Selling on rebounds)

  • Open Position: If the price rebounds to the $91,000~$94,200 area and shows resistance, establish a 15% short position.
  • Add Position: If the price continues to rebound to near $98,500 and encounters resistance again, add another 15% short position.
  • Risk Control: All short stops are set above $100,000.
  • Reduce Position: When the price falls after the rebound ends and shows resistance near the first support level, close 50% of the position.
  • Close Position: If the price continues to fall to the second support level area and shows resistance, close all remaining positions to complete the trade.

Plan B: If it effectively breaks below the $87,500 support at the beginning of the week and探底 downwards: (Buying the deep dip for a rebound)

  • Open Position: If the price falls to the $83,500~$80,000 area and shows a bottom signal, establish a 15% long position.
  • Risk Control: Stop loss set below $80,000.
  • Close Position: When the price rebounds to the $87,500~$88,000 area and shows resistance signals, close all positions for profit.

V. Special Notes:​​

1. When opening a position: Immediately set the initial stop loss.

2. When profit reaches 1%: Move the stop loss to the opening cost price (break-even point) to ensure capital safety.

3. When profit reaches 2%: Move the stop loss to the position of 1% profit.

4. Continuous Tracking: Thereafter, for every additional 1% profit the price makes, move the stop loss同步 by 1%, dynamically protecting and locking in existing profits.

(Note: The above 1% profit trigger threshold can be flexibly adjusted by investors according to their own risk preference and标的 volatility.)

VI. Macro and Capital Flow Analysis (12.8~12.14):

This week is the most critical "Super Central Bank Week" for global financial markets before the end of the year. The core focus is on the December Fed interest rate decision, the update of the dot plot, and Powell's speech. Although the market almost unanimously believes that this meeting will cut interest rates, what really determines risk assets (including Bitcoin) is not the rate cut itself, but the Fed's guidance on the 2025 rate cut path. Therefore, this week's macro and capital structure will revolve around the "expectation gap," and asset price fluctuations are expected to significantly放大.

From a macro perspective, key data is密集 this week: Tuesday's US JOLTs job openings will reveal the extent of the cooling labor market. If it continues to weaken, it will strengthen the logic of提前 rate cuts; Wednesday's Chinese CPI and social financing will determine the direction of Asian demand and liquidity; Friday's UK GDP and European CPI will affect global synchronized easing expectations. However, the importance of these data is significantly weaker than the Fed meeting, and the market整体 enters a state of "waiting for the Fed to give the answer."

The tone of this Fed meeting is almost locked in for a "December rate cut," but the dot plot will determine the market's direction for the next 3~6 months. If the dot plot is hawkish,暗示 only 0~1 rate cuts in 2025, the market will quickly correct current easing expectations, leading to rising US bond yields, a stronger dollar, and short-term pressure on risk assets. BTC may even test the $85,000 area. If the dot plot is dovish,暗示 at least 2 rate cuts in 2025, it means the easing cycle may accelerate提前, risk assets will反弹 quickly, and BTC is expected to challenge above $90,000 again. Powell's speech will also further influence sentiment. Any wording emphasizing "sticky inflation" or "policy仍需保持 restrictive" will amplify short-term fluctuations.

From a capital flow perspective, the current market is整体 in a compressed state with an undetermined direction. BTC failed to effectively stand back above $90,000 over the weekend, but trading volume decreased significantly, indicating筹码换手 is slowing, retail sentiment is stable, and there is no panic selling. Institutional funds generally choose to reduce risk exposure before the "Super Central Bank Week," so there was no significant increase or withdrawal of positions last week, which is typical of the "pre-meeting interest rate window." The macro environment itself has no new negatives. US employment and inflation data continue to weaken,反而 increasing the probability of entering an easing cycle in the medium term. This is also an important reason why BTC can maintain strong fluctuations at high levels.

Overall, the core variable for BTC this week is not sentiment, nor liquidity, but whether the Fed will provide a rate cut path guidance consistent with market expectations. Favorable factors include: a very high probability of a December rate cut,持续 cooling employment and inflation, and the new Fed chairman is likely to be dovish. These factors all support further easing in 2025. Risks are mainly reflected in the dot plot being hawkish, Powell's rhetoric being tight, and a decrease in January rate cut expectations leading to short-term sentiment weakening.

In summary, this week is an important time window for determining the trend of risk assets in 2025. The Fed's dot plot and attitude will directly affect BTC's medium-term trend. Once the guidance is dovish, the market may usher in a year-end反弹; if it is hawkish, there may be a short-term回调, but it does not change the medium-term多头 structure. For BTC, this week's fluctuations are not only short-term price changes but also a repricing of future trends.


Criptomoedas em alta

Perguntas relacionadas

QWhat was the total return from the two short-term trading operations executed last week according to the analyst's report?

AThe total return from the two short-term trading operations executed last week was 6.93%.

QWhat key price level did the analyst identify as the short-term watershed (bull-bear line) for Bitcoin in the previous week's analysis?

AThe analyst identified $89,000 as the short-term key watershed (bull-bear line) for Bitcoin in the previous week's analysis.

QBased on the systematic technical analysis, what is the primary trend signaled by the Weekly Momentum Quant Model for Bitcoin?

AThe Weekly Momentum Quant Model signals that Bitcoin is in a downtrend and is about to enter a bear market on the weekly level.

QWhat is the main external event highlighted as the core focus for the global financial market and a key driver for Bitcoin's price this week (Dec 8-14)?

AThe main external event highlighted is the December Federal Reserve interest rate decision, including the updated dot plot and Chairman Powell's speech, which is referred to as the 'super central bank week'.

QWhat are the two primary contingency trading plans (Scheme A and Scheme B) proposed for short-term operations this week?

AScheme A (Rebound and Sell Short): Open a 15% short position if the price rebounds to the $91,000–$94,200 area and shows resistance. Scheme B (Buy the Deep Dip): Open a 15% long position if the price falls to the $83,500–$80,000 area and shows a bottoming signal.

Leituras Relacionadas

Wall Street's Most Famous 'Cassandra' Now Has His Sights Set on Nvidia

Michael Burry, the famed "Big Short" investor, has once again captured Wall Street's attention with a series of short positions against major tech and semiconductor stocks, most notably Nvidia. In late June and July, through his "Cassandra Unchained" newsletter, Burry disclosed short bets against Nvidia, Tesla, Applied Materials, Caterpillar, the SOXX semiconductor ETF, and later, Micron Technology. His core thesis revolves around potential distortions in the AI infrastructure boom, specifically questioning whether extended depreciation schedules (e.g., 6 years vs. a realistic 2-3 years for AI chips) by cloud giants like Microsoft and Google artificially inflate profits. He also raises concerns about possible "off-balance-sheet circular financing," where chip demand might be propped up by vendor-backed funding to clients. Nvidia's stock experienced volatility following these disclosures, briefly dipping but largely holding near Burry's reported entry points, leaving his positions roughly flat or slightly underwater as of late July. This move is part of a pattern for Burry, whose track record since his legendary 2008 bet is mixed. He has faced notable losses, such as on Tesla in 2021, while scoring on broader market turns like the 2020 pandemic crash. His methodology focuses intensely on free cash flow and scrutinizing original financial documents to spot overvaluation and structural risks, but it often struggles with timing the market. The article contrasts Burry's stance with other prominent investors. Steve Eisman, another "Big Short" figure, is not shorting Nvidia, citing strong fundamentals but expressing nervousness about sustainability. Jim Chanos agrees with the broad "accounting mismatch" concern—comparing it to the dot-com bubble—but targets financial leverage in private equity firms rather than the chip stocks themselves. While Nvidia's short interest remains relatively low at 1.3-1.4% of float, the massive stock size means absolute short losses have been significant, exceeding $5 billion earlier this year. The piece concludes that for ordinary investors, the key takeaway is not replicating specific short bets but learning from the critical frameworks these investors use: questioning rosy accounting, identifying structural vulnerabilities, and maintaining skepticism during market euphoria, even if pinpointing the exact catalyst for a downturn remains elusive.

marsbitHá 27m

Wall Street's Most Famous 'Cassandra' Now Has His Sights Set on Nvidia

marsbitHá 27m

Weekly Selection丨Epic Stock Market Volatility, Changxin Tech's IPO Reshapes Storage Landscape, Saylor Aims to Re-Anchor STRC Around September 8th

PANews Weekly Digest: Market Turmoil, Tech Breakthroughs, and Crypto Developments. The week saw significant volatility across global markets. South Korea's KOSPI index experienced extreme turbulence, including multiple trading halts, largely driven by sharp declines in AI hardware stocks like SK Hynix. In contrast, China's Changxin Xinqiao (CXC) achieved a landmark IPO with a market cap surpassing 4 trillion yuan, marking a major success for the domestic DRAM industry after a decade of losses. In the crypto and Web3 space, several key narratives emerged. AI is driving demand for new infrastructure, with projects like AI agent wallets and programmable payments gaining traction, attracting interest from firms like Coinbase. The Bitcoin mining sector is pivoting, with companies like MARA focusing on energy management as electricity becomes a core AI-era asset. Meanwhile, the RWA (Real World Assets) sector faces a "utilization puzzle," with hundreds of billions in on-chain assets remaining dormant. Notable market movements included a historic single-day surge of over 17% for the KOSPI index and a significant migration of $16.5 billion in staked ETH within the Lido ecosystem. Michael Saylor announced a target to re-peg the STRC stablecoin around September 8th. Other highlights include discussions on Ethereum's ambitious 2030 roadmap for scaling and privacy, analysis showing high protocol revenues not always translating to token price gains, and warnings from Citi about potential extreme commodity price shocks by late 2026.

marsbitHá 32m

Weekly Selection丨Epic Stock Market Volatility, Changxin Tech's IPO Reshapes Storage Landscape, Saylor Aims to Re-Anchor STRC Around September 8th

marsbitHá 32m

When the Market Begins to Question AI Capex: A Full Analysis of Q2 Earnings Reports from Five Tech Giants

In late July 2026, five major US tech giants—Alphabet, Intel, Microsoft, Meta, and Apple—released their Q2 earnings reports. While all companies exceeded revenue and profit expectations, driven by strong AI-related business growth, investor reactions diverged sharply due to concerns over escalating AI capital expenditures (capex) and their impact on free cash flow. Alphabet reported strong revenue growth and a surging cloud business, but its stock fell after announcing a doubled year-on-year capex and negative quarterly free cash flow for the first time. Intel posted its strongest revenue growth in over 15 years, but its stock experienced volatile trading after significantly raising its full-year capex guidance. Microsoft saw its stock surge after beating estimates and, crucially, lowering its capex forecast while projecting positive free cash flow. Meta faced the most severe sell-off as its profits declined despite revenue beats, with free cash flow plunging over 90% and its capex guidance raised. Apple reported record June-quarter results, but its stock plummeted after providing Q4 revenue guidance that fell short of expectations, citing supply chain constraints and forex headwinds. The overall takeaway is that the market's focus has shifted from validating AI demand to scrutinizing the timeline for returns on massive AI investments. Companies demonstrating a clearer path to managing capex and preserving free cash flow, like Microsoft, were rewarded, while those signaling continued aggressive spending faced investor skepticism.

Odaily星球日报Há 41m

When the Market Begins to Question AI Capex: A Full Analysis of Q2 Earnings Reports from Five Tech Giants

Odaily星球日报Há 41m

a16z: From Companies to DAOs, DUNA May Become the Next Generation Organizational Form

This article, "From Companies to DAOs: How DUNA Could Become the Next Organizational Form," traces the 500-year evolution of business collaboration. It begins with medieval structures like the *commenda* and Florentine *compagnia*, which exposed partners to personal risk. The modern corporation, exemplified by the Dutch East India Company (VOC), was a revolutionary leap, enabling large-scale, capital-intensive ventures by offering limited liability and reducing coordination costs. However, corporations introduced new challenges like principal-agent problems and bureaucratic overhead. The piece argues that software and internet-native protocols are now reducing these traditional overheads. Decentralized Autonomous Organizations (DAOs) emerged as a new model for coordination without centralized management. Yet, DAOs face a significant legal vacuum: they lack legal recognition, leaving members exposed to unlimited personal liability, and their tokens are vulnerable to being classified as securities under unclear regulations (e.g., the Howey Test). This has forced projects into suboptimal workarounds like offshore foundations. The article identifies the Decentralized Unincorporated Nonprofit Association (DUNA) as a potential solution. Recently legalized in states like Wyoming, the DUNA provides a legal wrapper for decentralized networks. It grants key protections—legal personality, limited liability, and perpetual existence—to a group without imposing a traditional hierarchical management structure. This allows token-holder communities to govern, hold assets, and contract as a single legal entity, aligning with their decentralized nature. While DUNA doesn't solve all governance challenges or magically resolve securities law questions, it represents a crucial step. It fills the legal recognition gap, offering a native legal form for internet-scale, decentralized collaboration and extending the separation of personal risk from organizational venture into a new domain.

marsbitHá 1h

a16z: From Companies to DAOs, DUNA May Become the Next Generation Organizational Form

marsbitHá 1h

2026 Mid-Year Report On-Chain RWA: Tokenized Stock Market Cap Doubles in a Year, But 90% of Rights Are Hollow Shells

The 2026 Mid-Year Report on On-Chain RWA highlights a significant growth in tokenized stock market capitalization, which nearly doubled from $951 million in March to $1.89 billion by July. However, the report reveals a fundamental contradiction in this "layer 2.5" ecosystem: products with the strongest legal foundation (like regulated U.S. infrastructure) lack liquidity and distribution, while freely tradable offshored wrapper products often lack substantive ownership rights. The increase is driven largely by a few products (SECZ, FGRS, STRCx) and platforms (Ondo, xStocks, Securitize collectively hold over 85% share). While distributed value across networks like Ethereum, Solana, and BNB Chain has grown, the market remains fragmented. Products referencing the same underlying asset (e.g., Apple stock) are distinct legal liabilities with different intermediaries and jurisdictional rules, offering varying degrees of legal claim. The report cautions that headline numbers are misleading, as they reflect changes in distributed token value—driven by issuance, conversions, and price movements—not pure investor inflows. True "canonical shares" with legal ownership, wide wallet distribution, institutional liquidity, and independent on-chain price discovery do not yet exist at scale. Tokenized treasuries show stronger product-market fit, and ETFs may be easier to scale than single stocks. The core takeaway is a trade-off: legal certainty versus liquidity and composability.

marsbitHá 2h

2026 Mid-Year Report On-Chain RWA: Tokenized Stock Market Cap Doubles in a Year, But 90% of Rights Are Hollow Shells

marsbitHá 2h

Trading

Spot

Artigos em Destaque

Como comprar T

Bem-vindo à HTX.com!Tornámos a compra de Threshold Network Token (T) simples e conveniente.Segue o nosso guia passo a passo para iniciar a tua jornada no mundo das criptos.Passo 1: cria a tua conta HTXUtiliza o teu e-mail ou número de telefone para te inscreveres numa conta gratuita na HTX.Desfruta de um processo de inscrição sem complicações e desbloqueia todas as funcionalidades.Obter a minha contaPasso 2: vai para Comprar Cripto e escolhe o teu método de pagamentoCartão de crédito/débito: usa o teu visa ou mastercard para comprar Threshold Network Token (T) instantaneamente.Saldo: usa os fundos da tua conta HTX para transacionar sem problemas.Terceiros: adicionamos métodos de pagamento populares, como Google Pay e Apple Pay, para aumentar a conveniência.P2P: transaciona diretamente com outros utilizadores na HTX.Mercado de balcão (OTC): oferecemos serviços personalizados e taxas de câmbio competitivas para os traders.Passo 3: armazena teu Threshold Network Token (T)Depois de comprar o teu Threshold Network Token (T), armazena-o na tua conta HTX.Alternativamente, podes enviá-lo para outro lugar através de transferência blockchain ou usá-lo para transacionar outras criptomoedas.Passo 4: transaciona Threshold Network Token (T)Transaciona facilmente Threshold Network Token (T) no mercado à vista da HTX.Acede simplesmente à tua conta, seleciona o teu par de trading, executa as tuas transações e monitoriza em tempo real.Oferecemos uma experiência de fácil utilização tanto para principiantes como para traders experientes.

513 Visualizações TotaisPublicado em {updateTime}Atualizado em 2026.06.02

Como comprar T

Discussões

Bem-vindo à Comunidade HTX. Aqui, pode manter-se informado sobre os mais recentes desenvolvimentos da plataforma e obter acesso a análises profissionais de mercado. As opiniões dos utilizadores sobre o preço de T (T) são apresentadas abaixo.

活动图片