a16z Crypto: 9 Charts to Understand the Evolution of Stablecoins

marsbitPublicado em 2026-04-25Última atualização em 2026-04-25

Resumo

Stablecoins are evolving from trading instruments to core financial infrastructure, driven by regulatory clarity and increased adoption. Key trends include accelerated growth following the U.S. GENIUS Act and the EU’s MiCA framework, which spurred non-USD stablecoin activity. Consumer-to-business transactions are growing fastest, doubling in 2025, while stablecoin card usage has surged. Velocity has nearly doubled since 2024, indicating active use rather than passive holding. Geographically, Asia dominates volume, led by Singapore, Hong Kong, and Japan. Notably, domestic transactions now account for nearly three-quarters of payments, highlighting stablecoins' role as local payment mediums on global infrastructure. Non-USD stablecoins, like Brazil’s BRLA, are also gaining traction. The data suggests stablecoins are becoming ubiquitous payment tools—global in design but increasingly local in practice.

Author: a16z crypto

Compiled by: Jiahuan, ChainCatcher

Stablecoins have been finding their footing for years.

Initially, they were just a trading tool, a means to transfer dollars across exchanges. Then they evolved into a savings instrument, held rather than spent. Today, the data points in a new direction: stablecoins are increasingly becoming core financial infrastructure.

The following nine charts reveal the factors driving this trend.

Regulation Accelerates Market Growth

For most of their history, regulatory uncertainty limited institutional participation. Later, the GENIUS Act brought regulatory clarity. It didn't create this trend, but it amplified and accelerated it.
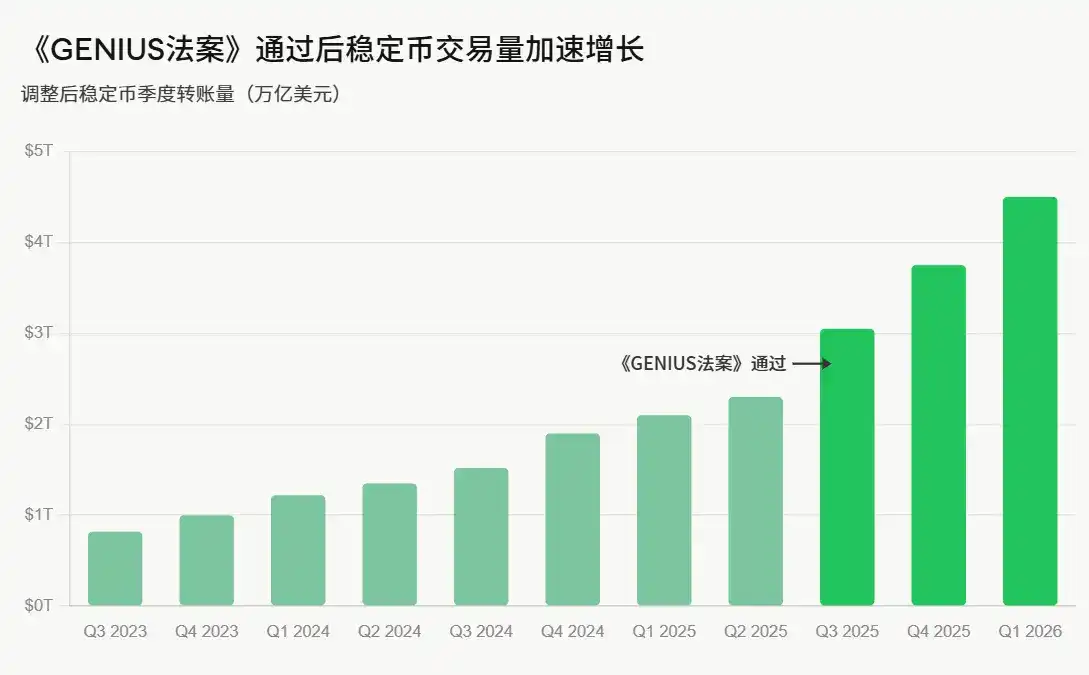
In the United States, the GENIUS Act established the first federal-level framework for stablecoin issuance. This shift is clearly visible in the data: adjusted trading volume had been rising for several quarters before the bill's passage, and growth accelerated further after its passage, reaching approximately $4.5 trillion in Q1 2026.

European regulation—the Markets in Crypto-Assets (MiCA) framework—tells a more complex story. When the法案 fully came into effect at the end of 2024, several major exchanges delisted USDT to comply, leading to a surge in activity for non-dollar stablecoins, which一度 exceeded $40 billion.
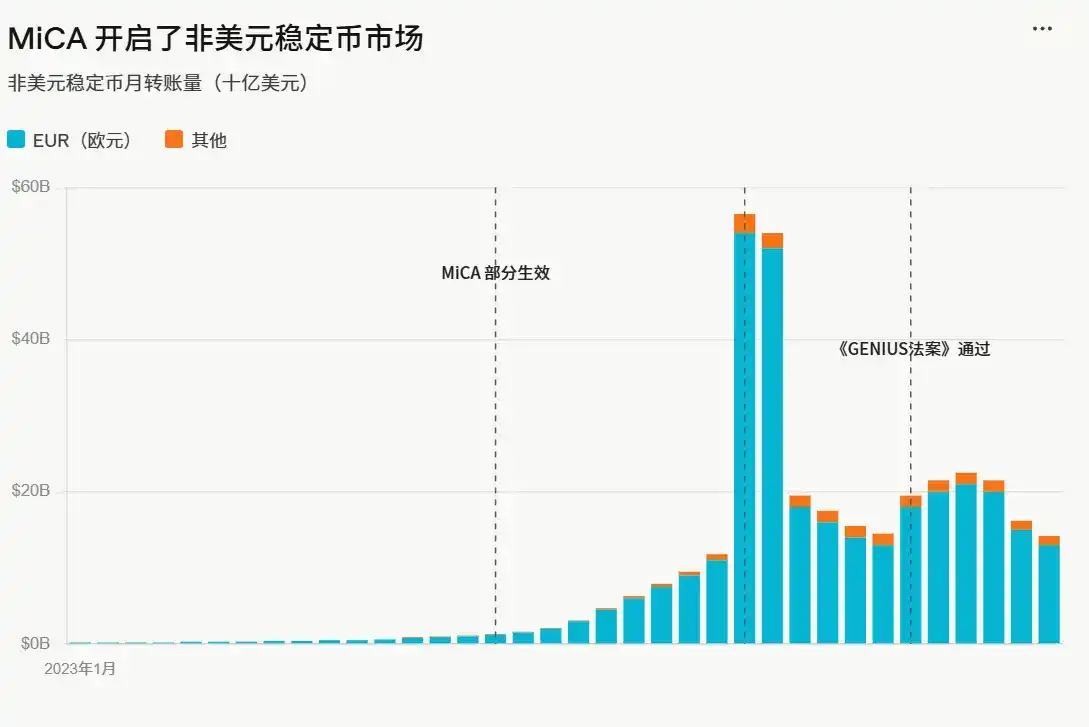
Since then, trading volume has stabilized at levels higher than the pre-MiCA baseline, around $15 billion to $25 billion per month. Regulation created a lasting market for non-dollar stablecoins that previously barely existed.

Stablecoin Commercial Activity is Growing

Perhaps the most noteworthy structural change lies in how people are actually using stablecoins.
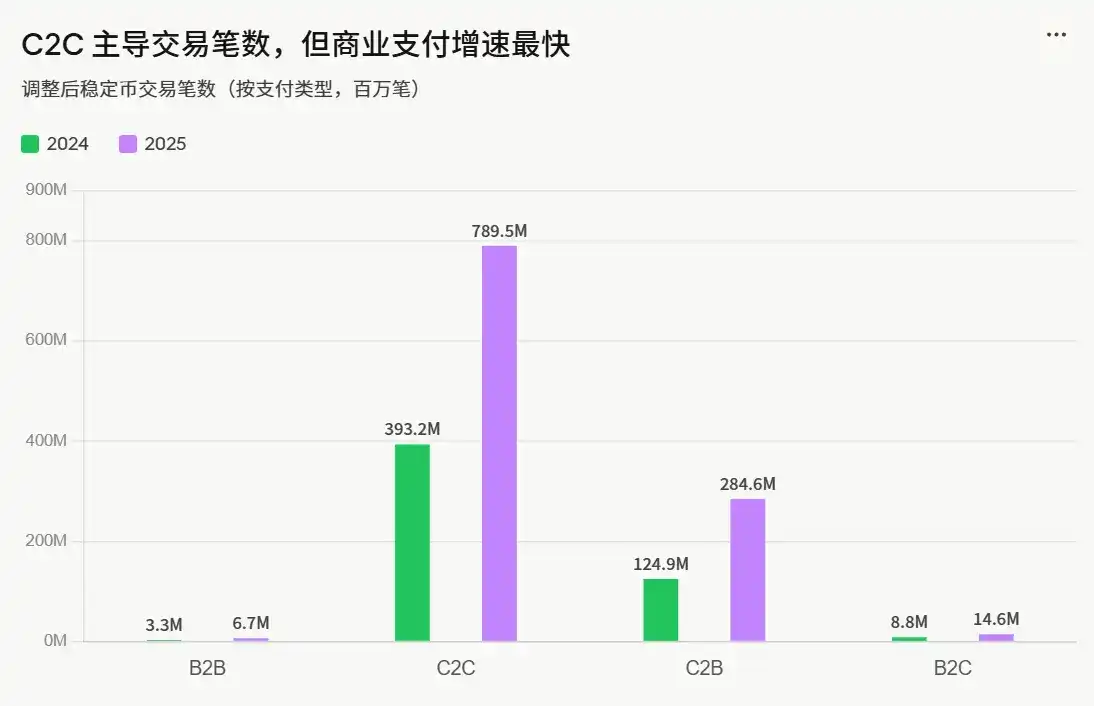
In terms of raw transaction count, the C2C category far surpasses all others: reaching 789.5 million in 2025. But Consumer-to-Business (C2B) stablecoin transactions grew the fastest, reaching 284.6 million in 2025 compared to 124.9 million in 2024, more than doubling year-over-year (+128%).

Data from stablecoin card infrastructure highlights this trend.
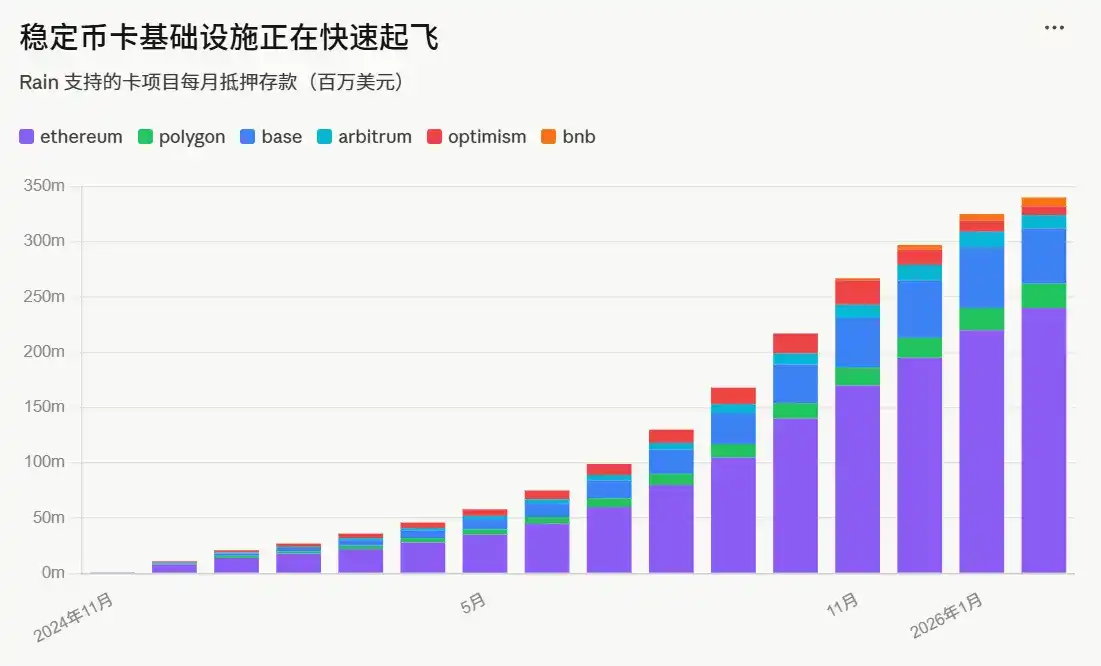
Monthly collateral deposits for stablecoin card programs supported by Rain (including Etherfi Cash, Kast, Wallbit, etc.) grew from nearly zero in November 2024 to over $300 million per month by early 2026. While this is collateral supporting spending, not direct spending of stablecoins, the trajectory is striking: stablecoin commercial activity is on the rise.

Stablecoin Velocity is Increasing

Every dollar of stablecoin supply is turning over more frequently.

Since early 2024, the velocity of stablecoins (the ratio of adjusted monthly transfer volume to circulating supply) has almost doubled, rising from 2.6x to 6x. An increase in velocity means demand for stablecoin transactions is outpacing new issuance, and the existing supply is working harder.
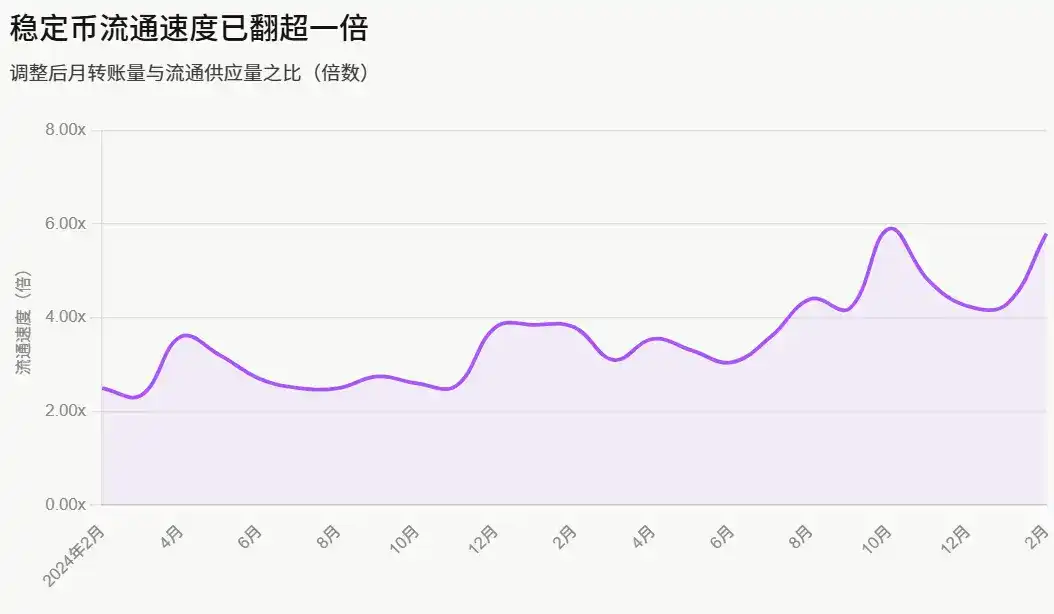
This is a hallmark of a true payment network—the base currency is being actively used, not just held.

Stablecoin Volume Reflects More Payments

If trading, fund flows, and exchange mechanisms—which make up the bulk of stablecoin transactions—are excluded, the estimated total for payments between different entities last year was still between $350 billion and $550 billion.

By volume, the Business-to-Business (B2B) sector dominates stablecoin payments (unsurprising given its scale). But other sectors, such as direct Consumer-to-Consumer (C2C) payments and interactions with merchants, are also expanding rapidly.

Stablecoin Payments are Currently Concentrated in Specific Regions

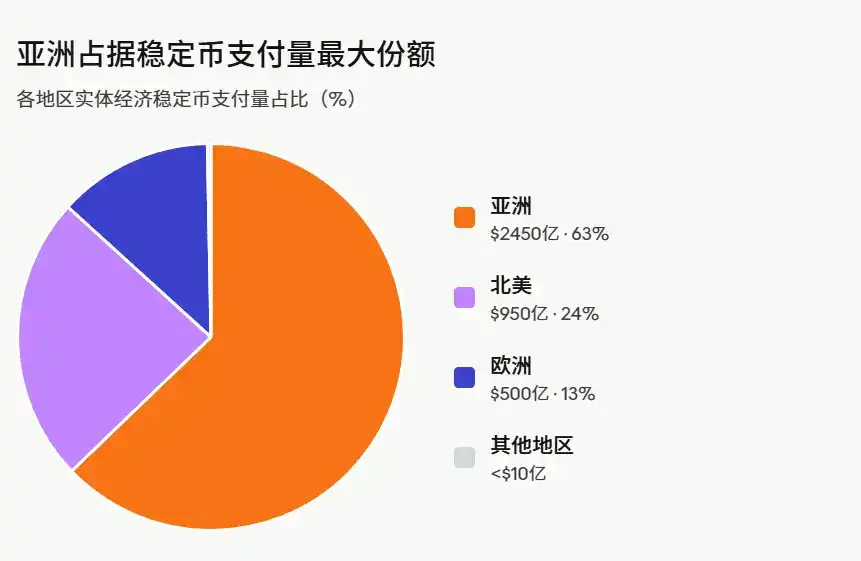
Geographically, stablecoin payment activity is not evenly distributed.

Nearly two-thirds of the transaction volume comes from Asia, primarily concentrated in Singapore, Hong Kong, and Japan.

North America accounts for about a quarter. Europe's share is around 13%. Latin America and Africa together make up only a very small portion, less than $1 billion.
Not Just Cross-Border Payments, But Local Currencies on Global Rails

The development of non-dollar stablecoins is not limited to Europe; it is also evident in emerging markets, driven by various factors.

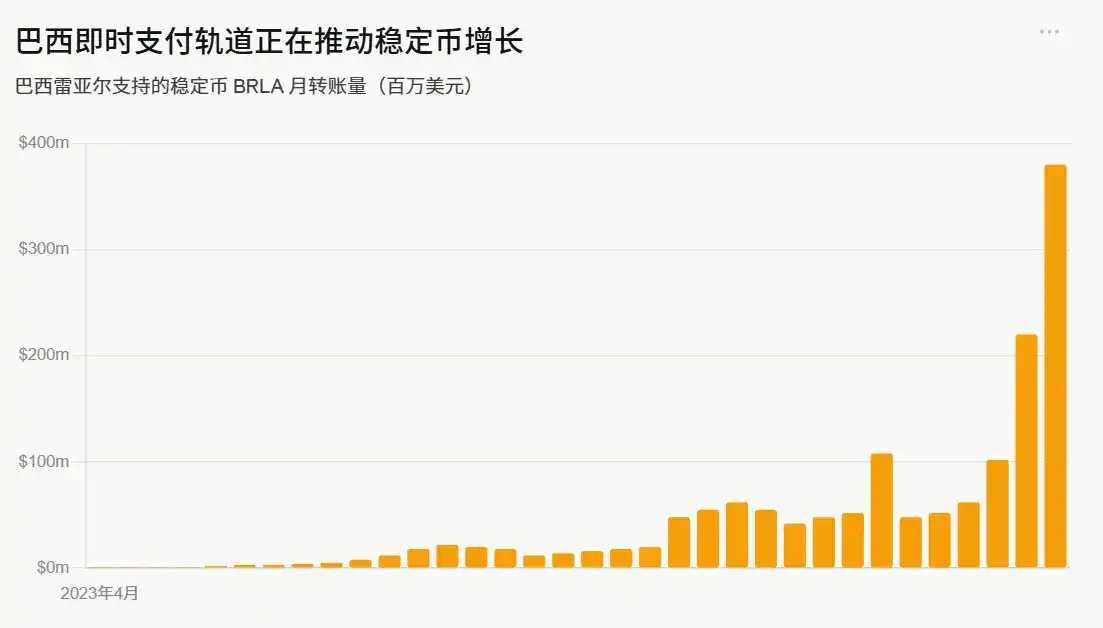
Brazil is a prime example. The monthly transfer volume of BRLA (a stablecoin backed by the Brazilian Real) has grown from nearly zero in early 2023 to about $400 million per month by early 2026. Access to the PIX instant payment network has driven its adoption.
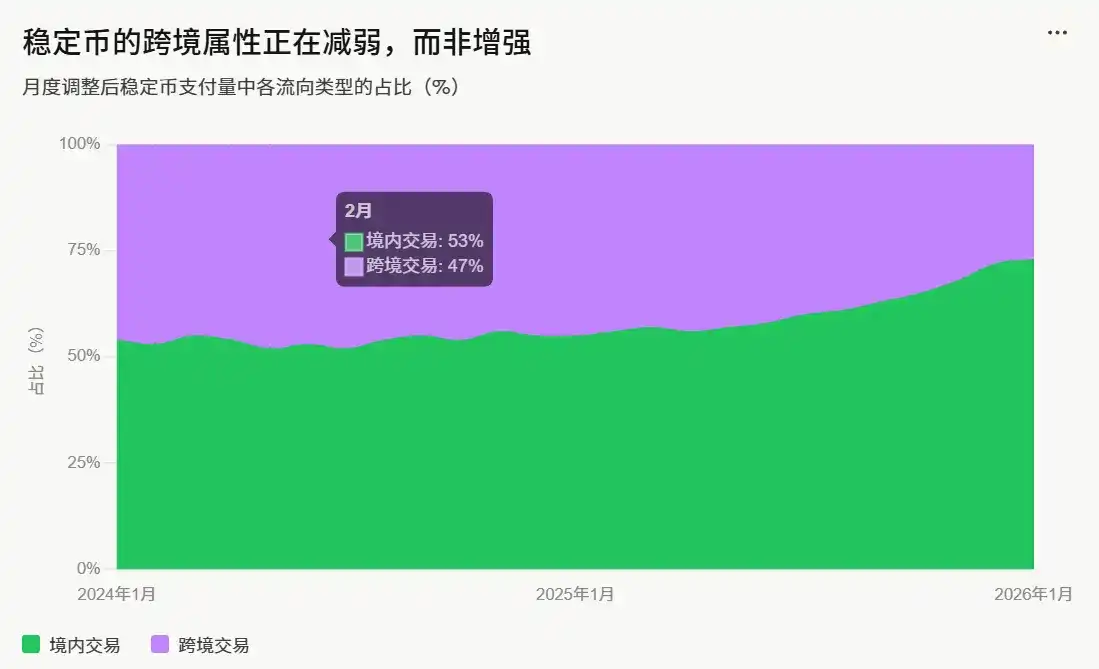
Although stablecoins are often described as cross-border tools, the proportion of cross-border activity has actually been declining, not rising.

Domestic transactions (stablecoin transfers occurring within the same country/region) have grown from about half of the payment volume in early 2024 to nearly three-quarters by early 2026. What does this mean? Stablecoins are not only establishing themselves as remittance or forex tools but also becoming a local payment medium running on global infrastructure.
Putting all these factors together, a clear picture emerges, though it's not the one most people expected: many thought stablecoins would be purely focused on cross-border transactions. Instead, they are becoming increasingly localized.

While the US dollar remains the core f币锚定 for the vast majority of stablecoins, stablecoins are by no means simply an export of the dollar. Non-dollar variants, such as euro-backed and Brazilian real-backed local currency stablecoins, are gaining popularity.

Although peer-to-peer (C2C) stablecoin transfers far exceed other types of payment flows in quantity, increasingly usage is flowing towards everyday consumption (C2B).

Each quarter's data provides more evidence that stablecoins are developing into general-purpose payment infrastructure. They are global by design but increasingly local in practice.

It's still early days. But the shape of this system is becoming clearer.

Perguntas relacionadas

QWhat was the impact of the GENIUS Act on stablecoin trading volume in the US?

AThe GENIUS Act established the first federal-level framework for stablecoin issuance in the US. Before its passage, adjusted trading volume had been increasing for several consecutive quarters. After its enactment, growth accelerated further, reaching approximately $4.5 trillion in Q1 2026.

QWhich region accounts for the largest share of stablecoin payment volume, and which specific areas are the main contributors?

AAsia accounts for nearly two-thirds of the stablecoin payment volume. The main contributors are Singapore, Hong Kong, and Japan.

QWhat is the most significant structural change in how people use stablecoins, as indicated by transaction growth?

AThe most significant structural change is the growth in Consumer-to-Business (C2B) stablecoin transactions. This category saw the fastest growth, more than doubling (+128%) from 124.9 million transactions in 2024 to 284.6 million in 2025.

QWhat does the increasing velocity of stablecoins indicate about their use?

AThe increasing velocity of stablecoins, which nearly doubled from 2.6x to 6x since early 2024, indicates that the demand for stablecoin transactions is outpacing new issuance. It means the existing supply is circulating more frequently, which is a hallmark of a genuine payment network where the base currency is being actively used, not just held.

QContrary to common belief, what trend is observed in the proportion of cross-border stablecoin activity?

AContrary to the common belief that stablecoins are primarily for cross-border transactions, the proportion of cross-border activity has actually been decreasing. Domestic transactions (stablecoin transfers within the same country/region) grew from about half of the payment volume in early 2024 to nearly three-quarters by early 2026.

Leituras Relacionadas

Weekly Editor's Picks (0725-0731)

Weekly Editor's Picks (0725-0731) provides a curated selection of deep analysis, filtering out market noise. Key themes from this week include: **Macro & Policy:** The Federal Reserve's upcoming meeting is marked by high uncertainty, balancing cooling inflation data against persistent price pressures. Meanwhile, the U.S. crypto regulatory Clarity Act faces critical political hurdles, with its 2026 passage probability seen as low. **Investing & Crypto:** Analysis suggests long-term crypto success depends on conviction through volatile cycles, focusing on assets like Bitcoin and core smart contract platforms. A trend noted is the increasing similarity between global equity markets (especially tech) and crypto, driven by narrative and leverage. Several major crypto protocols show strong revenue growth, but this isn't always translating to token price appreciation due to sell pressure and structural factors. **AI & Semiconductors:** Nvidia's rising credit default swap rates signal market concern over AI infrastructure financing risks. The storage sector experienced volatility as markets began pricing in potential 2027 oversupply. Despite a record profitable quarter, SK Hynix's results were deemed "below expectations," reflecting heightened investor demands for future growth visibility. **Markets & DeFi:** TradeXYZ demonstrated remarkable accuracy in pre-market pricing for a major A股 listing. The token ONDO saw gains, linked to its growing role in the on-chain tokenized stock ecosystem. **Ethereum:** Post-Pectra upgrade, a major structural shift is underway as Lido begins migrating millions of ETH to new validator architectures designed for capital efficiency. **Also Highlighted:** Butian's bullish stock market move; OpenAI's Altman promising major advances; Samsung and SK Hynix securing large AI chip deals; Apple reaching a $5T market cap; and ongoing discussions around exchange security following Poolin's bankruptcy case.

marsbitHá 34m

Weekly Editor's Picks (0725-0731)

marsbitHá 34m

Low Investment Isn't Apple's Immunity Pass

While Meta and Google face investor scrutiny over ballooning AI capital expenditures, Apple's minimal AI investment has paradoxically become a strength. Its market cap recently reclaimed the global top spot, surpassing $5 trillion. The irony is deep: Apple's own AI efforts have lagged, with "Apple Intelligence" delayed and core talent lost, forcing reliance on partners like Google Gemini and Alibaba's Qianwen. Its Q3 FY2026 (Q2 CY) earnings initially seemed stellar. Revenue hit $109.4B (up 16% YoY), with iPhone and Mac sales, growing 22% and 29% respectively, driving most of the growth. However, the stock fell over 8% post-earnings. The primary concern was a weaker Q4 revenue growth forecast of 9-11%, below expectations, due to looming supply chain constraints. Apple is feeling the indirect cost of the AI boom. Soaring memory and chip prices, fueled by massive data center investments from Microsoft, Amazon, and others, are forcing Apple to raise Mac and iPad prices significantly. The upcoming iPhone launch is also expected to see substantial price hikes. Despite avoiding heavy AI infrastructure spending—its capital expenditures are actually down 28%—Apple cannot escape the industry-wide supply and cost pressures. While Apple's operating cash flow remains robust, its substantial R&D spending (up 32% YoY) has yet to yield major AI breakthroughs. As Tim Cook prepares to step down as CEO, Apple faces a challenging transition: balancing its premium hardware success against the strategic and cost pressures of the AI era it has so far cautiously navigated.

marsbitHá 1h

Low Investment Isn't Apple's Immunity Pass

marsbitHá 1h

PA Graphics Explanation | One Chart to Understand the Major Web3 Events in August 2026

**PANews Crypto Calendar: Key Web3 Events in August 2026** PANews introduces its revamped crypto calendar, featuring comprehensive coverage, flexible filtering, and easy export options. The market in August will be shaped by multiple key events across macroeconomics, regulation, tokenomics, and project developments: * **Macro & Policy:** Key US economic data releases (July Non-Farm Payrolls, CPI), the Federal Reserve meeting minutes, and the Jackson Hole Economic Symposium will be in focus. On the regulatory front, the US Senate plans to release a new draft of the *CLARITY Act*, while the EU's expanded crypto ban against Belarus comes into effect. * **Token Unlocks:** Significant token unlocks are scheduled for assets including ENA, AVAX, CONX, ZRO, and KAITO, which may influence market volatility. * **Project Updates & Shutdowns:** Several services, including Exchange Art, Ctrl Wallet, Zapper, NFTfi, and Summer.fi, are set to cease operations or undergo major adjustments. Users are advised to manage their assets accordingly. * **Corporate Activity:** Q2 earnings reports from companies like SpaceX, Circle, and Nvidia are due. Unitree Robotics will initiate its IPO subscription on the STAR Market, and Moonshot AI plans to begin a Pre-IPO financing round. * **Industry Events:** Major conferences such as Bitcoin Asia 2026 and the 2026 Digital Expo will take place. The overarching market narrative for August will revolve around macroeconomic expectations, regulatory developments, token unlock schedules, and ongoing industry consolidation.

marsbitHá 1h

PA Graphics Explanation | One Chart to Understand the Major Web3 Events in August 2026

marsbitHá 1h

Wall Street's Most Famous 'Cassandra' Now Has His Sights Set on Nvidia

Michael Burry, the famed "Big Short" investor, has once again captured Wall Street's attention with a series of short positions against major tech and semiconductor stocks, most notably Nvidia. In late June and July, through his "Cassandra Unchained" newsletter, Burry disclosed short bets against Nvidia, Tesla, Applied Materials, Caterpillar, the SOXX semiconductor ETF, and later, Micron Technology. His core thesis revolves around potential distortions in the AI infrastructure boom, specifically questioning whether extended depreciation schedules (e.g., 6 years vs. a realistic 2-3 years for AI chips) by cloud giants like Microsoft and Google artificially inflate profits. He also raises concerns about possible "off-balance-sheet circular financing," where chip demand might be propped up by vendor-backed funding to clients. Nvidia's stock experienced volatility following these disclosures, briefly dipping but largely holding near Burry's reported entry points, leaving his positions roughly flat or slightly underwater as of late July. This move is part of a pattern for Burry, whose track record since his legendary 2008 bet is mixed. He has faced notable losses, such as on Tesla in 2021, while scoring on broader market turns like the 2020 pandemic crash. His methodology focuses intensely on free cash flow and scrutinizing original financial documents to spot overvaluation and structural risks, but it often struggles with timing the market. The article contrasts Burry's stance with other prominent investors. Steve Eisman, another "Big Short" figure, is not shorting Nvidia, citing strong fundamentals but expressing nervousness about sustainability. Jim Chanos agrees with the broad "accounting mismatch" concern—comparing it to the dot-com bubble—but targets financial leverage in private equity firms rather than the chip stocks themselves. While Nvidia's short interest remains relatively low at 1.3-1.4% of float, the massive stock size means absolute short losses have been significant, exceeding $5 billion earlier this year. The piece concludes that for ordinary investors, the key takeaway is not replicating specific short bets but learning from the critical frameworks these investors use: questioning rosy accounting, identifying structural vulnerabilities, and maintaining skepticism during market euphoria, even if pinpointing the exact catalyst for a downturn remains elusive.

marsbitHá 1h

Wall Street's Most Famous 'Cassandra' Now Has His Sights Set on Nvidia

marsbitHá 1h

Trading

Spot
活动图片