4 Classic Bottom-Fishing Indicators All Failed, 3 New Indicators Point to the Bottom-Fishing Opportunity?

Odaily星球日报Publicado em 2026-03-19Última atualização em 2026-03-19

Resumo

The article analyzes the shifting effectiveness of traditional Bitcoin bottom-buying indicators and proposes new metrics to identify potential market bottoms. Four classic indicators are discussed: - **MVRV Z-Score** (currently ~1.31) is distorted by institutional holdings, making historical "extreme negative" values unlikely. - **Ahr999 Index** has remained below 0.45 for nearly 50 days, but its long-term predictive power has diminished due to macro factors. - **SOPR Metrics** show STH-SOPR consistently below 1 (bearish), while LTH-SOPR remains between 0.75–1, indicating no full capitulation. - **Mayer Multiple** (price/200-day MA) has also stayed below 0.8 for 50 days but lacks consistent predictive strength. Three alternative indicators are suggested: 1. **CVDD (Cumulative Value Days Destroyed)**: Models a historical "iron bottom" near $45,000. 2. **NUPL (Net Unrealized Profit/Loss)**: Currently at 0.2; negative values often signal market bottoms. 3. **Stablecoin Exchange Netflow**: Sustained inflows of USDT/USDC to exchanges typically precede rebounds by 2–4 weeks, but current outflows suggest no immediate bottom. The conclusion emphasizes that indicators are reference tools, not guarantees, and cautions that widespread public euphoria (e.g., mainstream adoption talks) may signal a sell opportunity rather than a buy.

Original | Odaily Planet Daily (@OdailyChina)

Author | Wenser (@wenser 2010)

After experiencing eight consecutive days of gains on the daily chart, BTC has once again turned downward, falling continuously from $76,000 and is currently trading at $69,200. The mainstream bottom-fishing indicators previously referenced within the industry, including Ahr999 (also known as the "9 God Index"), Weekly RSI, STH-SOPR (Short-Term Holder Spent Output Profit Ratio), LTH (Long-Term Holder Spent Output Profit Ratio), and MVRV Z-Score (Market Value to Realized Value Z-Score), have all shown a state of being "sometimes effective, sometimes not": many indicators are at low levels, yet the market continues to fall; some indicators are at high levels, but the market occasionally surges.

In view of this, this article will present 4 representative bottom-fishing indicators within the industry and combine them with data and real-life "implicit indicators" to construct new "bottom-fishing indicators," attempting to explore the downside potential of BTC. The following content is for learning and exchange purposes only, does not constitute investment advice, all investment risks are your own, please DYOR.

4 Classic Indicators for BTC Bottom-Fishing Timing: The Best Time Has Not Yet Come, BTC May Fall Below $60k

From the new high of $126,000 in October last year to the current oscillation around $70,000, BTC's price has been like a roller coaster in just a few months. In such a volatile crypto market environment, many industry indicators have already lost their reference value, including but not limited to the dynamic and flexible miner shutdown price, the industry Fear and Greed Index, Google search heat index, and the Rainbow Chart based on the early penetration stage of BTC.

The reason is none other than the fact that after the influx of BTC spot ETF funds, the increasing number of US DAT treasury companies, and the facilitation by US regulators, the evaluation system for BTC has undergone structural changes. Institutional holdings, derivative arbitrage, internal exchange settlements, US macro monetary policy, and even global geopolitics have become factors with higher weightings affecting BTC's price. In other words, past on-chain indicators and profit/loss can only serve as references and cannot lead to direct conclusions anymore.

Here, we use industry indicators that still have some representativeness to present data and analyze results, which may more intuitively illustrate the failure of the old indicators.

Indicator 1: MVRV Z-Score, Collective Deviation of the Anchored Value System
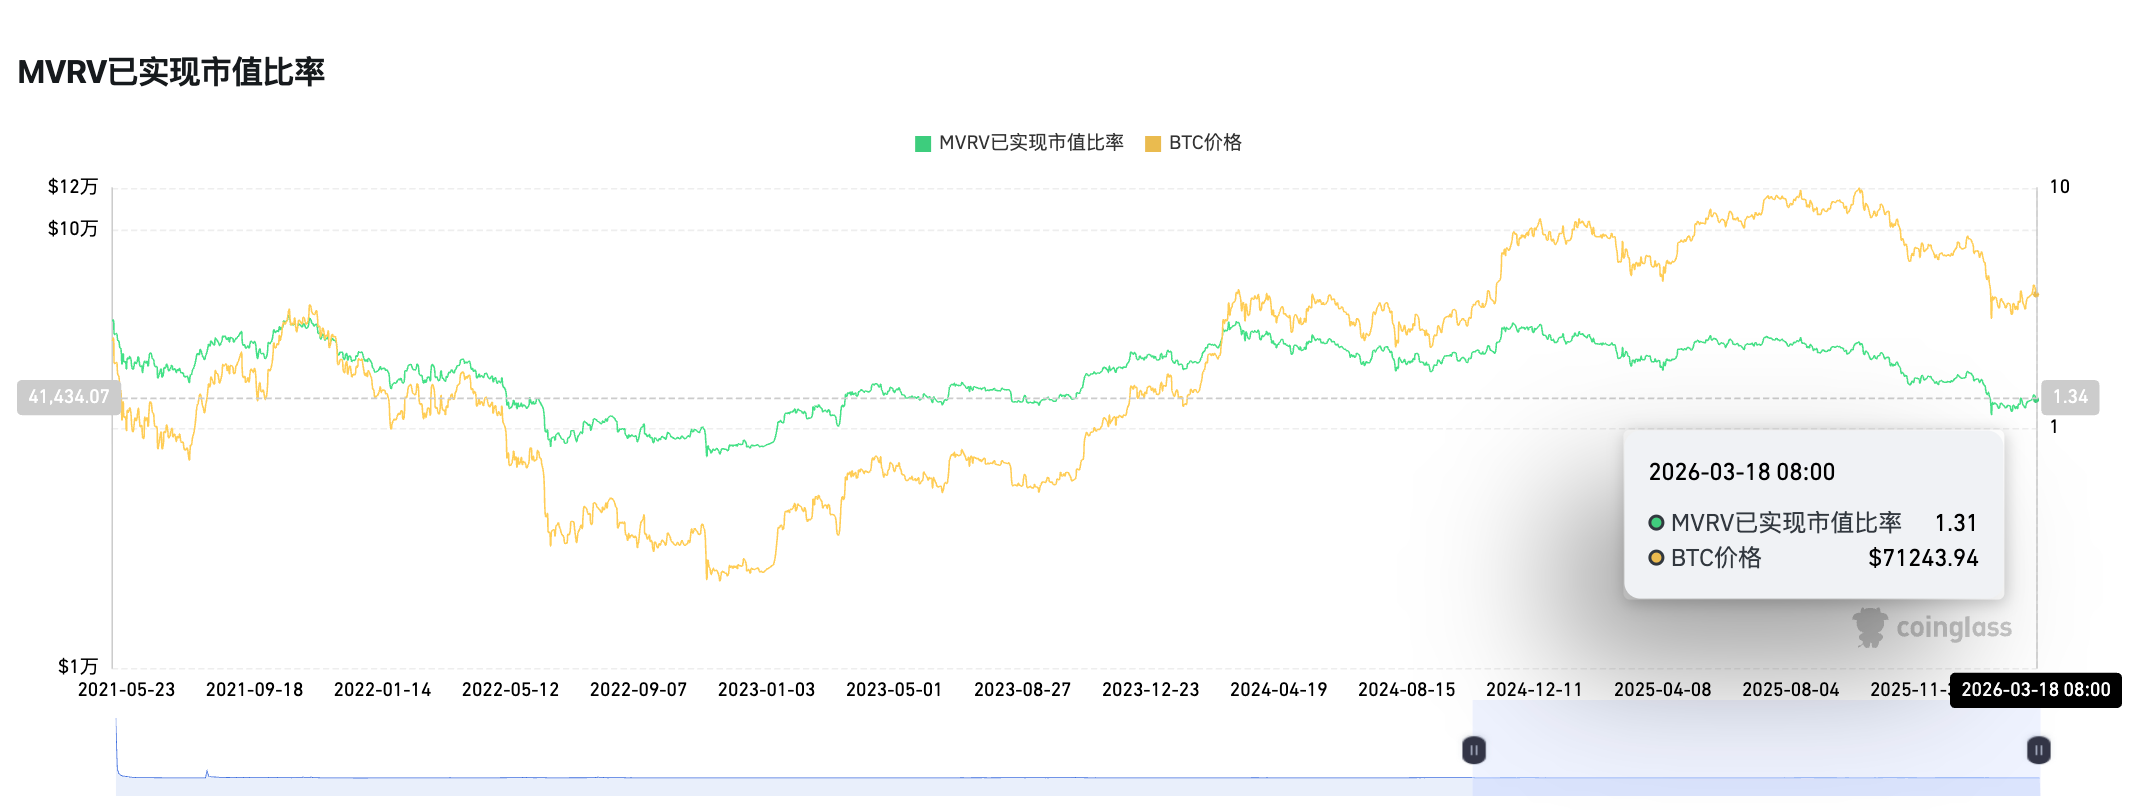
Figure 1
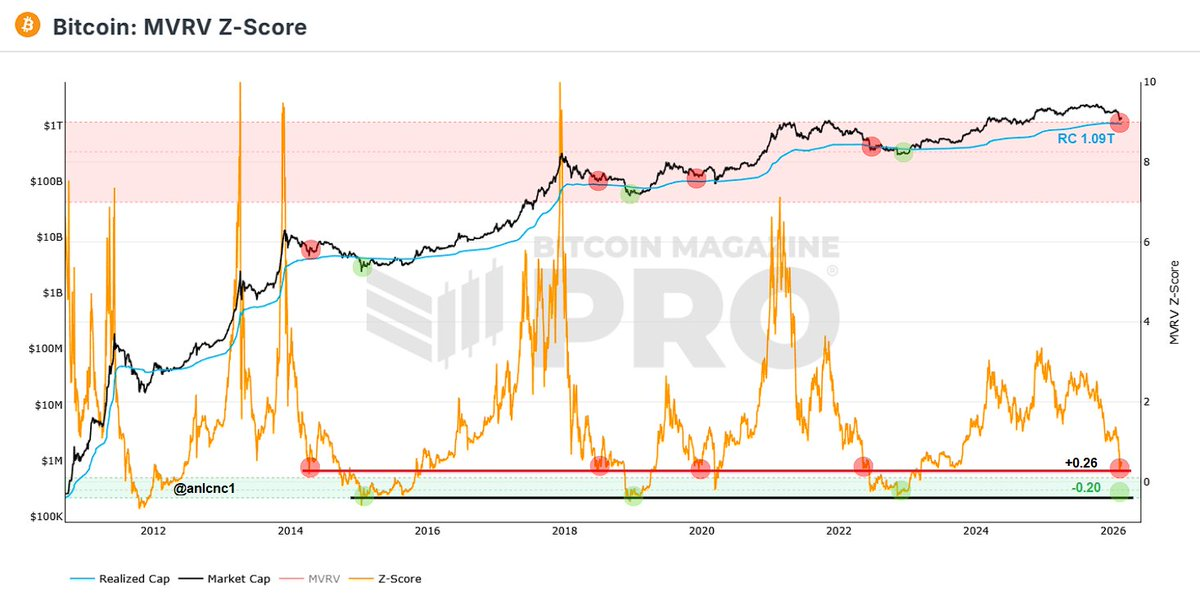
Figure 2
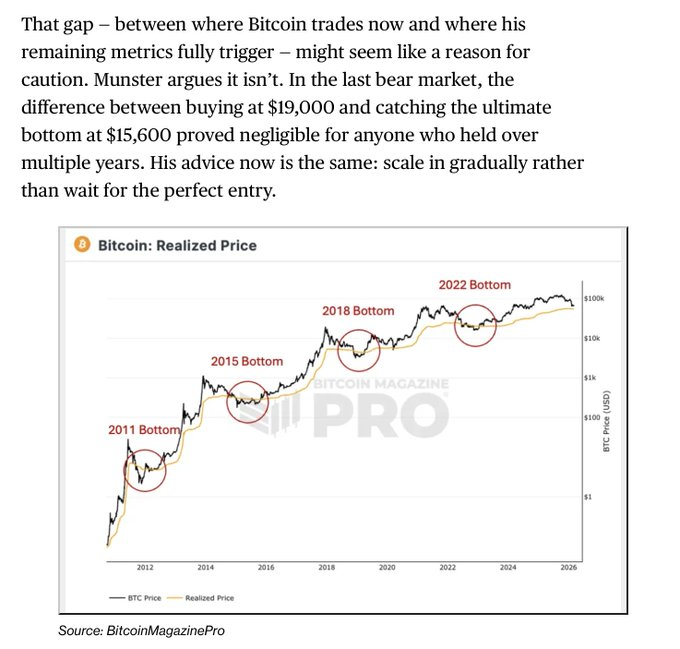
Figure 3

As of March 18, the MRVR indicator was temporarily reported at 1.31; previously, in February, crypto researcher anıl pointed out, "When the MVRV Z-Score falls below 0, especially below -0.20, Bitcoin is at its price bottom. In this cycle, the lowest value Bitcoin touched was +0.26, which means the classic 'green zone' has not yet been tested." (Figure 2 above) On March 14, Bitcoin News published an article stating that the MVRV Z Score had dropped to about 0.38, a level that previously indicated undervaluation. Other key support levels include the realized price near $54,000 and the 200-week moving average near $58,000. Bloomberg pointed out that the potential bottom range is between $45,000 and $55,000, but sustained recovery requires new demand support. (Figure 3 above)

Reason for failure: Large-scale holdings by ETF custodians and DAT companies have systematically raised the Realized Value (RV), significantly increasing the denominator (standard deviation) of the Z-Score, making the historically "extreme negative values" extremely difficult to reappear under the current structure.

Indicator 2: Ahr999 Index (9 God Index), The bottom-fishing zone below 0.45 has lasted for nearly 50 days
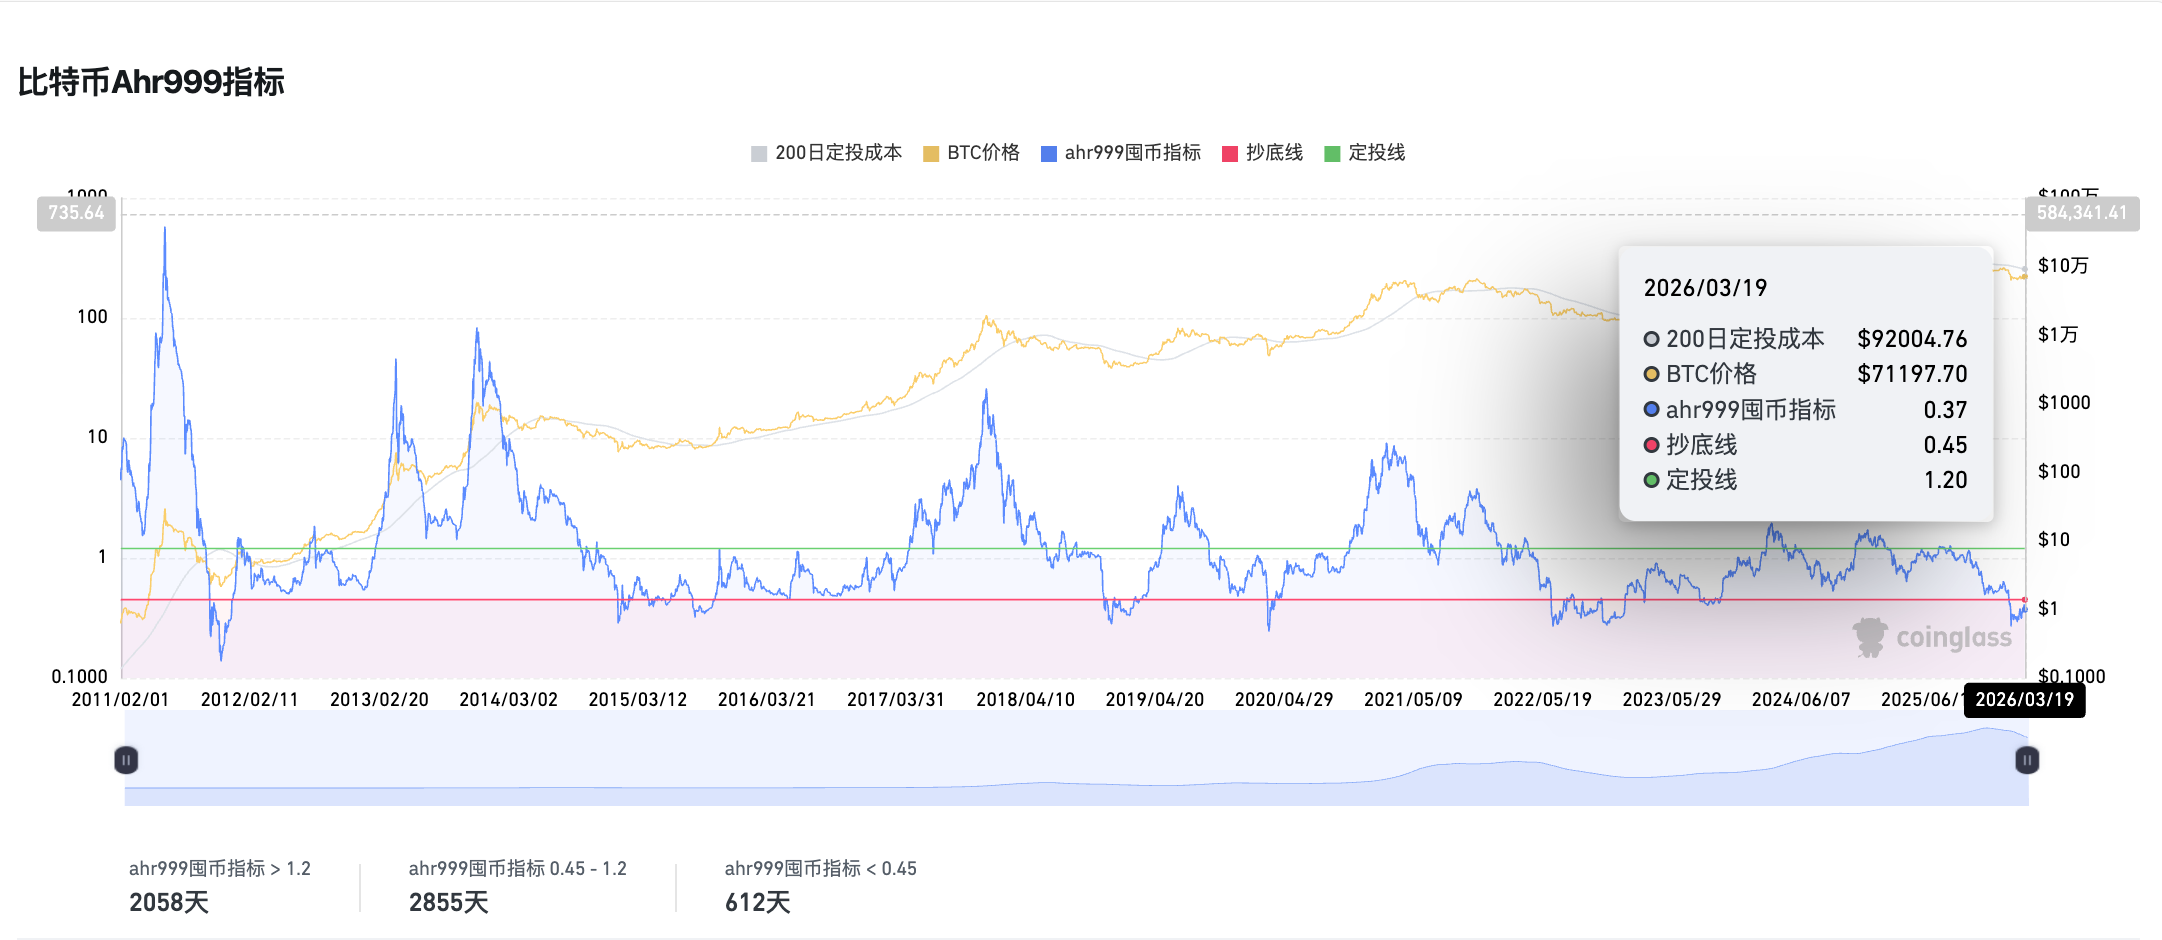
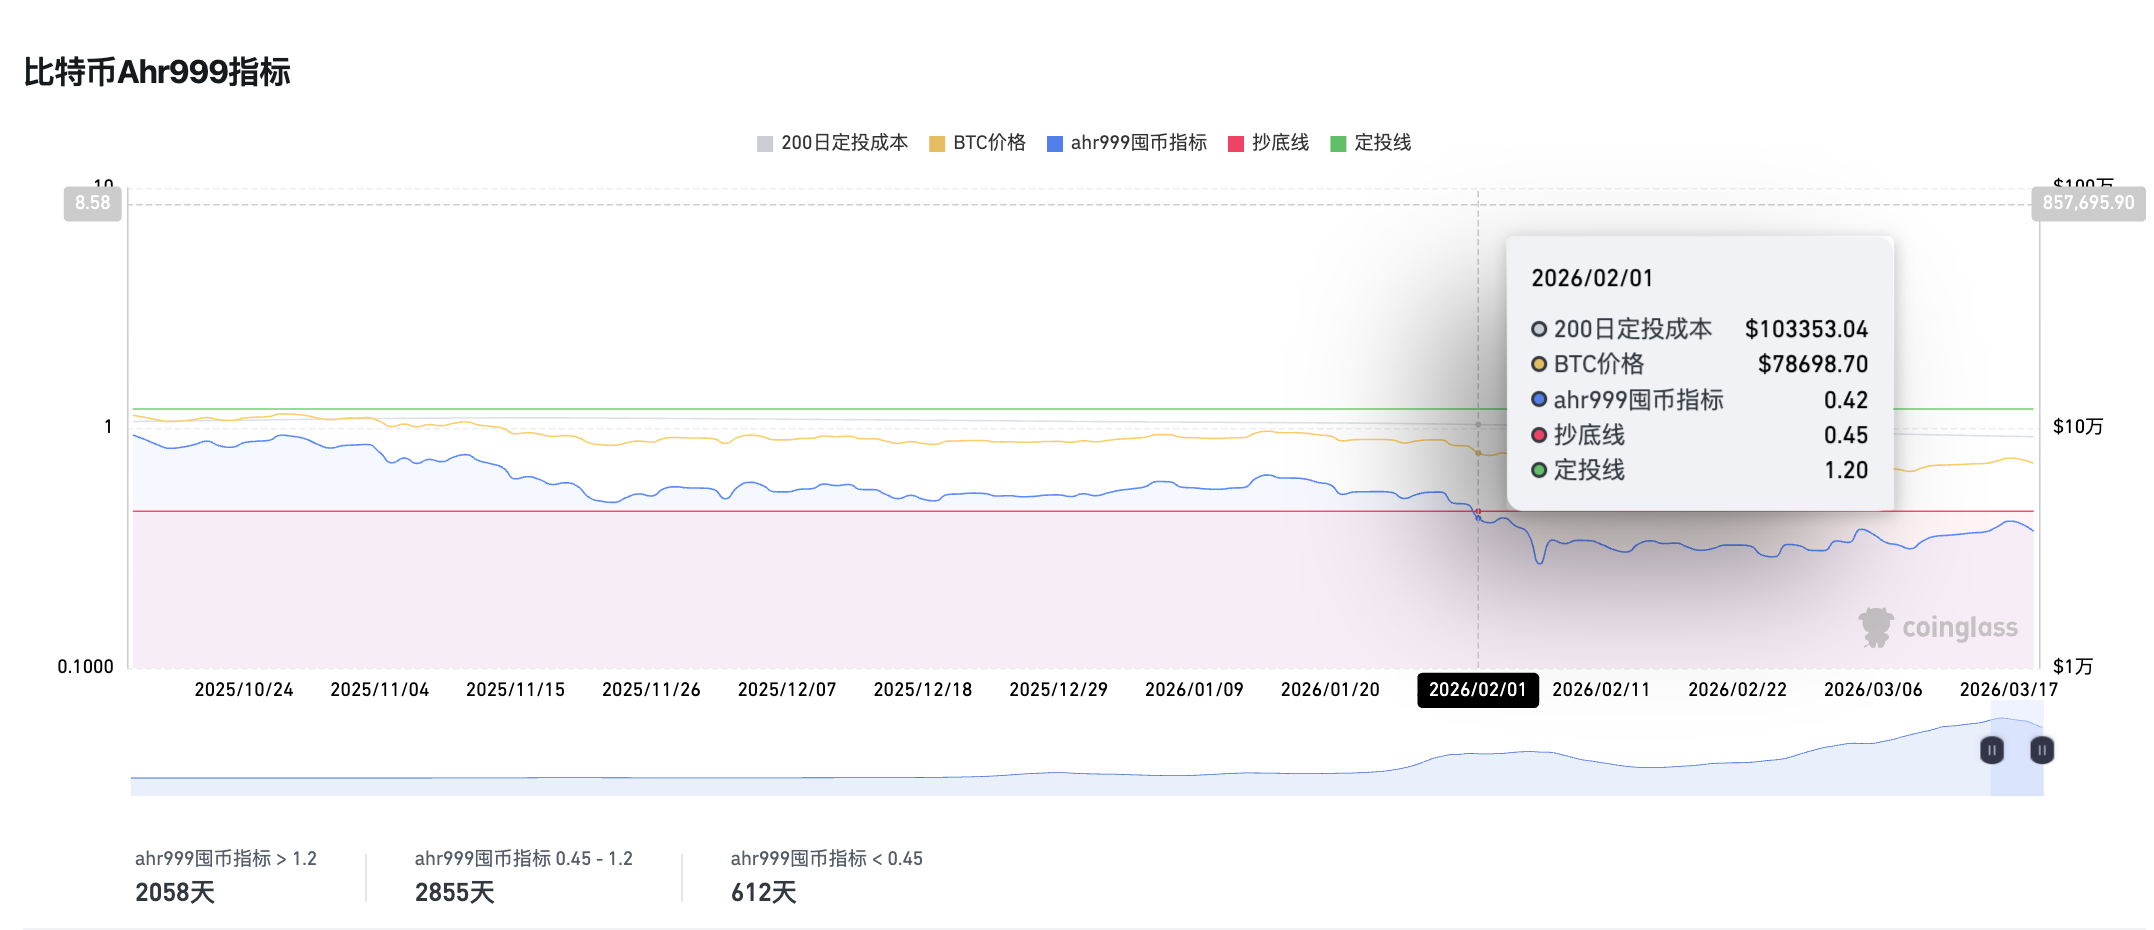
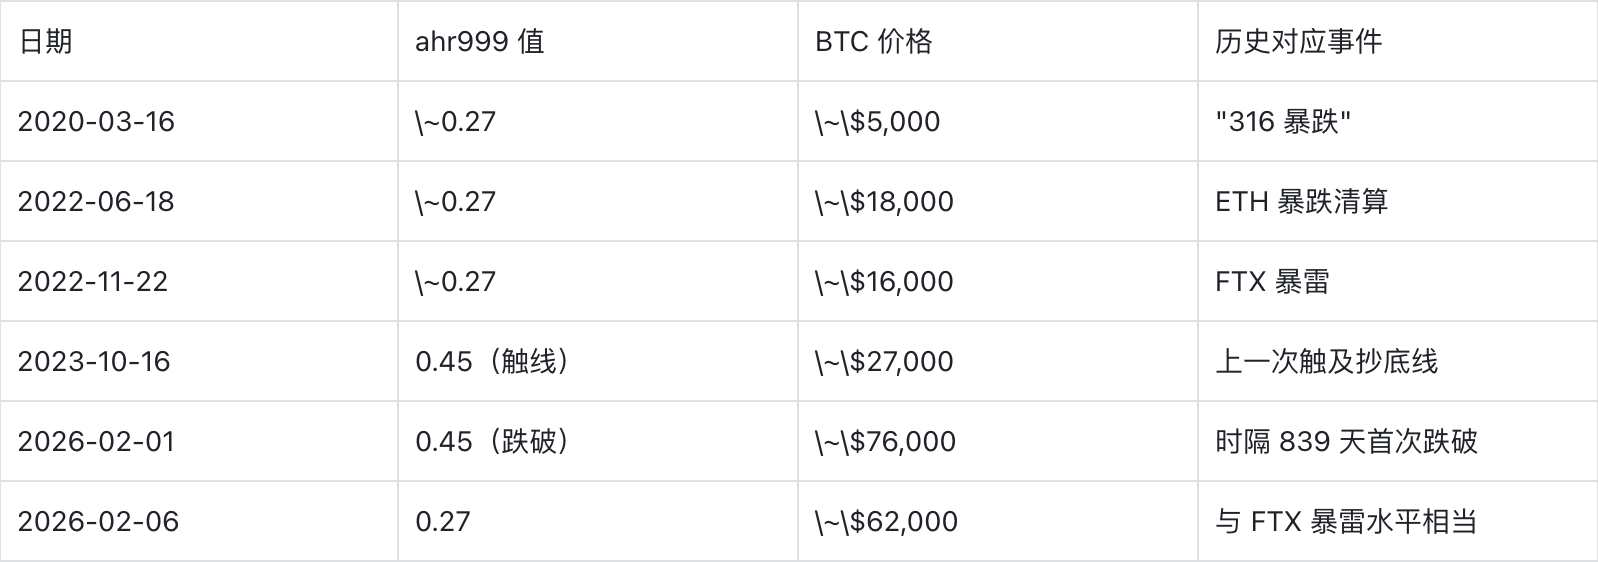
Since February 1st until now, the Ahr999 indicator has been below 0.45 for nearly 50 consecutive days. Historically, the number of days this indicator has been <0.45 is only 612 days, accounting for about 11% of the total time. On March 19, the Ahr999 accumulation indicator data was 0.37, still indicating a bottom-fishing zone, but it is difficult to provide more long-term guidance information.

Reason for failure: Since the major crash on October 11 last year, the market has been in a state of continuous oversold conditions. Coupled with Trump's volatile policies, the Federal Reserve's interest rate cuts falling short of expectations, and international geopolitical turmoil, BTC's safe-haven属性 has greatly diminished. Therefore, even after falling below the $76,000 cost line of the largest BTC DAT listed company, Strategy, it awaits more liquidity repair. This indicator has gradually become a comfort index for "long-term value investors".

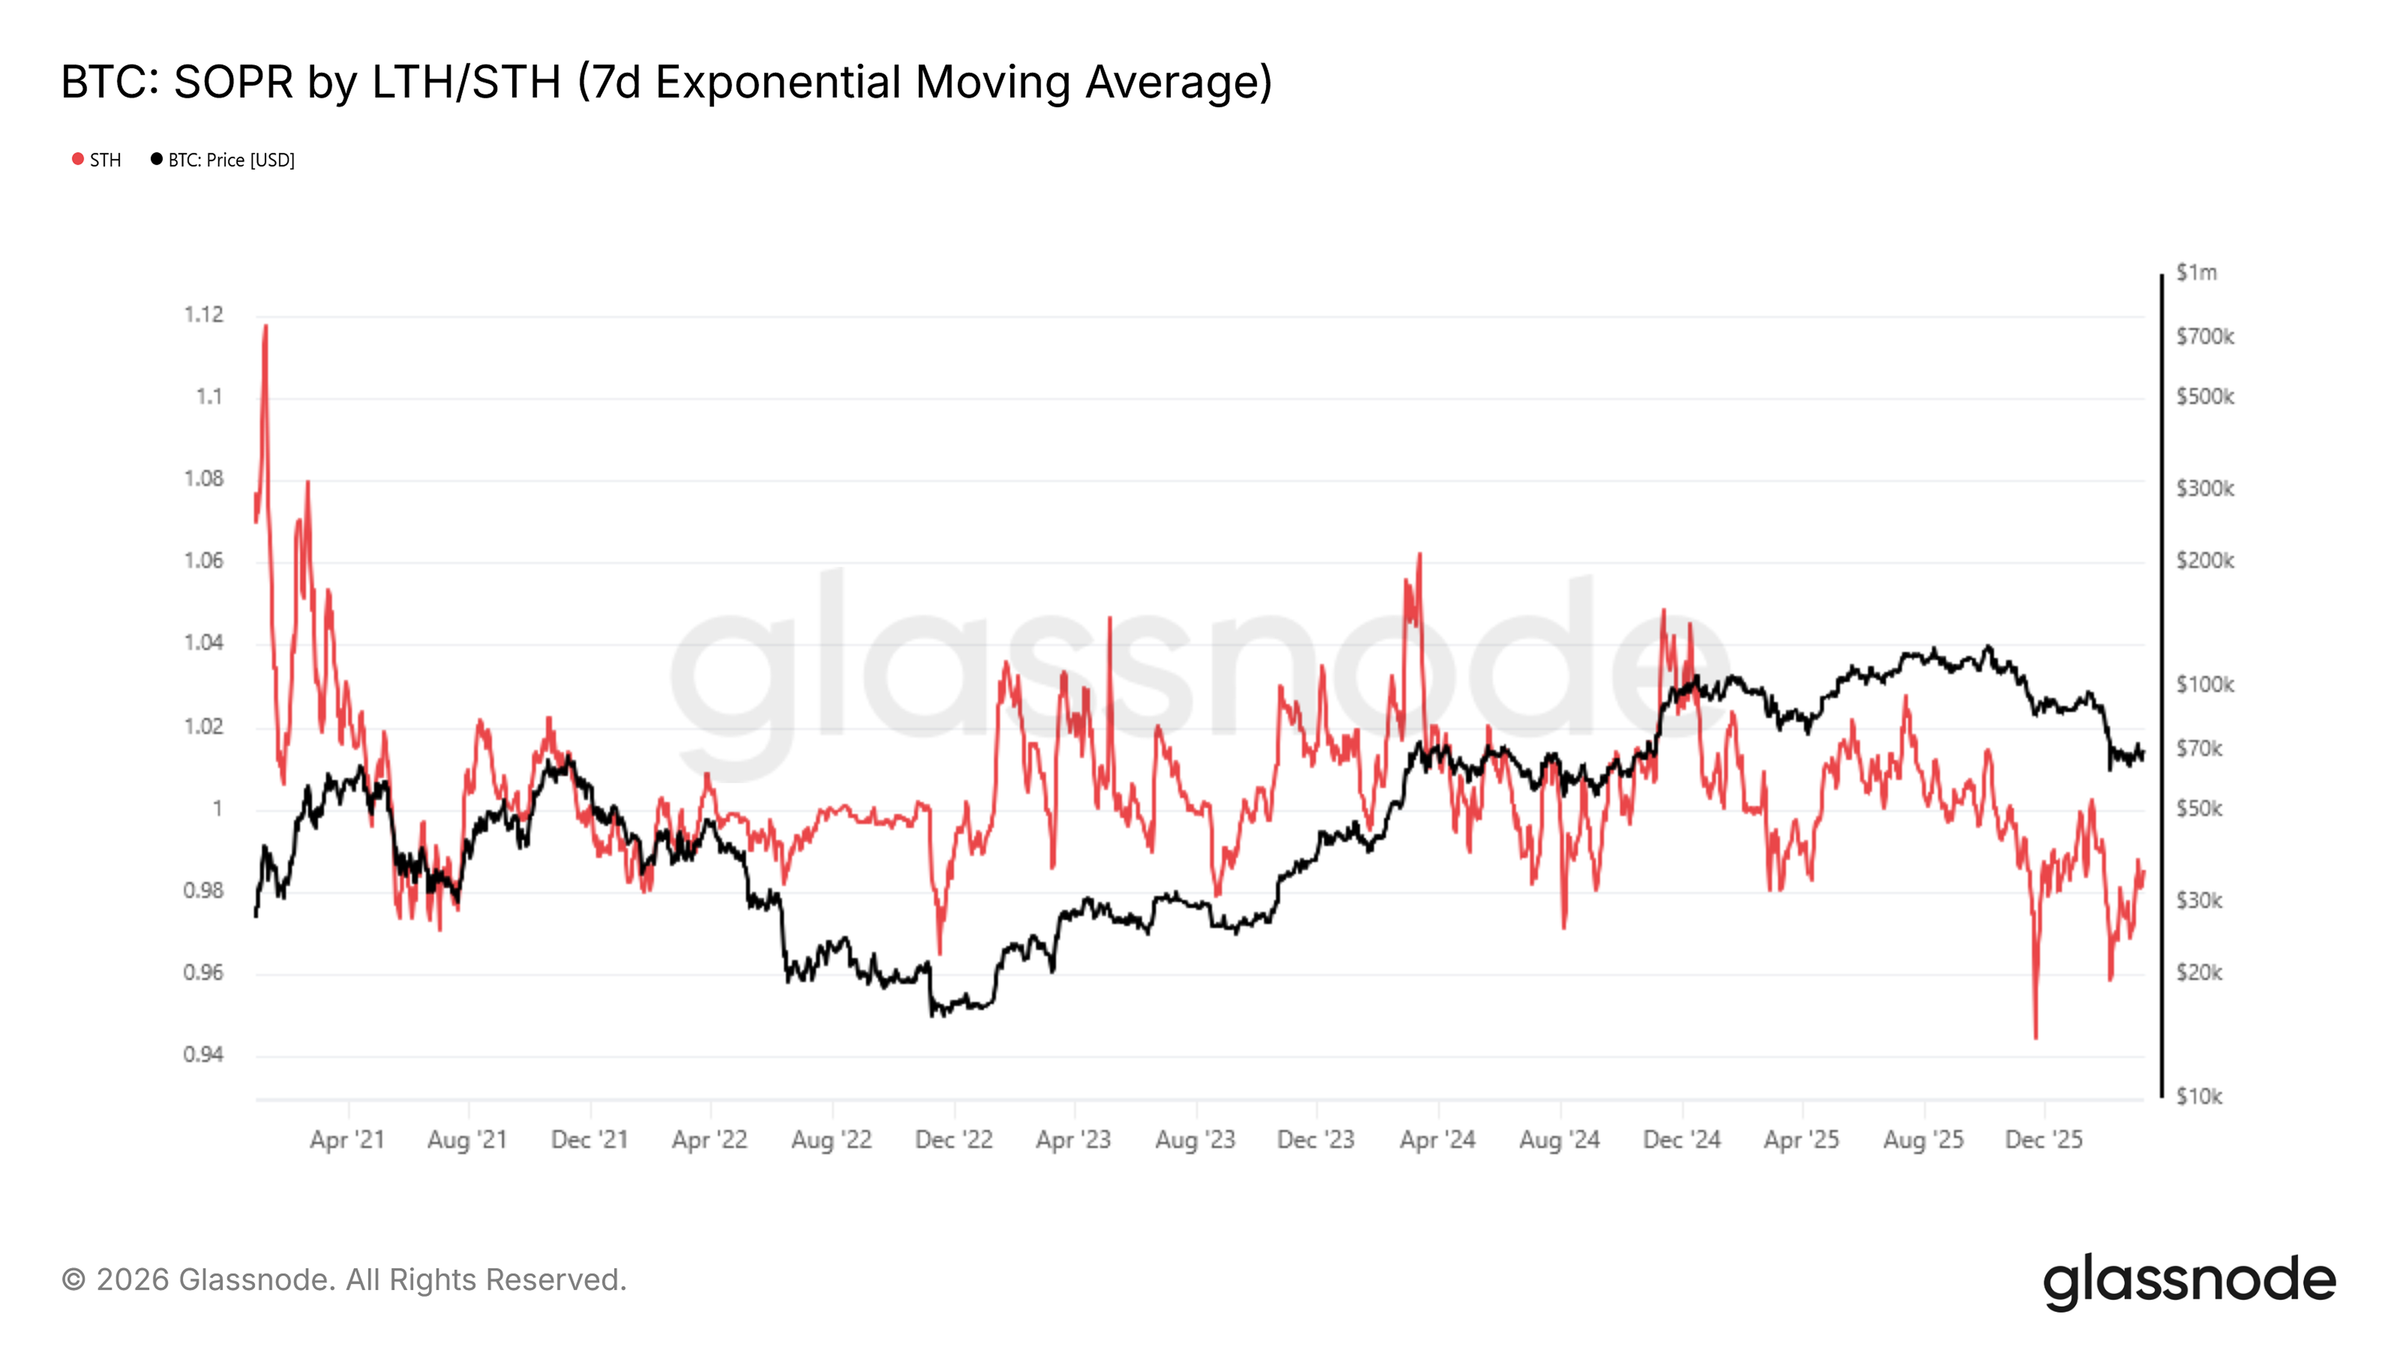
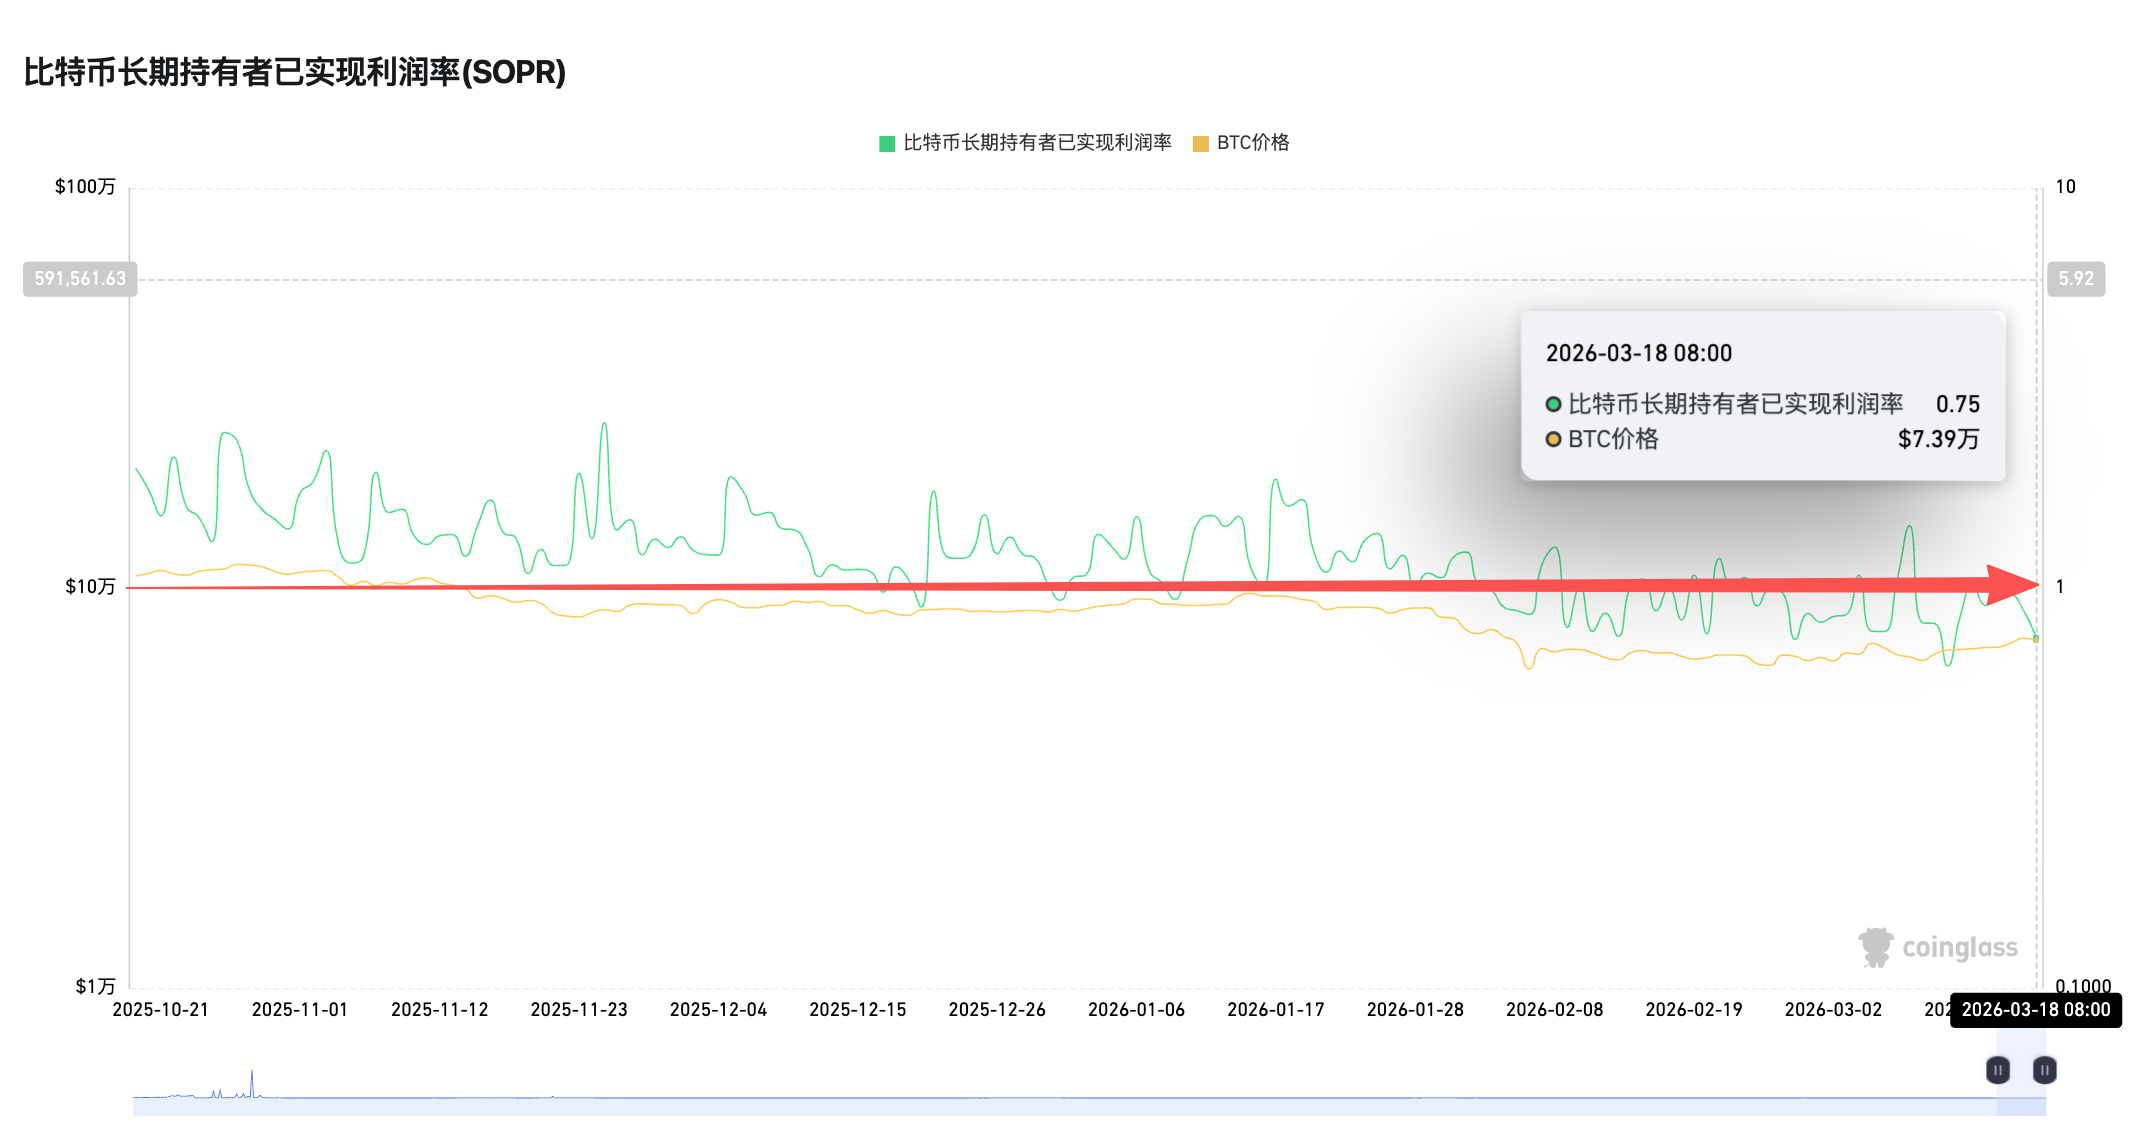
Indicator 3: SOPR, STH-SOPR consistently below 1, LTH-SOPR consistently between 0.75-1
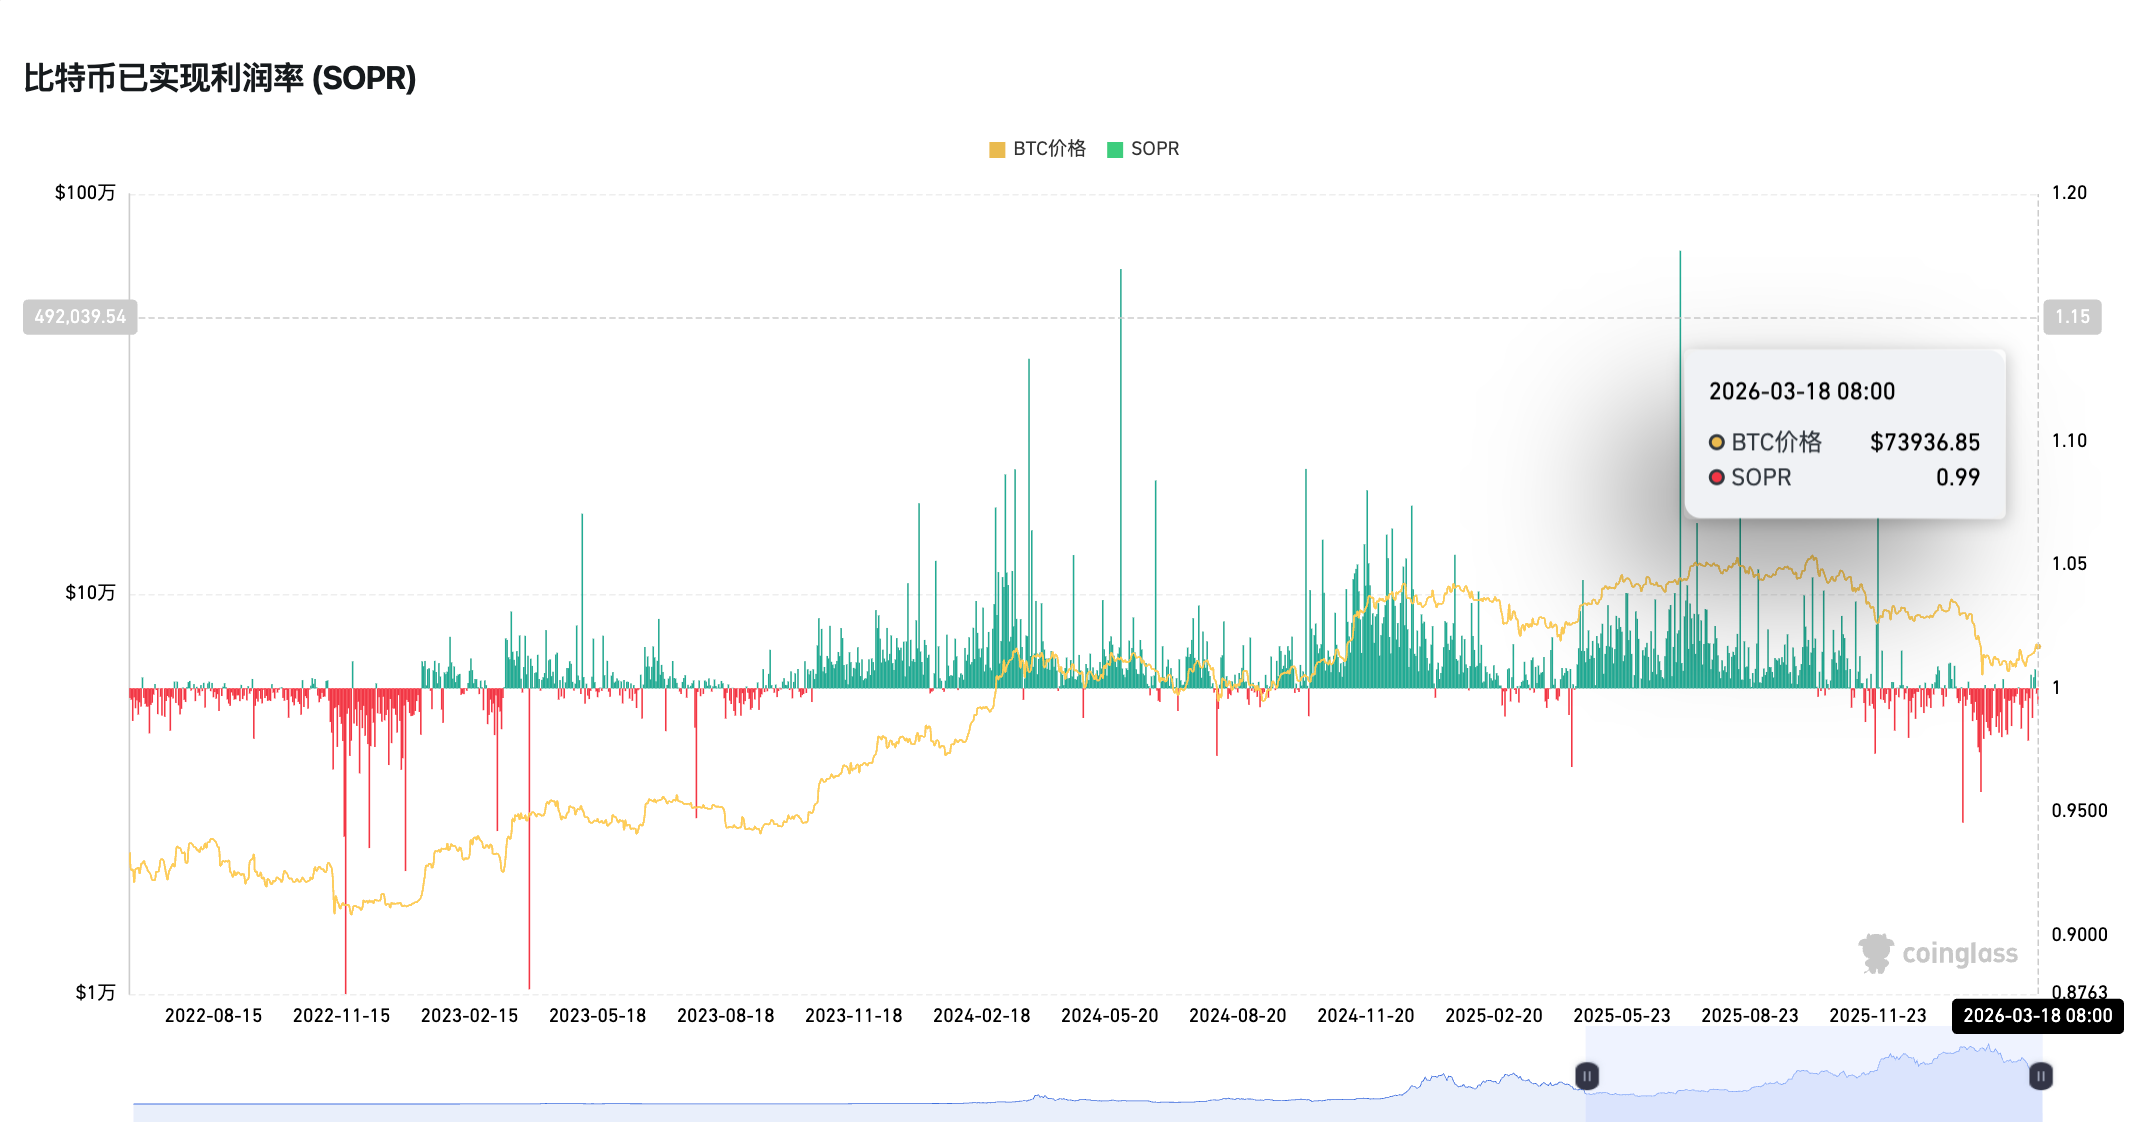
SOPR (Spent Output Profit Ratio) is typically used to measure the average profit/loss ratio of chips moved on-chain, with LTH-SOPR focusing on long-term holders who have held for more than 155 days. LTH-SOPR falling below 1 usually represents old chips starting to stop loss and sell, historically corresponding to the bottom of a deep bear market.

In February, Bitfinex published an analysis report pointing out that on-chain indicators showed the adjusted SOPR (Spent Output Profit Ratio) had fallen to the 0.92–0.94 range, reflecting that most coins were transferred at a loss, and structural pressure still existed.

On March 14, the Glassnode weekly report also pointed out that the 7-day moving average of STH-SOPR was at 0.985, having been continuously below 1 for a period exceeding that since October 2025—this is a typical bear market regime characteristic. This is a significant feature of the bear market cycle. At the same time, the net position change of LTH shows that old chips are still decreasing, but the speed has significantly slowed down, switching from aggressive distribution in Q3/Q4 2025 to a more moderate profit-taking mode.

Manifestation of failure: A decline without the surrender of old chips does not constitute a traditional cycle bottom. STH-SOPR consistently below 1 confirms a bear market, but the inflection point of LTH-SOPR is the true leading indicator of the bottom.

Indicator 4: BTC Mayer Multiple, Below 0.8 for nearly 50 days
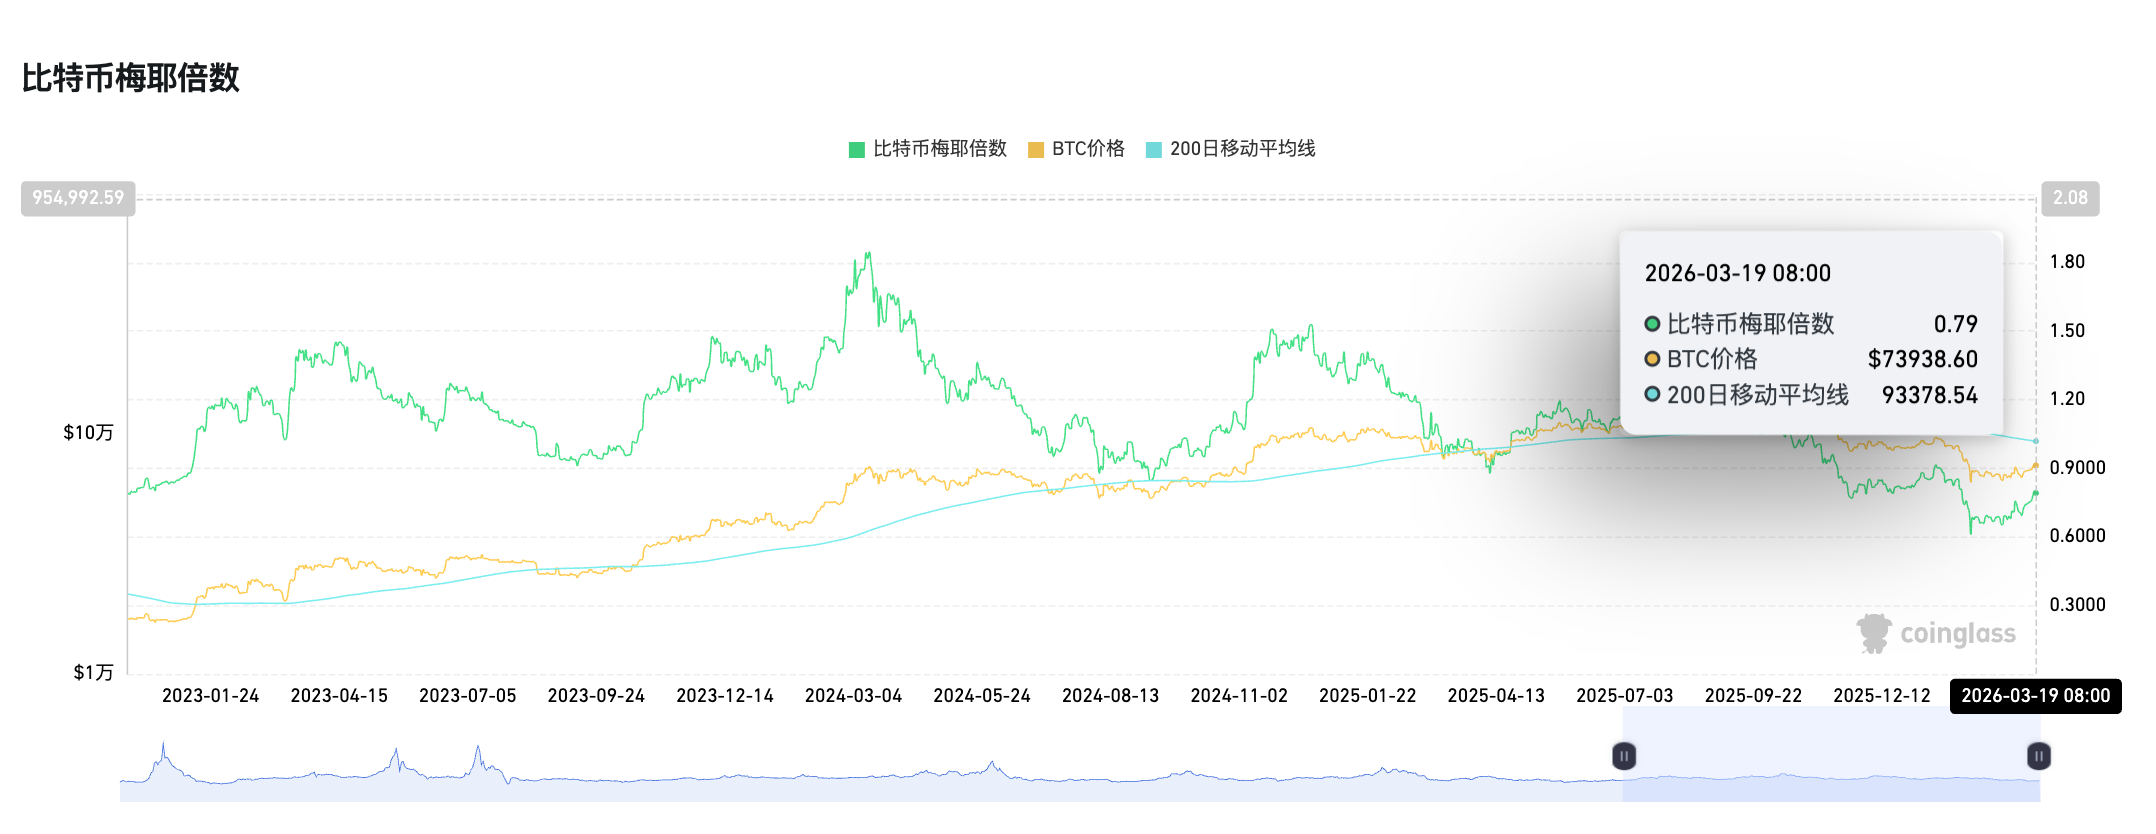
As an industry indicator derived simply by comparing BTC's current price to its 200-day moving average, the BTC Mayer Multiple, similar to the Nine God Index, has been below 0.8 for nearly 50 days. In the past, typically < 0.8 indicated a historically undervalued price range. Therefore, although this index is based only on simple price moving averages and does not rely on on-chain transaction data, being relatively less affected by institutionalization, it still struggles to constitute a sustained bottom-fishing indicator.

3 Indicators That May Reveal the Bear Market Bottom-Fishing Range: CVDD Iron Bottom, NUPL Negative Value, Stablecoin Exchange Inflow

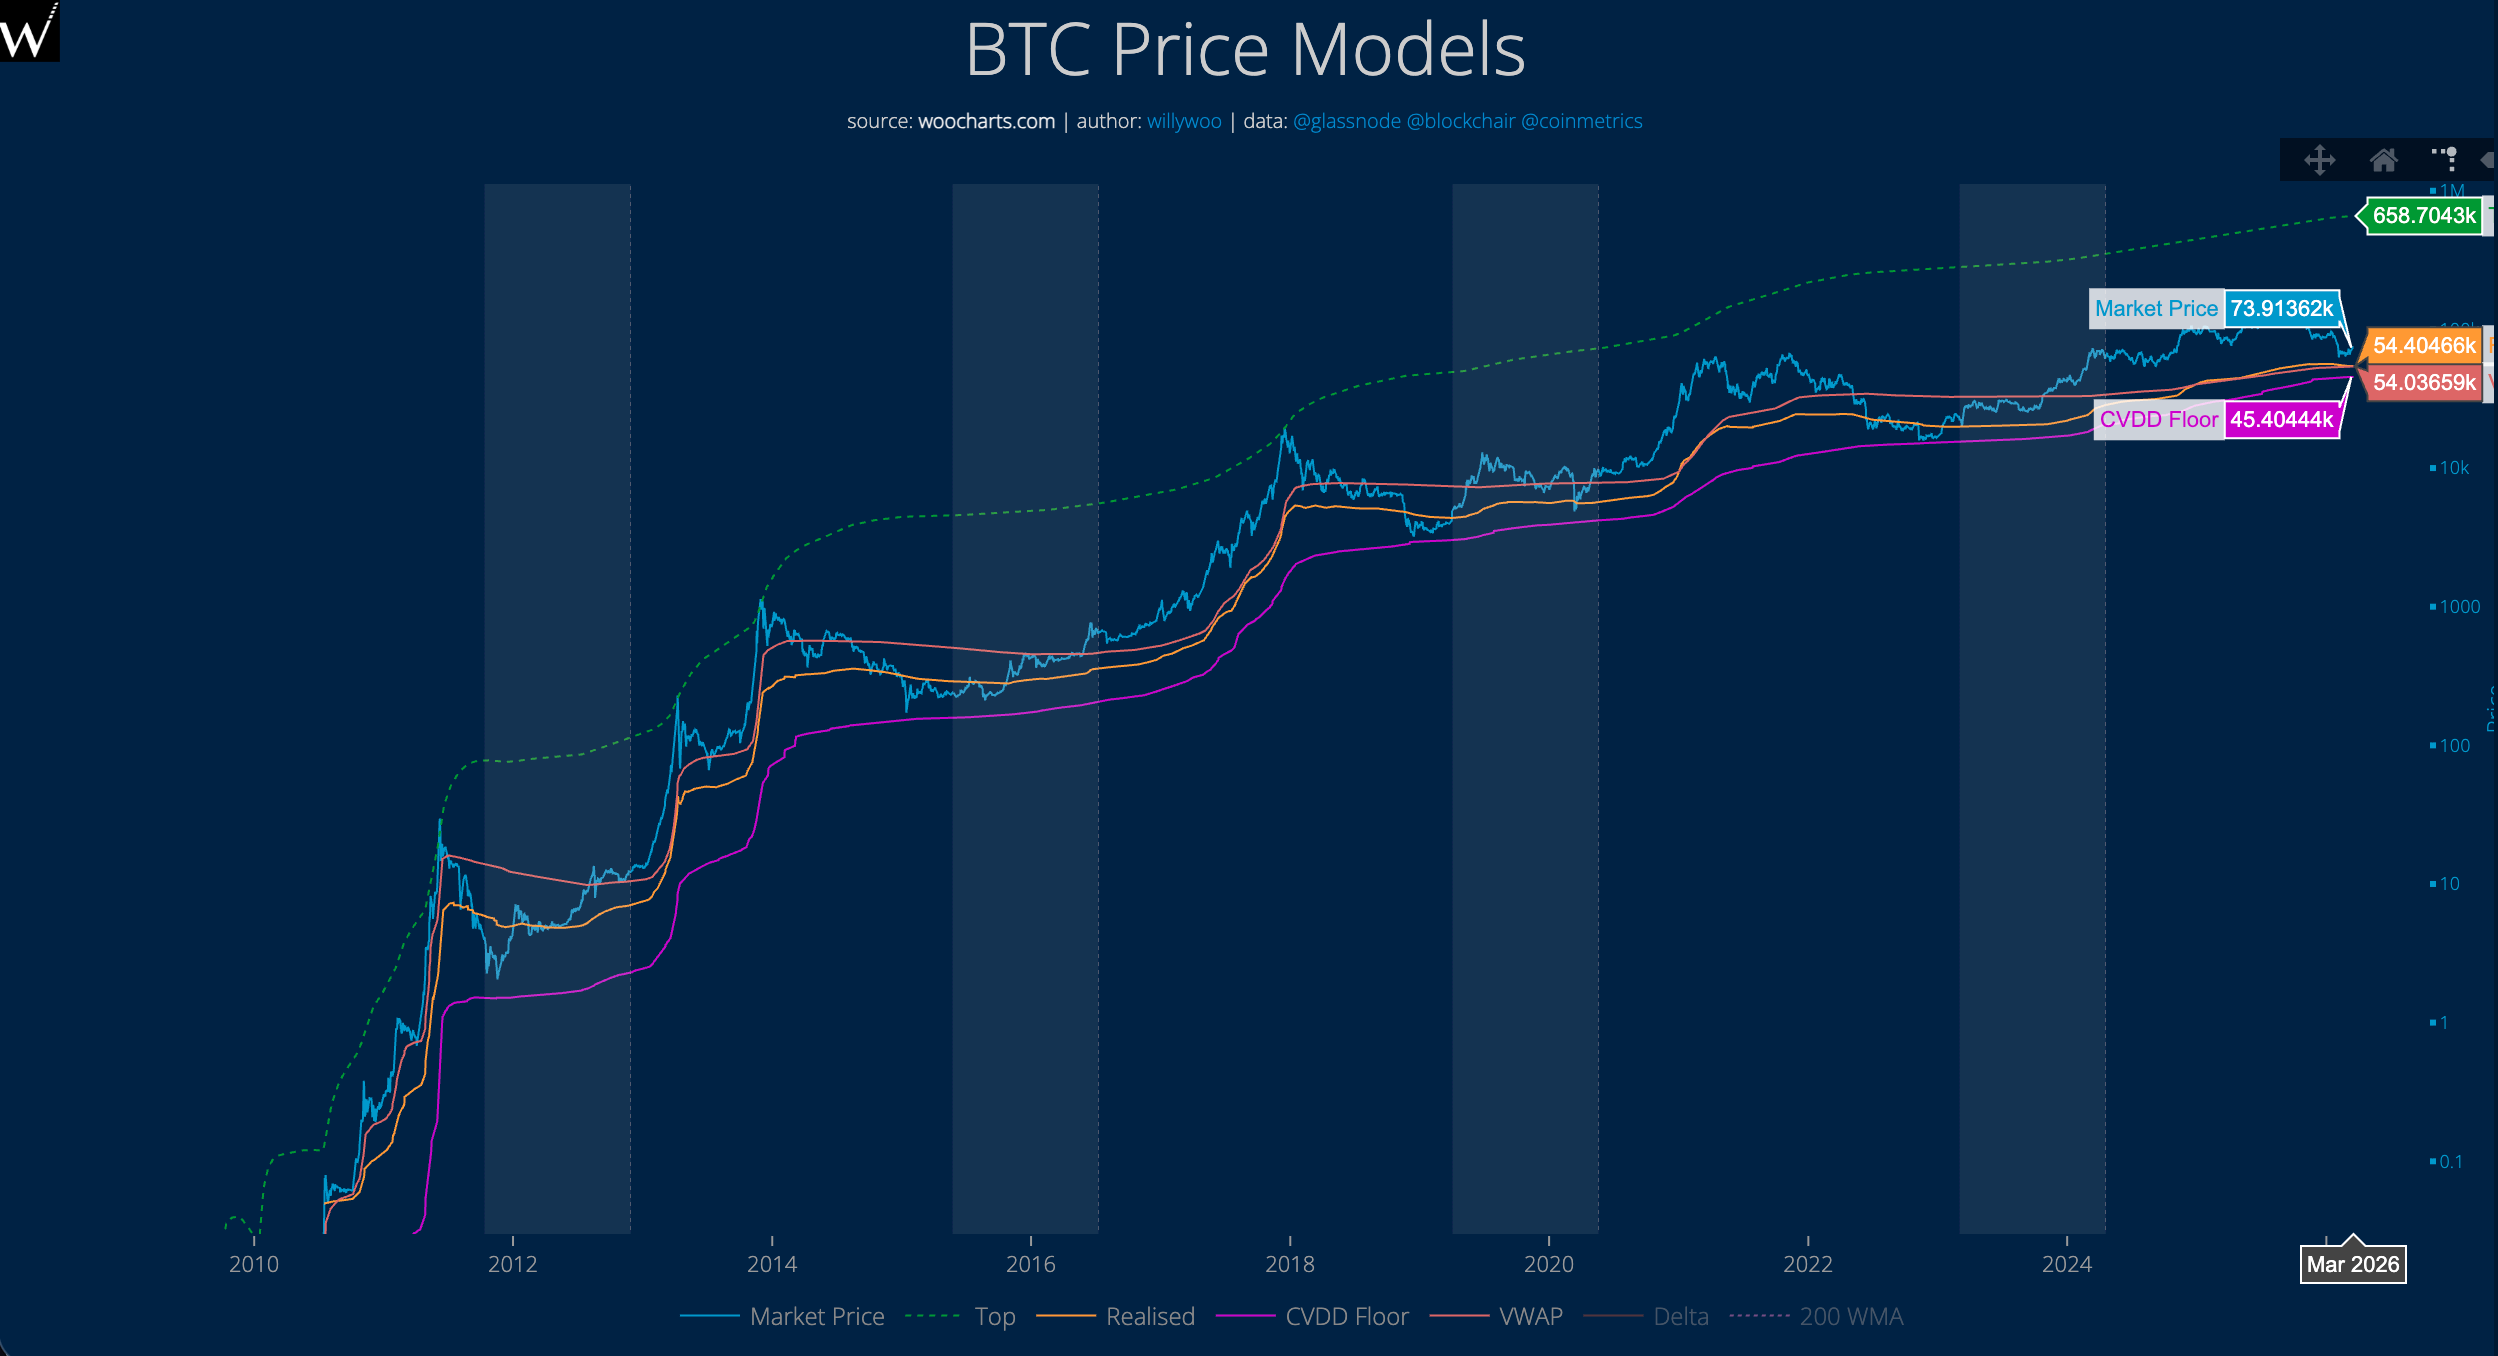
CVDD (Cumulative Value Days Destroyed): An Analyst's Personal Iron Bottom Model

This indicator was developed by crypto analyst Willy Woo to track the cumulative holding weight of BTC at different price ranges, constructing a "historical iron bottom" curve.

It is worth mentioning that this curve approached the BTC market price twice, in December 2018 and November 2022, but has never fallen below this curve to date.

Currently, the CVDD model shows the current BTC iron bottom is approximately $45,000.
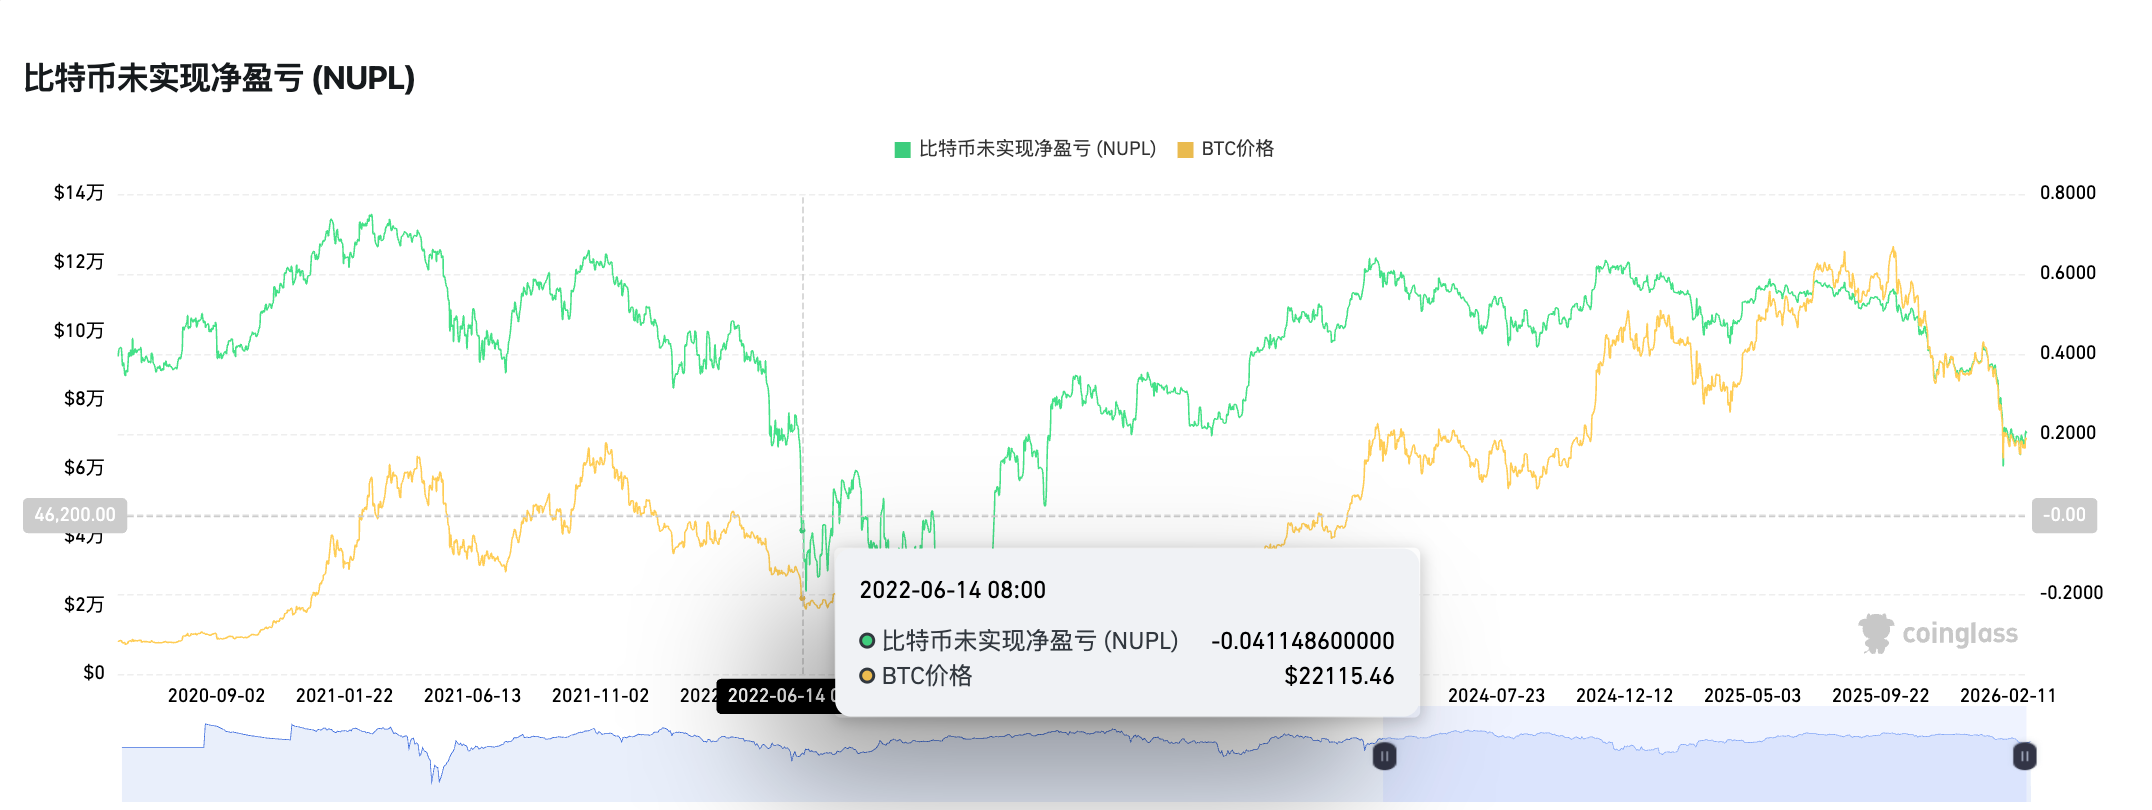
NUPL (Net Unrealized Profit/Loss): BTC Network Net Profit/Loss Value

This indicator is mainly used to measure the net value of unrealized profit and loss across the entire network. The general judgment criteria are as follows:

High NUPL (>50%): Peak driven by greed; ideal for profit-taking.

Low NUPL (<0%): Fear or capitulation; potential bottom.

It is worth mentioning that the NUPL indicator last fell into negative territory during the period from June 2022 to January 2023.

Currently, the NUPL indicator remains around 0.2.
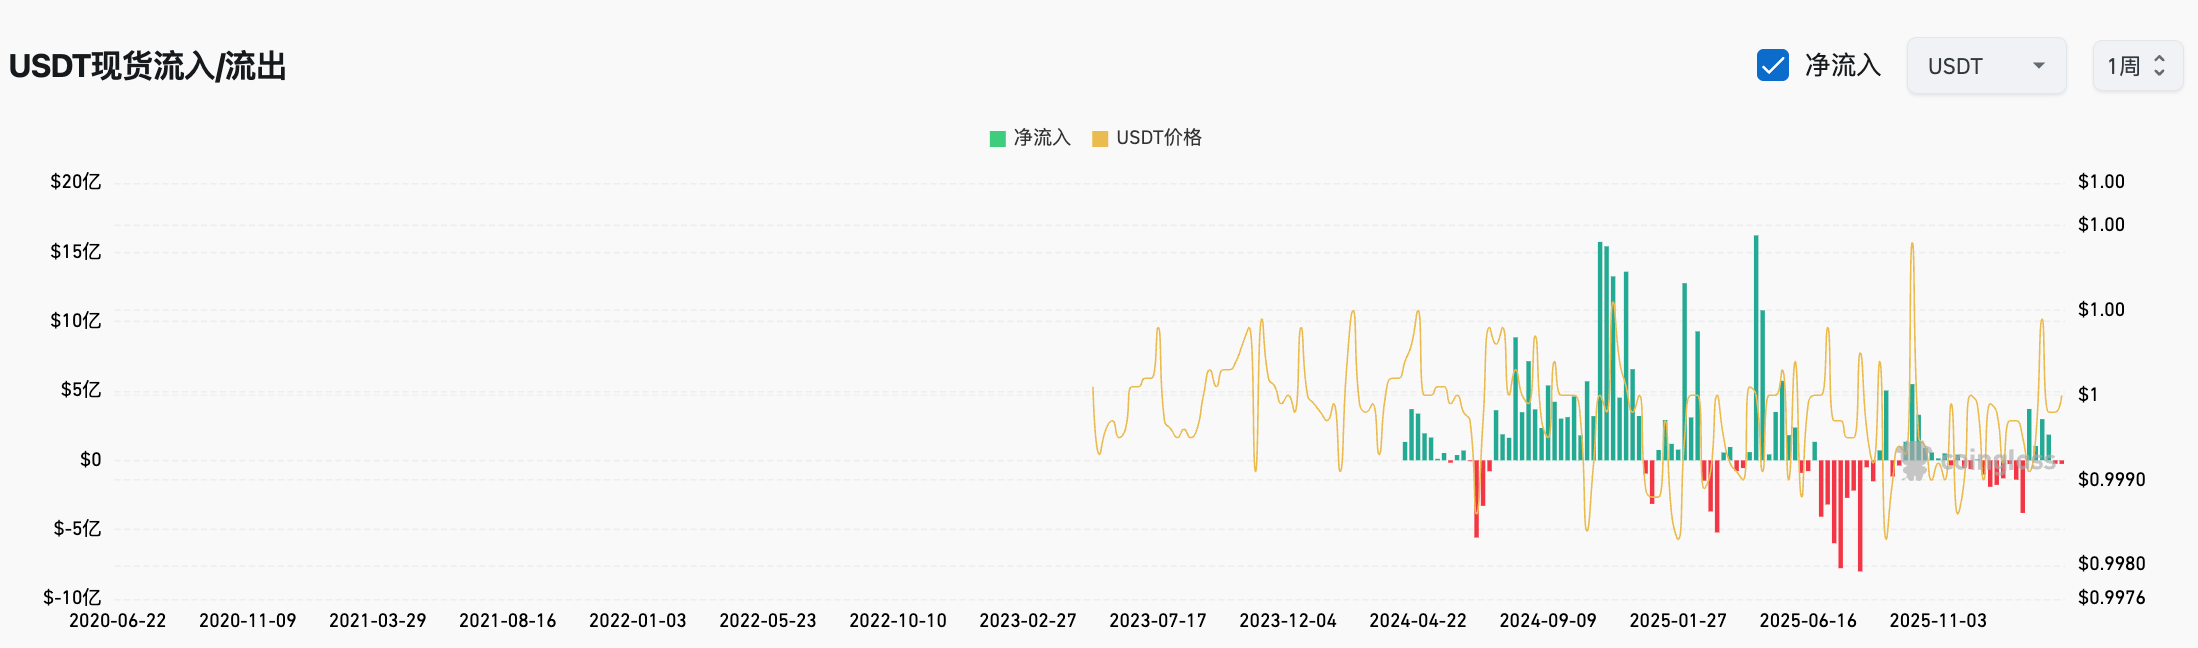
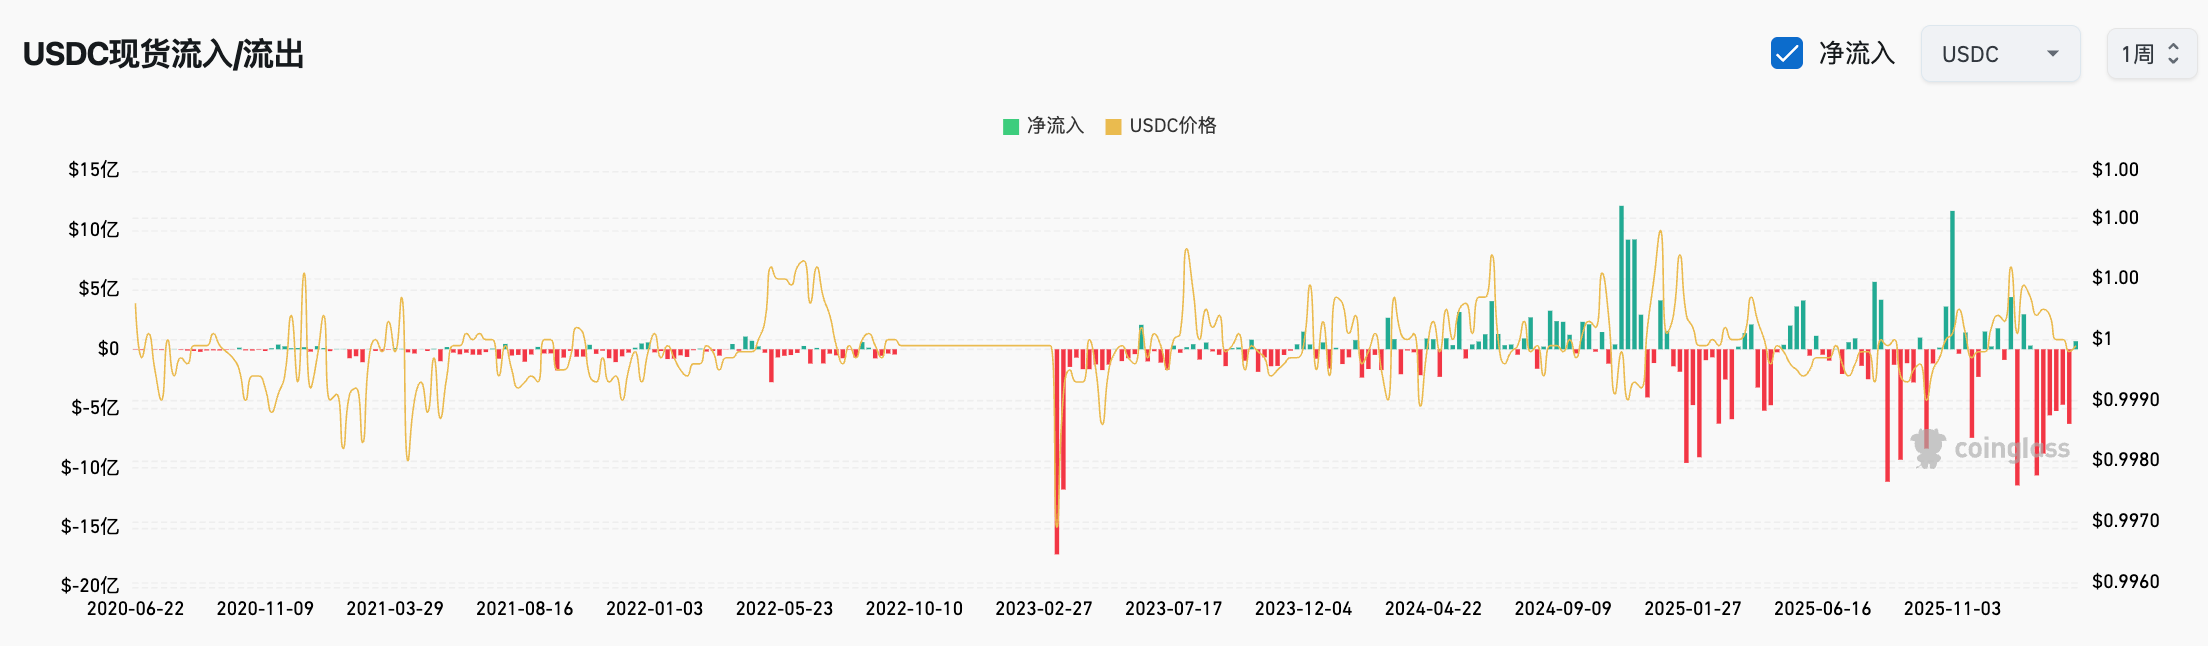
Stablecoin Exchange Netflow: Stablecoin Net Inflow to Exchanges

This indicator is mainly used to judge whether stablecoins are flowing back to exchanges, which is a precursor signal for market buying pressure. Historically, a sustained回升 in stablecoin inflow often precedes a substantial rebound in BTC price by 2-4 weeks.

The logic behind this indicator's effectiveness is that a price rebound without stablecoin回流 is just a technically driven bounce with very low sustainability.

Currently, USDT and USDC, which account for about 80% of the stablecoin market share, are still experiencing continuous outflows, indicating that the BTC bottom is still quite some distance away.
Conclusion: Buy When No One Cares, Sell When Everyone is Boisterous

At the end of the article, we must emphasize that the various indicators above are for reference only. Specific trading and investment strategies vary depending on each individual's or institution's different risk preferences, capital size, and even holding周期.

However, compared to bottom-fishing indicators, perhaps the escape indicators in the加密 industry are more flexible—just like the gold and silver that surged to everyone's attention some time ago. Once the discussion fever of BTC spreads to those around you, whether it's the grocery-shopping auntie on the subway or the hairdresser Tony, when they all start asking you about BTC, Crypto, cryptocurrency-related investments, perhaps timely selling will be the only best choice.

Hope each of us can wait for that day and start "a great retreat of our own".

Criptomoedas em alta

Perguntas relacionadas

QWhat are the four classic bottom-fishing indicators mentioned in the article that have become ineffective?

AThe four classic bottom-fishing indicators are MVRV Z-Score, Ahr999 Index (9 God Index), SOPR (including STH-SOPR and LTH-SOPR), and the BTC Mayer Multiple.

QAccording to the article, what is the 'iron bottom' price for BTC suggested by the CVDD model?

AThe CVDD model suggests the current 'iron bottom' for BTC is approximately $45,000.

QWhat does the NUPL indicator measure and what is its current value as stated in the article?

AThe NUPL (Net Unrealized Profit/Loss) indicator measures the net value of unrealized profit and loss across the entire Bitcoin network. Its current value is around 0.2.

QWhy has the MVRV Z-Score indicator become less effective, according to the article?

AThe MVRV Z-Score has become less effective because large-scale holdings by ETF custodians and DAT companies have systematically raised the realized value (RV), significantly increasing the denominator (standard deviation) of the Z-Score, making it extremely difficult to reproduce the historically 'extreme negative values' in the current market structure.

QWhat is the Stablecoin Exchange Netflow indicator, and what does its current trend suggest about the market bottom?

AThe Stablecoin Exchange Netflow indicator is used to judge whether stablecoins are flowing back into exchanges, which is a precursor signal for buying pressure. The article states that USDT and USDC, which account for about 80% of the stablecoin market, are still experiencing continuous outflow, suggesting the market is still some distance from the bottom.

Leituras Relacionadas

Weekly Editor's Picks (0725-0731)

Weekly Editor's Picks (0725-0731) provides a curated selection of deep analysis, filtering out market noise. Key themes from this week include: **Macro & Policy:** The Federal Reserve's upcoming meeting is marked by high uncertainty, balancing cooling inflation data against persistent price pressures. Meanwhile, the U.S. crypto regulatory Clarity Act faces critical political hurdles, with its 2026 passage probability seen as low. **Investing & Crypto:** Analysis suggests long-term crypto success depends on conviction through volatile cycles, focusing on assets like Bitcoin and core smart contract platforms. A trend noted is the increasing similarity between global equity markets (especially tech) and crypto, driven by narrative and leverage. Several major crypto protocols show strong revenue growth, but this isn't always translating to token price appreciation due to sell pressure and structural factors. **AI & Semiconductors:** Nvidia's rising credit default swap rates signal market concern over AI infrastructure financing risks. The storage sector experienced volatility as markets began pricing in potential 2027 oversupply. Despite a record profitable quarter, SK Hynix's results were deemed "below expectations," reflecting heightened investor demands for future growth visibility. **Markets & DeFi:** TradeXYZ demonstrated remarkable accuracy in pre-market pricing for a major A股 listing. The token ONDO saw gains, linked to its growing role in the on-chain tokenized stock ecosystem. **Ethereum:** Post-Pectra upgrade, a major structural shift is underway as Lido begins migrating millions of ETH to new validator architectures designed for capital efficiency. **Also Highlighted:** Butian's bullish stock market move; OpenAI's Altman promising major advances; Samsung and SK Hynix securing large AI chip deals; Apple reaching a $5T market cap; and ongoing discussions around exchange security following Poolin's bankruptcy case.

marsbitHá 29m

Weekly Editor's Picks (0725-0731)

marsbitHá 29m

Low Investment Isn't Apple's Immunity Pass

While Meta and Google face investor scrutiny over ballooning AI capital expenditures, Apple's minimal AI investment has paradoxically become a strength. Its market cap recently reclaimed the global top spot, surpassing $5 trillion. The irony is deep: Apple's own AI efforts have lagged, with "Apple Intelligence" delayed and core talent lost, forcing reliance on partners like Google Gemini and Alibaba's Qianwen. Its Q3 FY2026 (Q2 CY) earnings initially seemed stellar. Revenue hit $109.4B (up 16% YoY), with iPhone and Mac sales, growing 22% and 29% respectively, driving most of the growth. However, the stock fell over 8% post-earnings. The primary concern was a weaker Q4 revenue growth forecast of 9-11%, below expectations, due to looming supply chain constraints. Apple is feeling the indirect cost of the AI boom. Soaring memory and chip prices, fueled by massive data center investments from Microsoft, Amazon, and others, are forcing Apple to raise Mac and iPad prices significantly. The upcoming iPhone launch is also expected to see substantial price hikes. Despite avoiding heavy AI infrastructure spending—its capital expenditures are actually down 28%—Apple cannot escape the industry-wide supply and cost pressures. While Apple's operating cash flow remains robust, its substantial R&D spending (up 32% YoY) has yet to yield major AI breakthroughs. As Tim Cook prepares to step down as CEO, Apple faces a challenging transition: balancing its premium hardware success against the strategic and cost pressures of the AI era it has so far cautiously navigated.

marsbitHá 1h

Low Investment Isn't Apple's Immunity Pass

marsbitHá 1h

PA Graphics Explanation | One Chart to Understand the Major Web3 Events in August 2026

**PANews Crypto Calendar: Key Web3 Events in August 2026** PANews introduces its revamped crypto calendar, featuring comprehensive coverage, flexible filtering, and easy export options. The market in August will be shaped by multiple key events across macroeconomics, regulation, tokenomics, and project developments: * **Macro & Policy:** Key US economic data releases (July Non-Farm Payrolls, CPI), the Federal Reserve meeting minutes, and the Jackson Hole Economic Symposium will be in focus. On the regulatory front, the US Senate plans to release a new draft of the *CLARITY Act*, while the EU's expanded crypto ban against Belarus comes into effect. * **Token Unlocks:** Significant token unlocks are scheduled for assets including ENA, AVAX, CONX, ZRO, and KAITO, which may influence market volatility. * **Project Updates & Shutdowns:** Several services, including Exchange Art, Ctrl Wallet, Zapper, NFTfi, and Summer.fi, are set to cease operations or undergo major adjustments. Users are advised to manage their assets accordingly. * **Corporate Activity:** Q2 earnings reports from companies like SpaceX, Circle, and Nvidia are due. Unitree Robotics will initiate its IPO subscription on the STAR Market, and Moonshot AI plans to begin a Pre-IPO financing round. * **Industry Events:** Major conferences such as Bitcoin Asia 2026 and the 2026 Digital Expo will take place. The overarching market narrative for August will revolve around macroeconomic expectations, regulatory developments, token unlock schedules, and ongoing industry consolidation.

marsbitHá 1h

PA Graphics Explanation | One Chart to Understand the Major Web3 Events in August 2026

marsbitHá 1h

Wall Street's Most Famous 'Cassandra' Now Has His Sights Set on Nvidia

Michael Burry, the famed "Big Short" investor, has once again captured Wall Street's attention with a series of short positions against major tech and semiconductor stocks, most notably Nvidia. In late June and July, through his "Cassandra Unchained" newsletter, Burry disclosed short bets against Nvidia, Tesla, Applied Materials, Caterpillar, the SOXX semiconductor ETF, and later, Micron Technology. His core thesis revolves around potential distortions in the AI infrastructure boom, specifically questioning whether extended depreciation schedules (e.g., 6 years vs. a realistic 2-3 years for AI chips) by cloud giants like Microsoft and Google artificially inflate profits. He also raises concerns about possible "off-balance-sheet circular financing," where chip demand might be propped up by vendor-backed funding to clients. Nvidia's stock experienced volatility following these disclosures, briefly dipping but largely holding near Burry's reported entry points, leaving his positions roughly flat or slightly underwater as of late July. This move is part of a pattern for Burry, whose track record since his legendary 2008 bet is mixed. He has faced notable losses, such as on Tesla in 2021, while scoring on broader market turns like the 2020 pandemic crash. His methodology focuses intensely on free cash flow and scrutinizing original financial documents to spot overvaluation and structural risks, but it often struggles with timing the market. The article contrasts Burry's stance with other prominent investors. Steve Eisman, another "Big Short" figure, is not shorting Nvidia, citing strong fundamentals but expressing nervousness about sustainability. Jim Chanos agrees with the broad "accounting mismatch" concern—comparing it to the dot-com bubble—but targets financial leverage in private equity firms rather than the chip stocks themselves. While Nvidia's short interest remains relatively low at 1.3-1.4% of float, the massive stock size means absolute short losses have been significant, exceeding $5 billion earlier this year. The piece concludes that for ordinary investors, the key takeaway is not replicating specific short bets but learning from the critical frameworks these investors use: questioning rosy accounting, identifying structural vulnerabilities, and maintaining skepticism during market euphoria, even if pinpointing the exact catalyst for a downturn remains elusive.

marsbitHá 1h

Wall Street's Most Famous 'Cassandra' Now Has His Sights Set on Nvidia

marsbitHá 1h

Trading

Spot

Artigos em Destaque

Como comprar 4

Bem-vindo à HTX.com!Tornámos a compra de 4 (4) simples e conveniente.Segue o nosso guia passo a passo para iniciar a tua jornada no mundo das criptos.Passo 1: cria a tua conta HTXUtiliza o teu e-mail ou número de telefone para te inscreveres numa conta gratuita na HTX.Desfruta de um processo de inscrição sem complicações e desbloqueia todas as funcionalidades.Obter a minha contaPasso 2: vai para Comprar Cripto e escolhe o teu método de pagamentoCartão de crédito/débito: usa o teu visa ou mastercard para comprar 4 (4) instantaneamente.Saldo: usa os fundos da tua conta HTX para transacionar sem problemas.Terceiros: adicionamos métodos de pagamento populares, como Google Pay e Apple Pay, para aumentar a conveniência.P2P: transaciona diretamente com outros utilizadores na HTX.Mercado de balcão (OTC): oferecemos serviços personalizados e taxas de câmbio competitivas para os traders.Passo 3: armazena teu 4 (4)Depois de comprar o teu 4 (4), armazena-o na tua conta HTX.Alternativamente, podes enviá-lo para outro lugar através de transferência blockchain ou usá-lo para transacionar outras criptomoedas.Passo 4: transaciona 4 (4)Transaciona facilmente 4 (4) no mercado à vista da HTX.Acede simplesmente à tua conta, seleciona o teu par de trading, executa as tuas transações e monitoriza em tempo real.Oferecemos uma experiência de fácil utilização tanto para principiantes como para traders experientes.

695 Visualizações TotaisPublicado em {updateTime}Atualizado em 2026.06.02

Como comprar 4

Discussões

Bem-vindo à Comunidade HTX. Aqui, pode manter-se informado sobre os mais recentes desenvolvimentos da plataforma e obter acesso a análises profissionais de mercado. As opiniões dos utilizadores sobre o preço de 4 (4) são apresentadas abaixo.

活动图片