This week, the market is seeking direction amid fluctuations, with opportunities and risks coexisting. HYPE's daily Wave V structure faces a critical validation point, where the success or failure of the $40.17 support will determine the subsequent trend; BTC, meanwhile, hovers between the continuation of the D-wave rebound and resistance zone pressure, with the bull-bear battle in the $73,500~$79,000 range remaining the core focus.
Following the trend and adhering strictly to discipline are key to steady progress in complex market conditions.
Summary of Core Trading Views for This Week:
• Analysis of HYPE's current price structure. (Details in Part 1)
• HYPE's market forecast and short-term trading strategy for this week. (Details in Part 2)
• Analysis of BTC's multi-timeframe price structure. (Details in Part 3)
• BTC's market forecast and medium-to-short-term trading strategies for this week. (Details in Part 4)
Market Validation of Last Week's Trading Strategies and Core Views:
• HYPE Short-term Trading Results: HYPE completed one short-term long position trade (1x leverage) last week, achieving a cumulative return of approximately 6.80%. (Details in Table 1)
• Market Validation of HYPE Price Forecast: In our previous article, we indicated that the rebound starting from the April 2nd low of $34.44 for HYPE could potentially be a daily Wave V uptrend in terms of wave structure. The current market movement validates our previous view. Last week, the market rebound reached a high of $45.75, successfully breaking through the March 18th Wave III high of $43.78 and setting a new high for the current upward trend.
• Validation of BTC Medium-term Trading Results: Bitcoin followed the established medium-term strategy last week, continuing to hold the short position established at $89,000 (1x leverage). As of last week's close (approx. $73,800), the profit is approximately 17.08%, with a maximum profit of about 32.58% during the period.
• Market Validation of BTC Price Forecast: In last week's article, we stated that the market would maintain a wide-range volatile consolidation pattern. The current market movement validates our previous forecast.
I. HYPE: Price Structure Analysis
HYPE_4-hour K-line Chart
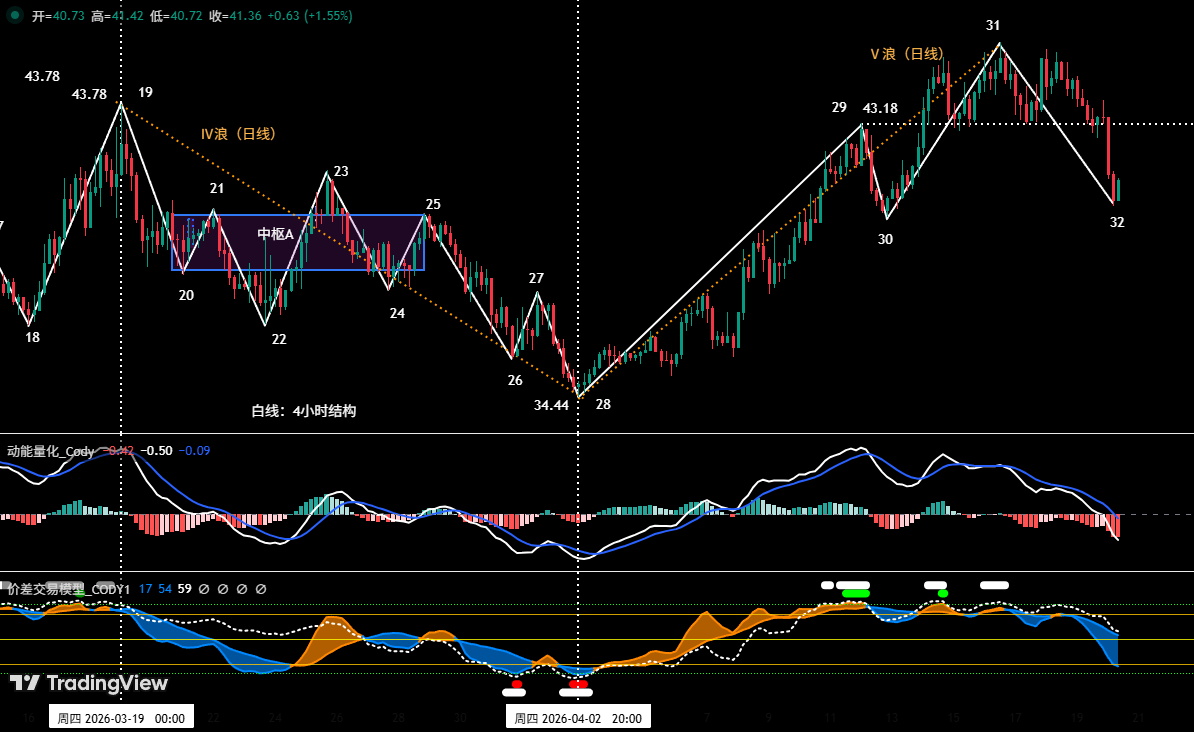
Figure 1
1. As shown in (Figure 1), HYPE reached a new high of $45.76 on April 16th, setting a new rebound high since the January 21st low of $20.46, and has broken through the previous high of $43.78 from March 18th (the Wave III high). Therefore, the upward movement starting from the April 2nd low of $34.44 can tentatively be viewed as a daily Wave V uptrend structure, currently in progress.
2. As shown in (Figure 1), this daily Wave V can be further subdivided in the 4-hour cycle into an upward structure consisting of 4 segments: 28-29, 29-30, 30-31, and 31-32.
3. The market is currently running the 31-32 correction segment.
• In HYPE's 4-hour structure, our self-built momentum量化 model监测到, two momentum signal lines have simultaneously moved below the zero axis, indicating that this correction segment may be weak, and the correction time might be extended.
• Currently, the potential correction endpoint (i.e., endpoint 32) is approaching the previous support level of $40.17 (i.e., endpoint 30).
II. HYPE Market Forecast and Short-term Trading Strategy for This Week
1. HYPE Market Forecast for This Week:
As shown in (Figure 1), focus on whether endpoint 32 breaks below endpoint 30 (i.e., $40.17):
• If it holds above, expect boxed consolidation between $40.17-$45.76;
• If it breaks below this support level, and the subsequent rebound high fails to exceed $45.76 (i.e., endpoint 31), it would form the classic technical pattern of "correction breaking previous low, but subsequent rebound not making a new high." This would mean there is a high probability that the daily Wave V uptrend structure starting from the April 2nd low has already completed and ended at $45.76.
2. HYPE Short-term Trading Strategy for This Week:
• Based on the forecast of the overall upward trend, adhere to the strategy of "follow the trend, buy on dips".
• According to signals from our self-built量化模型, use the 30-minute/60-minute cycle as the operation period, utilizing 30% of position size to capture long entry opportunities.
• Entry Strategy: HYPE faces correction demand early this week. If the price pulls back near the key support of $40.17 and shows signals confirming it is holding above support, combined with bottom buy signals triggered by the two major models, consider entering long positions, strictly adhering to stop-loss discipline.
III. Bitcoin Multi-Timeframe Price Structure Analysis
1. BTC Daily Level Wave Division: (Based on行情 after the October 6, 2025 high)
Bitcoin _ Daily K-line Chart:
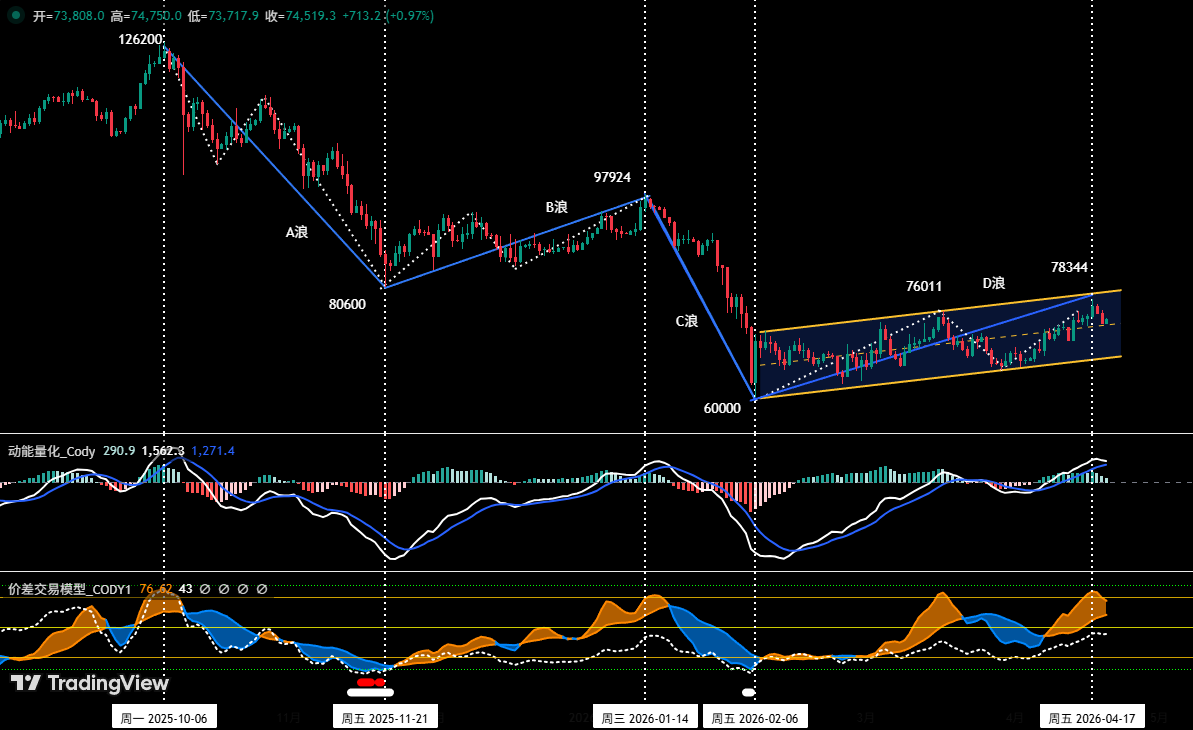
Figure 2
As shown in (Figure 2), since Bitcoin's rebound starting from the February 6th low of $60,000 not only reached a new rebound high of $78,333 on April 17th but has run for about 73 trading days as of April 19th, its duration and magnitude have significantly exceeded the previously forecasted "C-2 wave rebound within the C-wave correction" (e.g., its持续反弹时间已远超 the 54-day B-wave rebound). Therefore, based on Elliott Wave Theory analysis principles, the original framework may need adjustment. We are more inclined to redefine this upward move starting from $60,000 as a larger-level "D-wave rebound," which better aligns with the客观事实 of the current market exchanging time for space and the extended rebound cycle.
The specific medium-term correction wave division can be optimized as follows:
• A-wave correction (impulsive decline): Started from the October 6, 2025 high of $126,200, ended at the November 21, 2025 low of $80,600, lasting about 46 days, with a maximum decline of ~36%. This wave established the medium-term correction pattern.
• B-wave rebound (complex correction): Started from the November 21, 2025 low of $80,600, ended at the January 14, 2026 high of $97,924, lasting about 54 days, with a maximum gain of ~21.5%. This was a correction against the A-wave decline.
• C-wave correction (main decline wave): Started from the January 14, 2026 high of $97,924, rapidly declined to the February 6, 2026 low of $60,000, lasting about 22 days, with a maximum decline of ~38.7%. This wave completed the main spatial part of the correction.
• D-wave rebound (currently ongoing/possibly in final stages): Started from the February 6, 2026 low of $60,000. As of April 19th, it has run for about 73 days, with a maximum gain of ~30.6% (from $60,000 to $78,333). The characteristics of this rebound are prolonged duration, complex structure, and it currently faces the test of a critical time window and price resistance zone (e.g., $79,000-$80,600). If the D-wave holds, after the coin price rebound ends, it may be followed by a corresponding "E-wave" correction.
2. BTC: In-Depth Price Structure Analysis
Bitcoin _4-hour K-line Chart
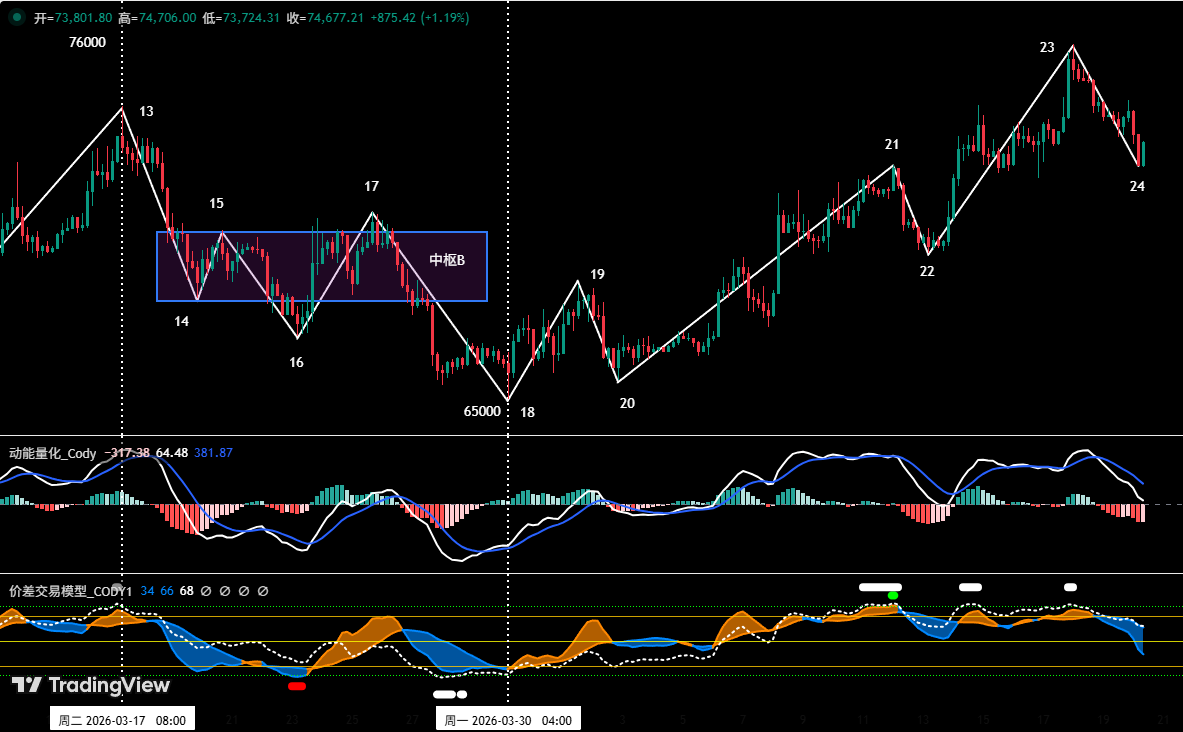
Figure 3
• Based on行情演变 after the March 30th low of $65,000.
• As shown in (Figure 3), BTC started a震荡上行 trend from the March 30th low. From endpoint 18 to endpoint 24, it consists of a 6-segment structure: 18-19, 19-20, 20-21, 21-22, 22-23, 23-24.
• The chart shows: From endpoint 18 to endpoint 23, the market has run a relatively clear 5-wave rebound structure, and is currently running the 23-24 segment. From our self-built spread trading model, recent top warning signals have been continuously issued (green and white dots in the chart), indicating that technical indicators are in severe overbought territory, and the market has short-term correction需求.
IV. Bitcoin Market Forecast and Trading Strategy for This Week
1. BTC Market Forecast for This Week:
• Core View for the Week:
Currently maintaining consolidation within the $73,500~$79,000 range, focus on the bull-bear battle near the upper and lower bounds of this range. If the rebound breaks above the upper bound, the market will experience a震荡反弹, but with limited upside; if it effectively breaks below the lower bound, the coin price may further test the key support near $69,500.
2. Core Resistance Levels:
• First Resistance Zone: $79,000~$80,600 area (near the November 2025 low)
• Second Resistance Zone: $83,500~$84,500 area (previous multi-empty筹码密集成交区)
3. Core Support Levels:
• First Support Level: Near $73,500 (previous important support level)
• Second Support Level: Near $69,500 (previous important support level)
• Third Support Zone: $65,000~$66,000 area (near the lower轨 of the consolidation range)
4. Trading Strategy for This Week (Excluding突发消息影响):(04.20~04.26)
1. Medium-term Strategy:
Bitcoin _ Daily K-line Chart: (Position Monitoring Model)
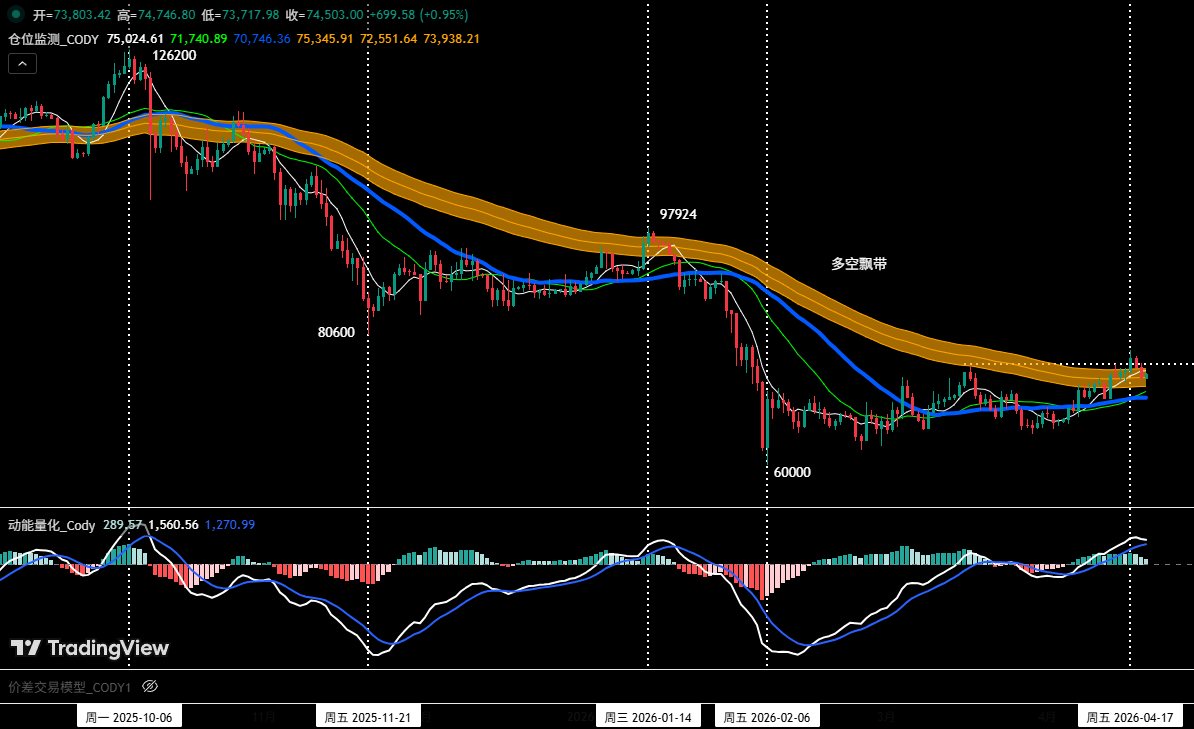
Figure 4
Position Monitoring Model: As shown in (Figure 4), currently, the coin price is震荡 near the bull-bear ribbon. According to our strategy rules, we are暂时 holding the 60% short position established at $89,000 (January 28th).
• If the coin price反弹 effectively stabilizes above the bull-bear ribbon this week, clear all medium-term positions.
2. Short-term Strategy: Use 30% of position size, set stop-loss points, and look for "spread" opportunities based on support and resistance levels. (Use the 30-minute/60-minute cycle as the operation period).
3. Based on the forecast of a medium-term bearish trend, currently adhere to the operational principle of "follow the trend and go short". To dynamically respond to the market's complex evolution and combined with signals from our self-built trading model, we will formulate two short-term operation plans, A/B:
• Plan A: Rebound meets resistance, sell high.
• Entry: When the coin price rebounds to the $76,500~$79,000 area, triggers resistance signals, and combines with model top signals, establish a 30% short position.
• Risk Control: Initial stop-loss set above $80,600.
• Exit: When the coin price falls near important support levels and combines with model signals, gradually close positions to take profits.
• Plan B: Follow the breakout short.
• Entry: If the coin price continues to adjust and effectively breaks below the support near $73,500, combined with model top signals,顺势 establish a 30% short position.
• Risk Control: Initial stop-loss set above $74,500.
• Exit: When falling to support levels and combined with model signals, gradually close positions to take profits.
V. HYPE: Operation Review
1. Short-term Operation Review: (See Table 1)
We strictly followed the operation plan, based on trading signals issued by our self-built spread trading model and momentum量化 model, and completed one short-term (long) operation last week, achieving a cumulative trading profit of 6.80%.
2. HYPE Short-term Trade Details Summary: (Leverage*1x)
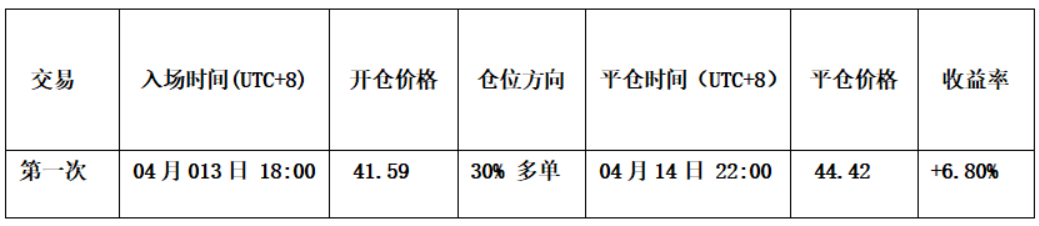
Table 1
3. Short-term Trade Review: (See Figure 5)
• Entry Strategy: First, based on the judgment of the market's Wave V uptrend; second, the spread trading model had already issued early bottom warning signals (good points in the chart); third, the two momentum lines in the momentum model simultaneously moved above the zero axis, and the two major models issued共振上涨 signals. We established a 30% long position at $41.59.
• Exit Strategy: When the price rose near $45 and encountered resistance,同时 the spread trading model triggered strong top warning signals (green dot + white dot), therefore, we closed all positions near $44.42.
• Summary: This trade successfully profited approximately 6.80%.
HYPE_60-minute K-line Chart: (Momentum Quant Model + Spread Trading Model)
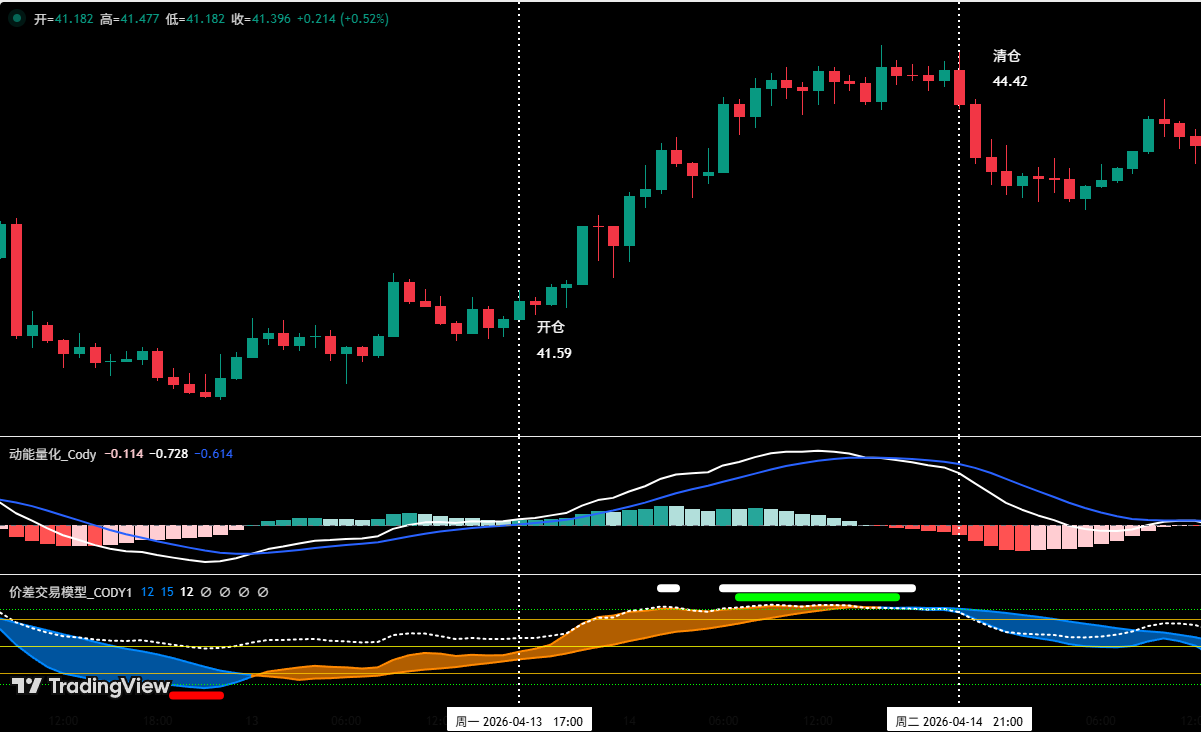
Figure 5 (Short-term Trade Illustration)
VI. Special Notes:
1. When opening a position: Immediately set the initial stop-loss level.
2. When profit reaches 1%: Move the stop-loss to the entry cost price (breakeven point), ensuring capital safety.
3. When profit reaches 2%: Move the stop-loss to the position of 1% profit.
4. Continuous tracking: Thereafter, for every additional 1% profit the coin price makes, move the stop-loss level同步 by 1%, dynamically protecting and locking in profits.
Financial markets change rapidly, all market analysis and trading strategies require dynamic adjustment. All views, analysis models, and operational strategies involved in this article are derived from personal technical analysis, intended solely for personal trading log purposes, and do not constitute any investment advice or operational basis. The market involves risks, investment requires caution, please do not make decisions based solely on this.