Zcash surges 20% after breakout – ZEC traders, watch THIS for next move

ambcryptoPublished on 2026-03-17Last updated on 2026-03-17

Abstract

Zcash (ZEC) surged over 20% in 24 hours, breaking out of a descending wedge pattern and signaling a potential bullish shift. The price moved from the $194.90 support level toward the $300 resistance zone, with RSI strengthening to 58, indicating growing buying interest without overbought conditions. However, underlying metrics present mixed signals: Spot Taker CVD remains sell-dominant, suggesting persistent selling pressure, and the funding rate is negative (-0.032%), reflecting heavy short positioning. This sets the stage for potential short squeezes and increased volatility near key resistance. While the breakout shows strength, the sustainability of the rally depends on overcoming layered resistance and resolving conflicting market dynamics.

Zcash has surged over 20% in 24 hours as trading volume rises over 76%, reflecting a sharp increase in participation and aggressive positioning.

This expansion in activity signals renewed interest after a prolonged decline. Zcash [ZEC] has pushed upward from the $194.90 support zone, showing buyers stepping in with conviction.

However, underlying metrics still present mixed signals that require careful interpretation.

While price continues climbing, structural resistance remains nearby, which could influence short-term direction.

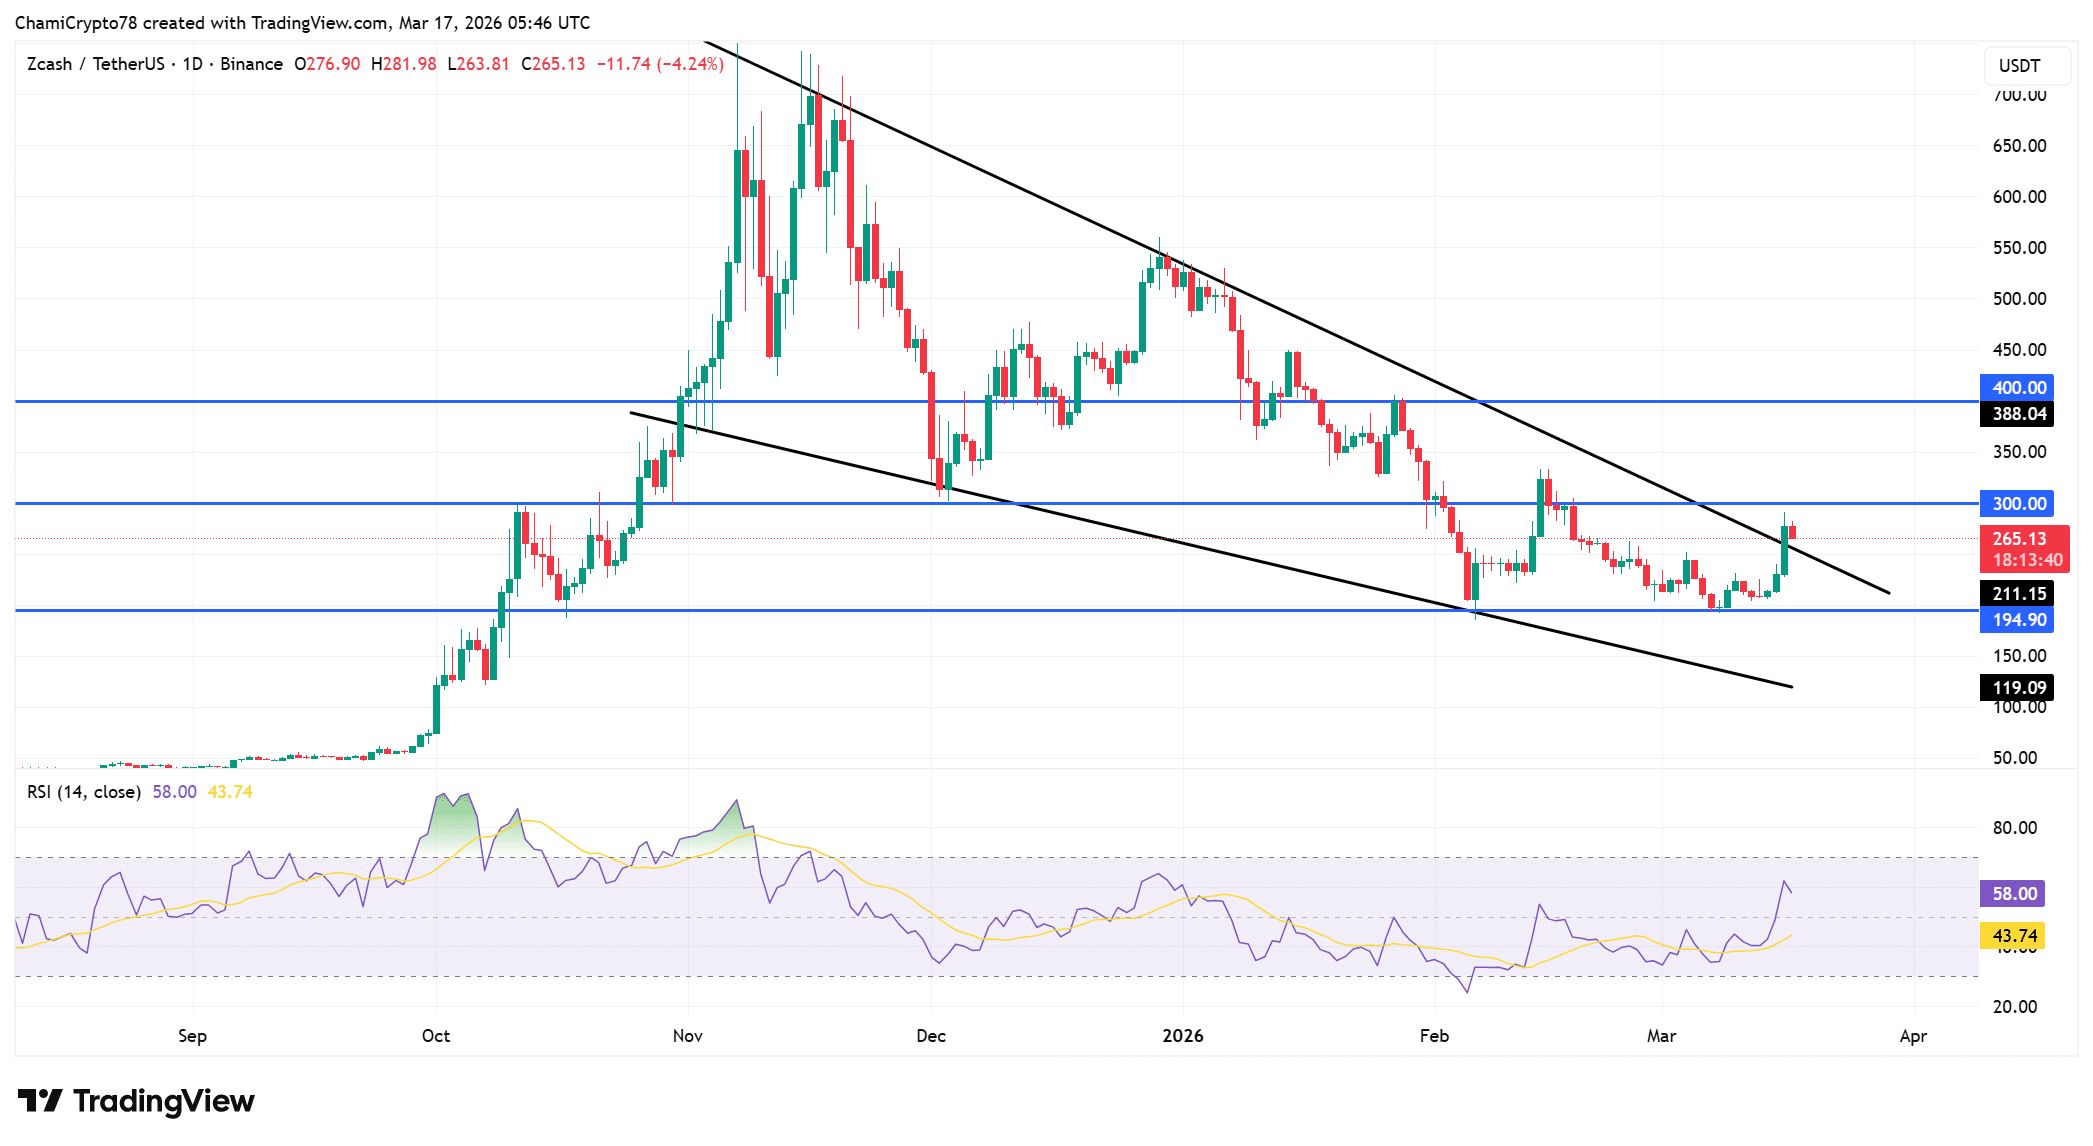
Breakout from wedge signals recovery push for Zcash

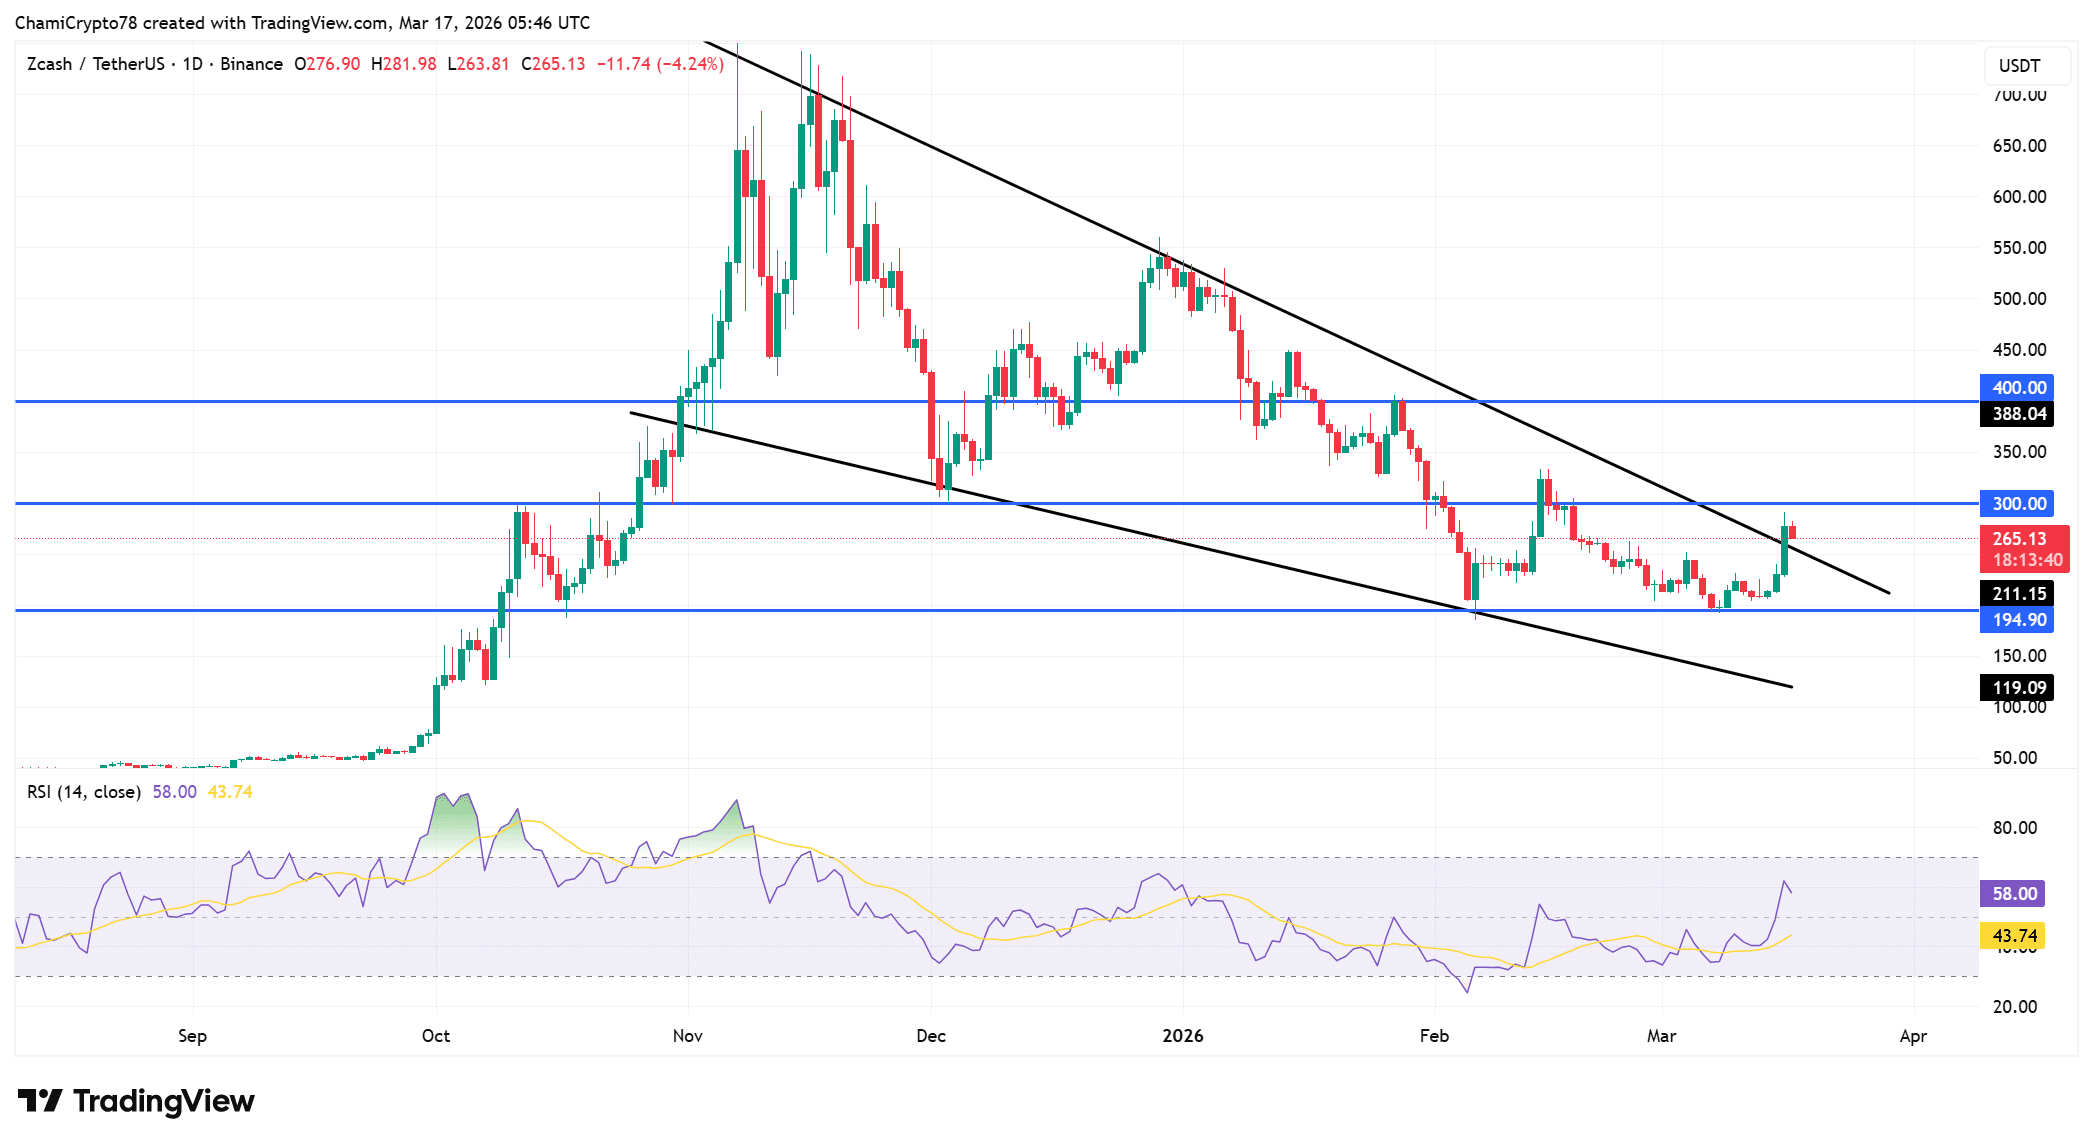
Zcash has broken out of a descending wedge, shifting its short-term structure toward bullish territory.

This breakout follows a sustained compression phase where price respected lower highs within the wedge formation.

After rebounding from $194.90, the price has advanced toward the $300 resistance zone, which now acts as the immediate barrier.

However, the broader trendline from previous highs still looms above, suggesting that upside continuation must overcome layered resistance.

The breakout itself indicates improving market strength, yet the proximity to resistance introduces friction.

As a result, price now tests a critical decision zone where continuation or rejection could define the next directional phase.

RSI has climbed toward 58, reflecting strengthening buyer activity without entering overbought territory.

This positioning suggests that buying pressure has increased steadily rather than accelerating into exhaustion.

Earlier, RSI remained suppressed during the downtrend, which aligned with weakening ZEC price action.

Now, the shift toward neutral-bullish levels highlights improving sentiment among participants.
Source: TradingView

Sell-dominant CVD signals hidden pressure

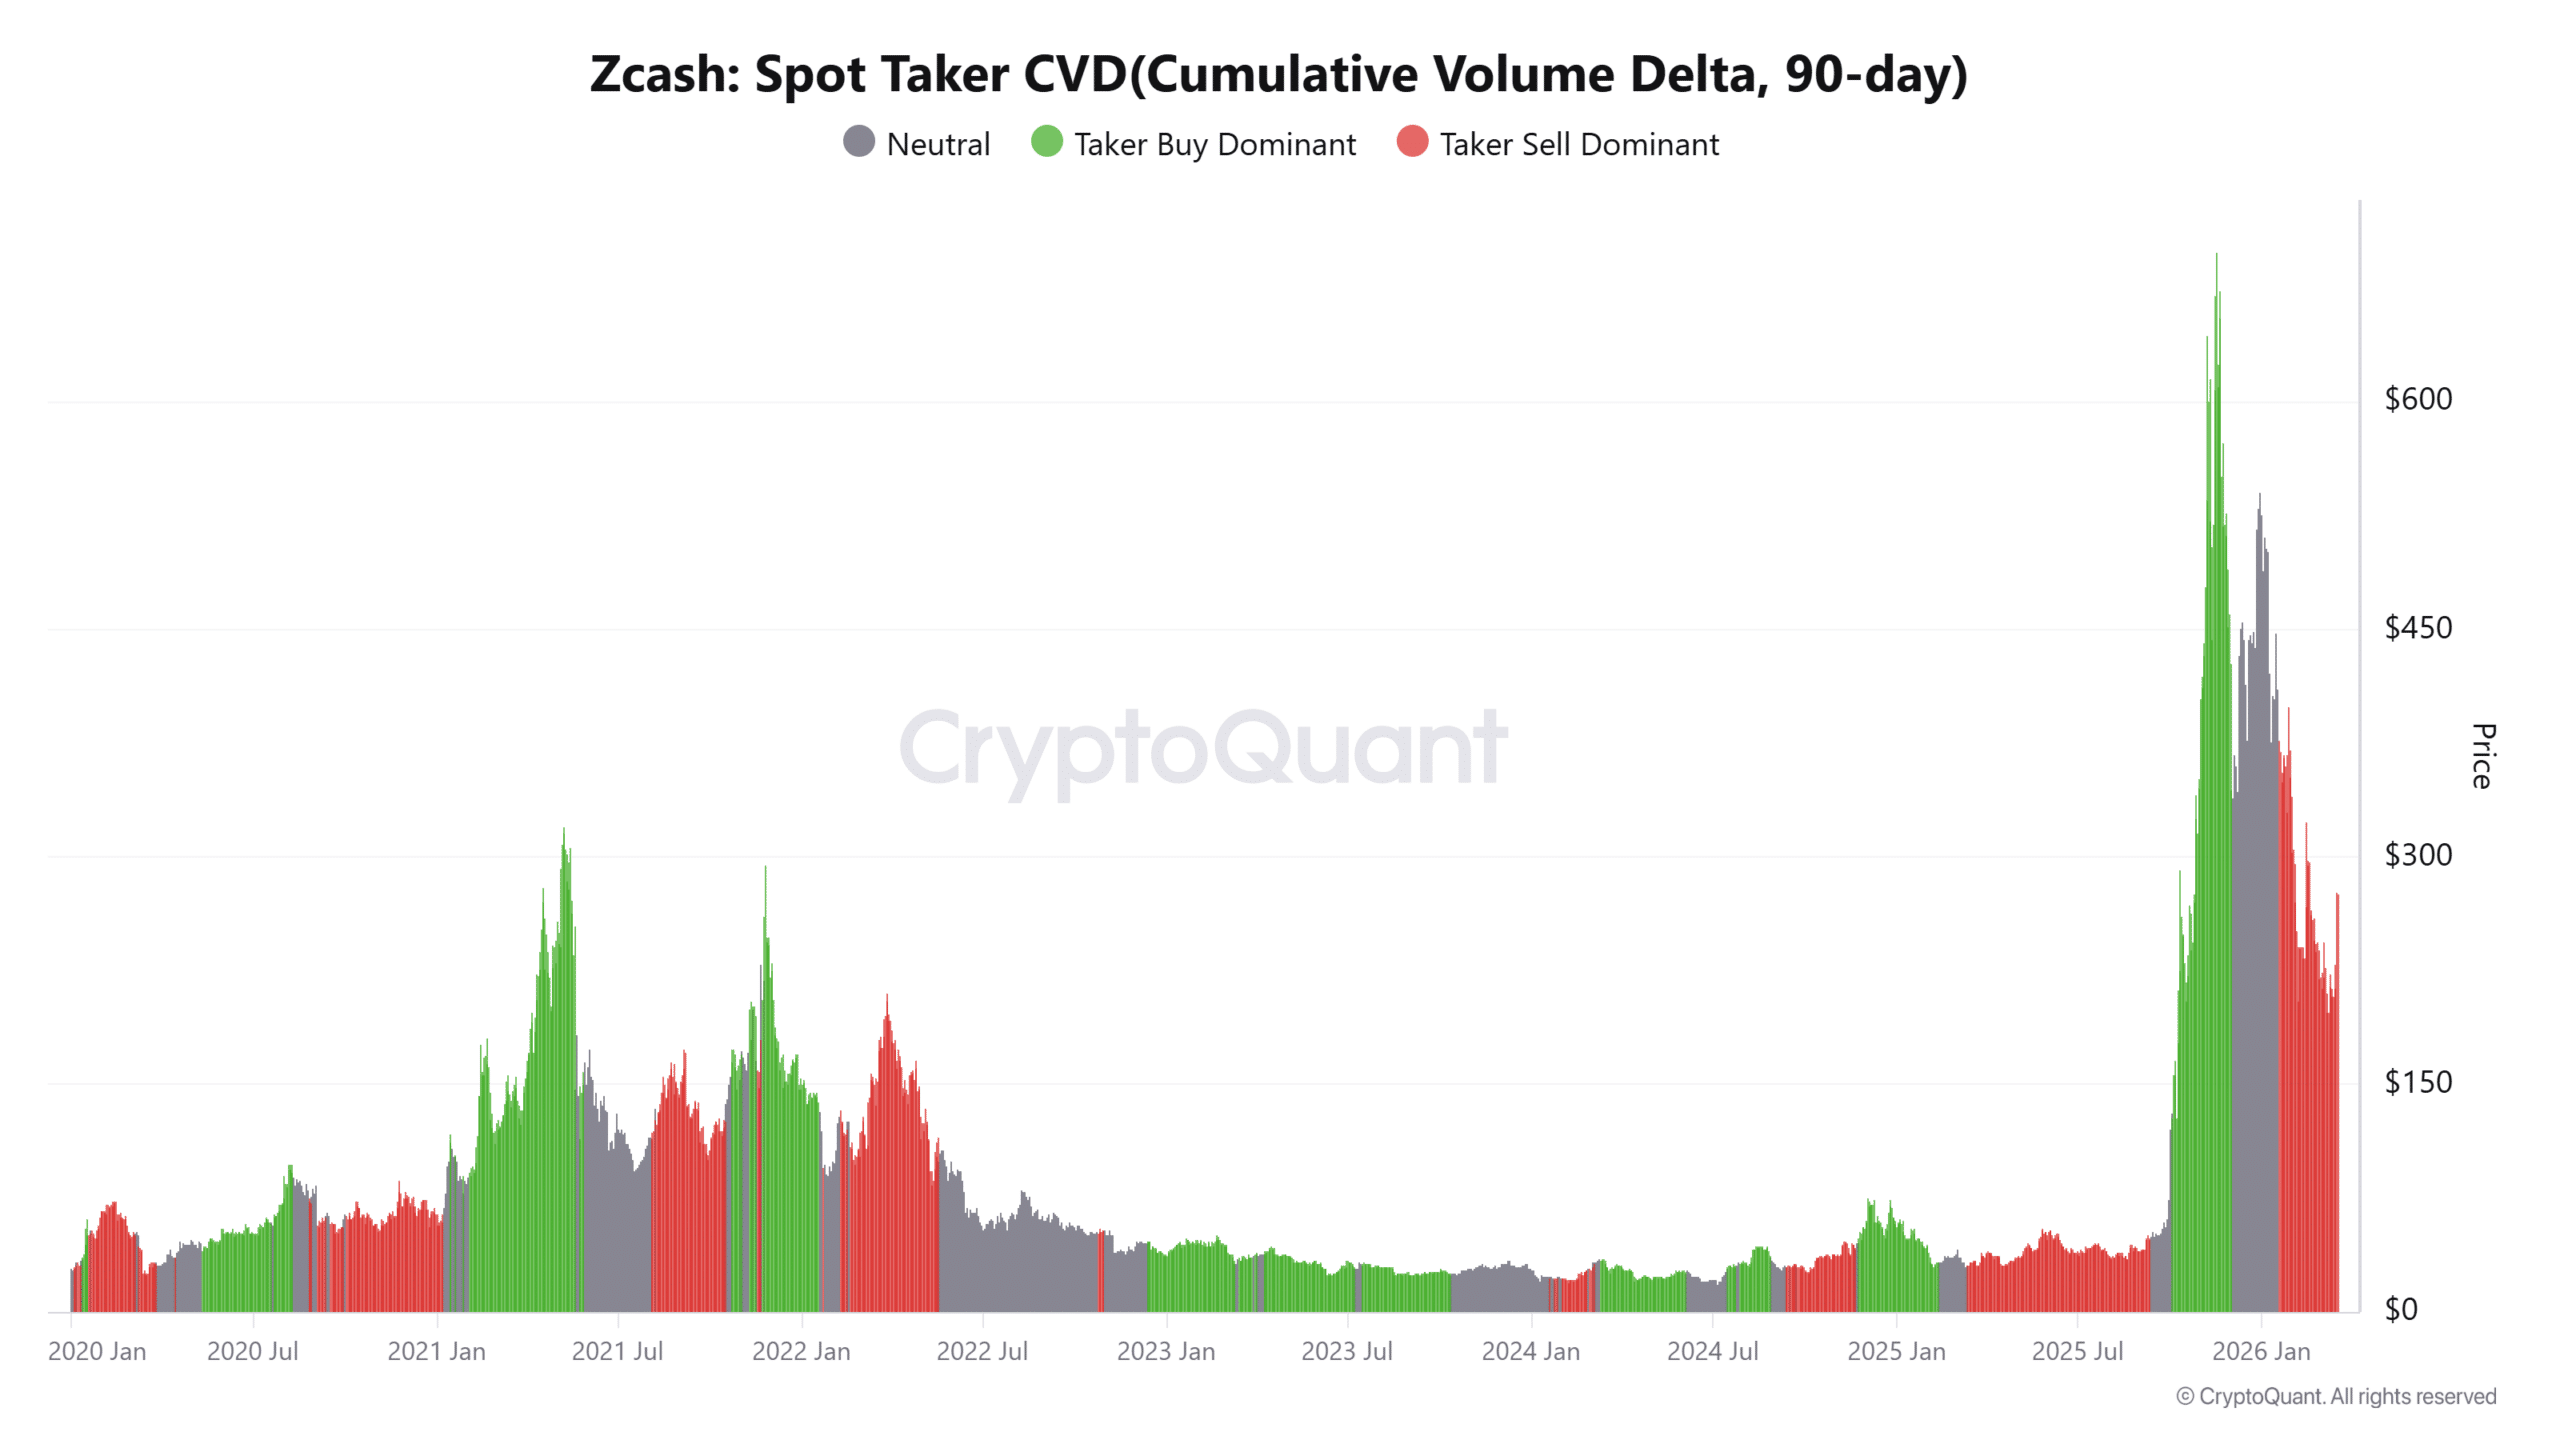
At the time of writing, Spot Taker CVD over the 90-day period remained sell-dominant, indicating that market sell orders have continued to outweigh buy orders despite the recent rally.

This divergence creates an important contrast between visible price strength and underlying order flow dynamics.

While price has moved upward, aggressive sellers have maintained influence in the broader structure.

However, such conditions can also reflect absorption, where buyers gradually take supply without immediate price collapse.

This dynamic suggests that the rally may not rely purely on organic demand.

Instead, it highlights a complex interaction between accumulation and distribution, which introduces uncertainty around the sustainability of the current move.
Negative funding reveals crowded short positioning on Zcash

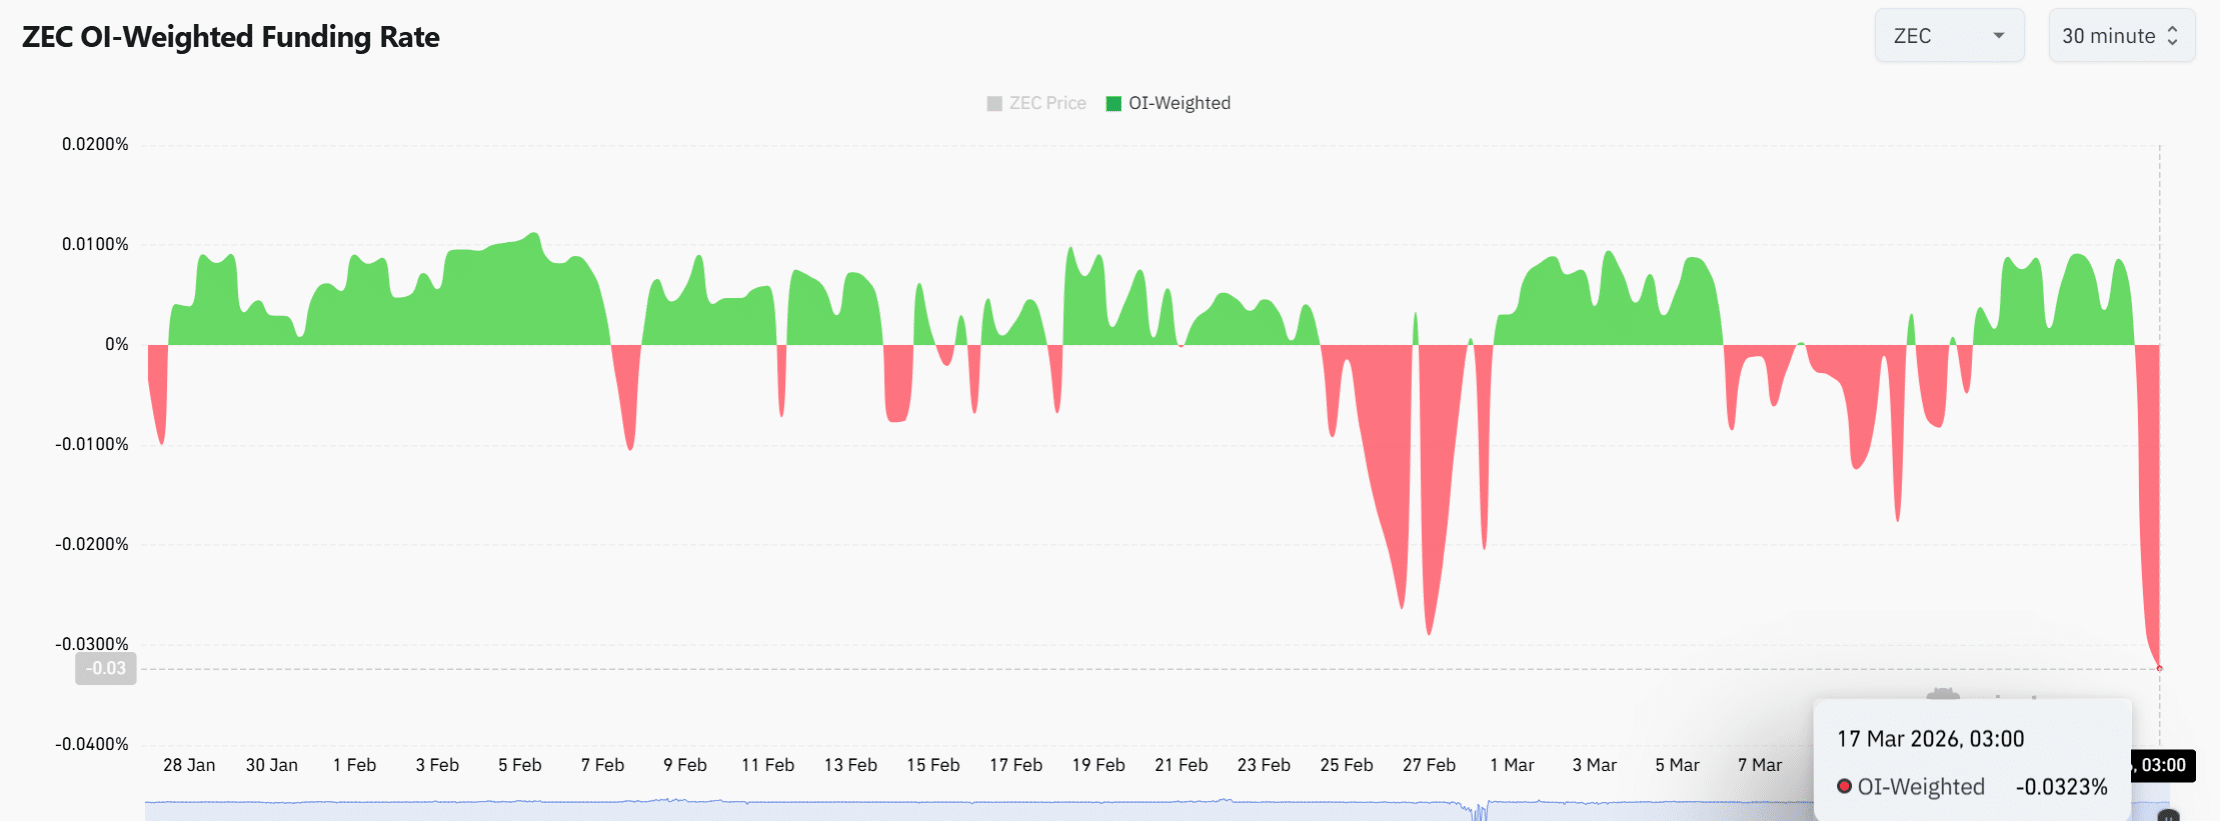
OI-Weighted Funding Rate has dropped to approximately -0.032%, signaling that short positions dominate the Derivatives market.

This shift reflects growing bearish positioning even as price trends upward in the short term. When funding turns deeply negative, it often indicates that traders expect downside continuation.

However, this imbalance can create conditions for sharp upside moves if shorts begin to unwind. As the price approaches the $300 resistance zone, this positioning becomes increasingly relevant.

A continued upward push could force short liquidations, amplifying volatility. Therefore, the derivatives landscape currently supports heightened price sensitivity around key resistance levels.
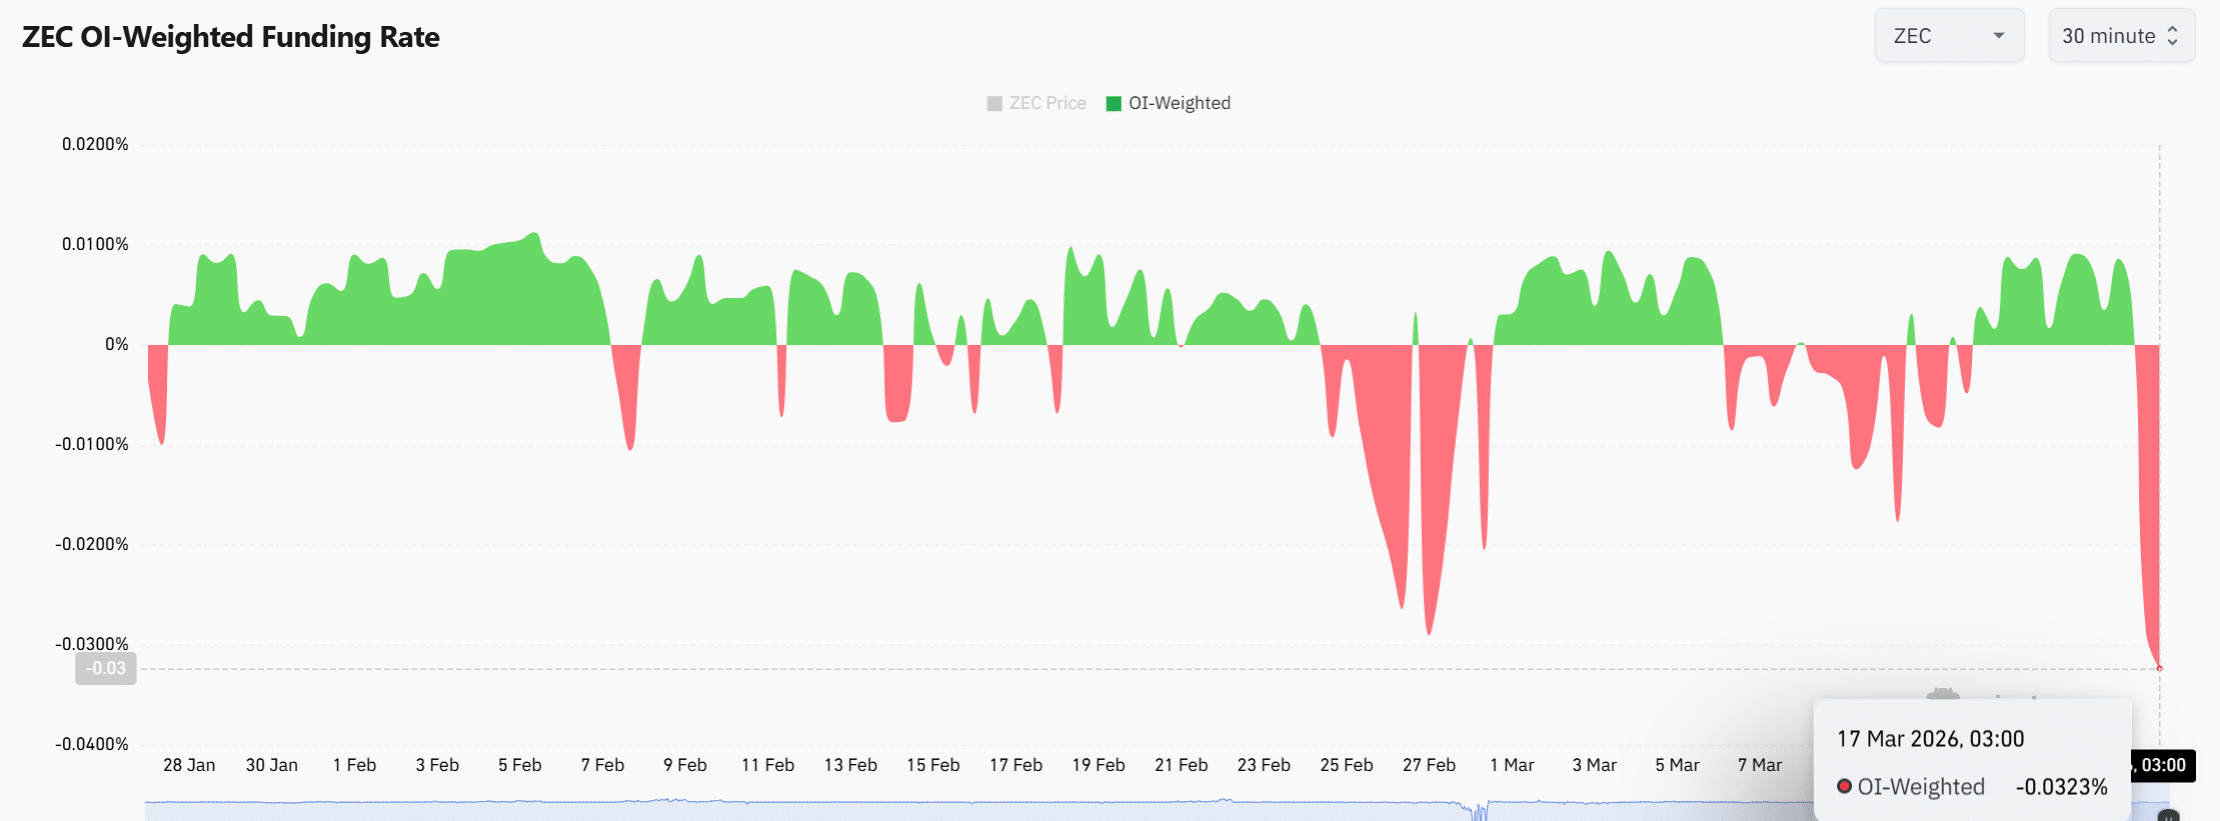
Source: CoinGlass

Zcash’s rally showed clear strength after breaking out of the descending wedge, supported by rising RSI and strong volume expansion.

However, persistent sell pressure in Spot Taker CVD and heavy short positioning introduces conflicting signals beneath the surface.

While short squeezes could extend upside moves, the $300 resistance remains a decisive barrier, meaning the rally would likely continue with volatility rather than a smooth trend.


Final Summary

  • Zcash showed an improving structure, but resistance pressure could still challenge continuation despite current breakout strength holding firm.
  • Short positioning imbalance may drive volatility higher, potentially extending gains while increasing risk of sharp reversals near resistance.


Trending Cryptos

Related Questions

QWhat was the percentage surge in Zcash's price and the increase in trading volume mentioned in the article?

AZcash surged over 20% in 24 hours, and its trading volume rose over 76%.

QFrom which key support level did ZEC price rebound, and what is the immediate resistance it is approaching?

AZEC rebounded from the $194.90 support level and is now approaching the $300 resistance zone.

QWhat does the negative OI-Weighted Funding Rate of approximately -0.032% indicate about market positioning?

AIt indicates that short positions dominate the derivatives market, reflecting growing bearish positioning among traders.

QWhat technical pattern did Zcash break out of, and what does this breakout signal?

AZcash broke out of a descending wedge pattern, which signals a shift in short-term structure toward bullish territory.

QAccording to the article, what two underlying metrics present mixed signals despite the price rally?

AThe Spot Taker CVD, which remains sell-dominant, and the negative funding rate, which indicates heavy short positioning, present mixed signals.

Related Reads

Wall Street Morning News: V-shaped Rebound at Month-end, but Nasdaq Suffers Worst July in 12 Years; Funds Accelerate Concentration Towards Cloud Giants

Despite a V-shaped rebound at the end of July, the Nasdaq posted its worst July since 2004, while the S&P 500 had its worst July since 2014. Markets were jolted by geopolitical shifts, as President Trump canceled a planned strike on Iran, leading WTI crude to plunge over 8%. This, alongside OPEC+ announcing a supply increase, reversed crude's sharp July gains. Treasury yields surged, with the 10-year yield rising over 30 basis points in July—its largest July increase since 2005. In a rare move, the US and Japan jointly intervened to weaken the USD/JPY, aiming to prevent potential Japanese sales of US Treasuries. While the tech sector faced deleveraging pressure throughout July, cloud giants staged a massive rally on strong earnings. Microsoft, Amazon, and Google collectively added nearly $1.5 trillion in market value last week. Amazon soared over 15% on accelerating AWS growth, Microsoft extended historic gains, Google fully recovered post-earnings losses, and Meta ended an 11-day losing streak. In contrast, Apple tumbled over 7% on supply chain and guidance concerns, ceding its "world's most valuable company" title to Nvidia. The memory and storage sector corrected sharply. Gold edged up 0.91% in July, with analysts viewing the ~30% pullback from January highs as a potential basing period, supported by long-term central bank demand. Key events to watch this week include earnings from Palantir, AMD, SpaceX (its first post-IPO report), and memory giants like Western Digital. The US July non-farm payrolls report on Friday will be critical for gauging the Fed's policy path. SpaceX also faces a significant lock-up expiration, testing market liquidity.

marsbit49m ago

Wall Street Morning News: V-shaped Rebound at Month-end, but Nasdaq Suffers Worst July in 12 Years; Funds Accelerate Concentration Towards Cloud Giants

marsbit49m ago

Rubin Ultra Makes Major Cuts, Even Nvidia Can't Handle Memory Price Hikes?

NVIDIA's Rubin Ultra, the top-tier variant of the newly announced Rubin AI accelerators, has reportedly seen significant specification downgrades, according to an industry report from SemiAnalysis. Initially designed with four compute dies (4-die), the Rubin Ultra is now said to be reduced to a 2-die design. Key changes highlighted in the report include: * **No increase in peak theoretical compute performance**, remaining at 35 PFLOPs like the standard Rubin. * **Severe reduction in memory capacity** to 192GB using 8-Hi HBM stacks, which is less than the standard Rubin's 288GB using 12-Hi stacks. * **Negligible memory bandwidth improvement** of only 1 TB/s. * **Slightly higher chip-level power consumption**. * The **primary upgrade is a massive increase in scale-up interconnect capacity**, supporting connections for up to 576 GPUs via NVLink, compared to 72 for the standard Rubin. The report suggests the redesign is primarily a cost-optimization move driven by the sharp rise in HBM (High-Bandwidth Memory) prices. By reducing the expensive HBM content and shifting investment towards enhanced system-scale networking, NVIDIA aims to maintain the platform's value for large-scale AI training clusters while managing soaring material costs. The news reportedly triggered a sell-off in South Korean memory stocks, with SK Hynix and Samsung shares falling around 8%, as markets grew concerned that NVIDIA—a major HBM buyer—might be reducing its reliance on high-capacity memory, potentially capping future pricing power for memory makers.

Odaily星球日报1h ago

Rubin Ultra Makes Major Cuts, Even Nvidia Can't Handle Memory Price Hikes?

Odaily星球日报1h ago

Trading

Spot

Hot Articles

How to Buy ZEC

Welcome to HTX.com! We've made purchasing Zcash (ZEC) simple and convenient. Follow our step-by-step guide to embark on your crypto journey.Step 1: Create Your HTX AccountUse your email or phone number to sign up for a free account on HTX. Experience a hassle-free registration journey and unlock all features.Get My AccountStep 2: Go to Buy Crypto and Choose Your Payment MethodCredit/Debit Card: Use your Visa or Mastercard to buy Zcash (ZEC) instantly.Balance: Use funds from your HTX account balance to trade seamlessly.Third Parties: We've added popular payment methods such as Google Pay and Apple Pay to enhance convenience.P2P: Trade directly with other users on HTX.Over-the-Counter (OTC): We offer tailor-made services and competitive exchange rates for traders.Step 3: Store Your Zcash (ZEC)After purchasing your Zcash (ZEC), store it in your HTX account. Alternatively, you can send it elsewhere via blockchain transfer or use it to trade other cryptocurrencies.Step 4: Trade Zcash (ZEC)Easily trade Zcash (ZEC) on HTX's spot market. Simply access your account, select your trading pair, execute your trades, and monitor in real-time. We offer a user-friendly experience for both beginners and seasoned traders.

4.0k Total ViewsPublished 2024.03.29Updated 2026.06.02

How to Buy ZEC

Discussions

Welcome to the HTX Community. Here, you can stay informed about the latest platform developments and gain access to professional market insights. Users' opinions on the price of ZEC (ZEC) are presented below.

活动图片