XRP Bull-Bear Showdown Imminent: Downtrend Shows Cracks—Is This a Last Stand or the Final Drop?

金色财经Published on 2025-12-11Last updated on 2025-12-11

Abstract

XRP remains constrained by a long-term bearish trend, but recent price movements suggest that selling pressure may be weakening. While the overall market structure is still defined by a steep descending red trendline, internal momentum is shifting. Bullish rallies are becoming stronger and more decisive, while bearish declines are losing intensity and duration—a sign that buyers are accumulating at lower levels. Key resistance lies near $2.48; a decisive break above this level could trigger a strong upward move as accumulated bullish energy is released. Important support is found in the $1.88–$1.95 zone, aligned with Fibonacci retracement levels. Failure to break above resistance, however, could lead to further downside toward the $1.40 region. In summary, XRP is at a critical juncture: either it breaks out into a new uptrend or remains trapped within the larger bearish structure. The outcome depends on whether it can sustainably overcome key resistance and convert it into support.

Article Source: WeChat Official Account Mama Encryption Talk

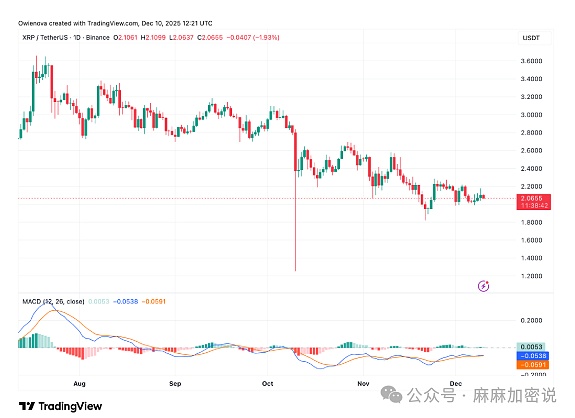
XRP remains constrained by a long-term downtrend, but recent price movements suggest that bears may be losing control. The upward moves are becoming stronger and more forceful, while the downward momentum is slowing, indicating that buyers are quietly entering the market. Once key resistance levels are breached, bulls may be preparing to launch a powerful counterattack.

Overall Bearish Structure: The Upper Limit of the Red Trendline

According to the latest XRP chart from MakroVision Research, the overall market structure remains in a downtrend, with the steep descending red trendline clearly outlining this trend. These trendlines continue to hinder every rebound attempt, keeping the overall technical picture unchanged and biased toward bearish.

Although the internal market structure has begun to show clear signs of improvement, short-term price movements indicate that upward moves are becoming more rapid, forceful, and distinct. Meanwhile, the momentum during downward phases is gradually weakening, with longer durations and reduced kinetic energy.

This shift is typical of waning selling pressure and increased buyer activity at lower levels. The market may still be below key resistance levels, but its internal dynamics are no longer as weak as before.

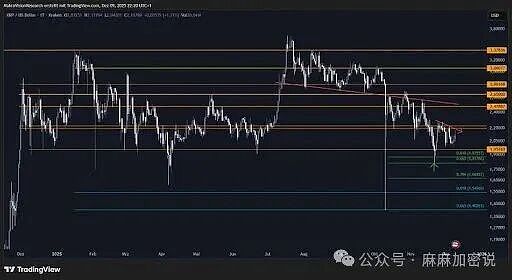
If XRP can decisively break through the red trendline near $2.48, it will unleash the upward potential that has been quietly accumulating. If it fails to break through, the token will technically remain under pressure, but the foundation for a potential reversal is clearly forming.

Key price levels to watch include the resistance zone at $2.20 to $2.22, the major breakout level at $2.48, and the support area around $1.95 to $1.88, which aligns with Fibonacci retracement levels and recent reaction points.

Dual-Track Conflict: Bearish Trend vs. Bullish Internal Structure

In summary, MakroVision Research points out that XRP is currently experiencing a dual-track movement. While the technical picture shows that the broader trend remains downward, its internal price structure is increasingly exhibiting bullish characteristics. This weakening of downward momentum makes the current chart dynamics exciting.

XRP's current fate hinges entirely on its ability to sustainably break through the aforementioned key resistance levels, particularly the $2.48 trendline. Analysts warn that if XRP successfully converts this major resistance level into support, the accumulated upward momentum could be rapidly unleashed, leading to a sharp price surge.

For now, the key question remains whether XRP can achieve a lasting trend reversal and leverage its internal strengths, or whether the overall bearish pressure will ultimately prevail, forcing prices lower toward the significant $1.4 low.

Related Questions

QWhat is the main resistance level that XRP needs to break for a potential trend reversal according to the article?

AThe main resistance level that XRP needs to break is $2.48, which is the key trendline.

QWhat does the article suggest about the internal market structure of XRP despite the overall bearish trend?

AThe article suggests that the internal price structure is becoming increasingly bullish, with stronger rallies and weakening sell-offs, indicating that buyers are becoming more active.

QWhich price zone is mentioned as a support area for XRP in the analysis?

AThe support area mentioned is around $1.95 to $1.88, which aligns with Fibonacci retracement levels and recent reaction points.

QWhat could happen if XRP fails to break the key resistance at $2.48?

AIf XRP fails to break the $2.48 resistance, it will remain technically pressured, and the overall bearish pressure might push the price down further towards the $1.4 low.

QWhat is the 'dual-track conflict' described in the article regarding XRP's price action?

AThe 'dual-track conflict' refers to the situation where the overall market structure is still bearish (controlled by the descending red trendline), but the internal price structure is showing signs of strengthening bullish momentum.

Related Reads

Spain Held to a Draw by Cape Verde, Jucom Prediction Market Witnesses Historic Upset

In a major upset at the 2026 FIFA World Cup, tournament favorites Spain were held to a surprising 0-0 draw by debutants Cape Verde in their Group H opener on June 16, Beijing time. Despite dominating possession (74%) and recording 27 shots with an expected goals figure of 2.16, Spain failed to break down a resilient Cape Verde defense, with their 40-year-old goalkeeper Vozinha making 7 saves to earn Man of the Match. Pre-match predictions on the Jucom prediction market had heavily favored Spain, assigning them a 92% win probability. The actual result, a goalless draw, triggered significant volatility across related prediction markets. This outcome forces a market-wide reassessment of several key probabilities, including Spain's likelihood of winning the group and the tournament itself, while Cape Verde's previously near-zero chance of advancing is now being re-evaluated. The event highlights both the efficiency and the inherent limitations of prediction markets. While prices aggregate known information, football's low-scoring, high-variance nature means unquantifiable in-game factors can lead to unlikely results. The core value of such markets lies not in perfect foresight but in their ability to dynamically reflect how new information is incorporated into collective expectations. Platforms like Jucom, which track outcomes from single matches to the final champion, provide a real-time lens into how global consensus evolves with each game.

链捕手4m ago

Spain Held to a Draw by Cape Verde, Jucom Prediction Market Witnesses Historic Upset

链捕手4m ago

Standard Chartered Bank Places a 40x 'Bet', Calls for UNI to Rise to $100

Standard Chartered Bank’s digital asset research head, Geoff Kendrick, initiated coverage on Uniswap with a highly bullish long-term price target of $100 for its UNI token by 2030—a roughly 40-fold increase from its ~$2.60 trading price at the time of the report. The bank’s thesis hinges on the exponential growth of tokenized real-world assets (RWA), projected to surge from ~$340 billion to $4 trillion by 2028. It expects the share of these assets deployed in DeFi to rise from 3.5% to 30%, driving total DeFi TVL to around $2.7 trillion. As the leading decentralized exchange (DEX), Uniswap is positioned to capture a significant portion of this liquidity influx. A key catalyst is Uniswap’s “fee switch,” activated in late 2024, which directs a portion of protocol fees to UNI token buybacks and burns. This transforms UNI from a pure governance token into a yield-generating, deflationary asset, narrowing its valuation gap with centralized exchanges like Coinbase. The report draws an analogy: Coinbase operates like Netflix (centralized, high-cost), while Uniswap functions like YouTube (open, user-generated, network-effect driven). Despite its dominant market share and recent institutional adoption—such as BlackRock’s BUIDL fund and Fidelity’s stablecoin using Uniswap for liquidity—the path faces challenges. Competition from Solana-based DEXs and aggregators threatens user mindshare, while regulatory delays or setbacks in RWA adoption could slow the projected growth. Furthermore, UNI remains down over 92% from its 2021 peak, reflecting persistent market skepticism. Ultimately, Standard Chartered’s report signals a shift in traditional finance’s perception of DeFi, valuing network effects and cash flow potential. However, realizing the $100 target depends on Uniswap successfully navigating intense competition, regulatory hurdles, and the multi-year timeline for massive tokenized asset adoption.

marsbit29m ago

Standard Chartered Bank Places a 40x 'Bet', Calls for UNI to Rise to $100

marsbit29m ago

For Those Still Obsessed with Altcoins, Just Go All-in on HOOD

Title: "For Those Still Fixated on Altcoins, Just Bet on HOOD" The article argues that Robinhood (HOOD) stock is a compelling alternative for investors still holding onto hopes for altcoin rallies. It highlights HOOD's recent strong performance, briefly touching $100, and expresses continued optimism. The bullish thesis is multi-faceted: HOOD's operational data for May showed record highs in key metrics like total assets and funded customers, though crypto volume was weaker. Positive catalysts include Robinhood launching its own prediction market (Rothera) to capture more revenue, gaining approval to act as an IPO underwriter for major upcoming listings, and being selected to manage the new "Trump Account" government savings program for millions of future US newborns. Insider and institutional buying, along with raised price targets, provide further confidence. The core argument is that HOOD is successfully decoupling from the crypto market's fortunes. While crypto-related revenue was once a major contributor, its share of total revenue has been declining, hitting 13% in Q1 2026. Although HOOD's price historically moved with Bitcoin, a recent divergence is noted. The author posits that Robinhood's growing equity trading, prediction markets, and IPO-related businesses can drive growth independently of a crypto bull market. Thus, HOOD offers asymmetric exposure: it stands to benefit if the crypto market recovers but is no longer wholly dependent on it. For those disillusioned with altcoins' risks, HOOD presents a potentially safer way to maintain exposure to the fintech and speculative trading space.

marsbit37m ago

For Those Still Obsessed with Altcoins, Just Go All-in on HOOD

marsbit37m ago

Trading

Spot
Futures

Hot Articles

How to Buy USOIL

Welcome to HTX.com! We've made purchasing WTI Crude USOil/ CL (USOIL) simple and convenient. Follow our step-by-step guide to embark on your crypto journey.Step 1: Create Your HTX AccountUse your email or phone number to sign up for a free account on HTX. Experience a hassle-free registration journey and unlock all features.Get My AccountStep 2: Go to Buy Crypto and Choose Your Payment MethodCredit/Debit Card: Use your Visa or Mastercard to buy WTI Crude USOil/ CL (USOIL) instantly.Balance: Use funds from your HTX account balance to trade seamlessly.Third Parties: We've added popular payment methods such as Google Pay and Apple Pay to enhance convenience.P2P: Trade directly with other users on HTX.Over-the-Counter (OTC): We offer tailor-made services and competitive exchange rates for traders.Step 3: Store Your WTI Crude USOil/ CL (USOIL)After purchasing your WTI Crude USOil/ CL (USOIL), store it in your HTX account. Alternatively, you can send it elsewhere via blockchain transfer or use it to trade other cryptocurrencies.Step 4: Trade WTI Crude USOil/ CL (USOIL)Easily trade WTI Crude USOil/ CL (USOIL) on HTX's spot market. Simply access your account, select your trading pair, execute your trades, and monitor in real-time. We offer a user-friendly experience for both beginners and seasoned traders.

632 Total ViewsPublished 2026.05.25Updated 2026.05.25

How to Buy USOIL

HTX Learn: Learn USDD to Share 1000 USDT​

To enhance your understanding of USDD, we are rolling out various rewarding events. Join them now and bring home generous rewards through learning and trading.

27.7k Total ViewsPublished 2026.05.25Updated 2026.05.25

HTX Learn: Learn USDD to Share 1000 USDT​

Discussions

Welcome to the HTX Community. Here, you can stay informed about the latest platform developments and gain access to professional market insights. Users' opinions on the price of A (A) are presented below.

活动图片