Worldcoin’s breakdown may be the start of a bigger fall – Here’s why

ambcryptoPublished on 2026-06-26Last updated on 2026-06-26

Abstract

Worldcoin (WLD) fell 10.27% to near $0.4635, with trading volume dropping 14.05%. The simultaneous decline in price and volume signaled weakening buyer participation, leaving sellers in control of the short-term direction. WLD broke below both its ascending channel structure and the psychological $0.50 level after failing to sustain an earlier advance toward $0.67 resistance. On-chain data showed Spot Taker CVD remained seller-dominant, indicating market sell orders continued to outweigh aggressive buying. Despite a drop in overall trading activity, the Spot Volume Bubble Map signaled overheating, suggesting elevated speculative activity and a continued risk of sharp price swings. Technically, the breakdown from the ascending channel was confirmed by a bearish MACD crossover, with the histogram expanding into negative territory. This shifted the outlook, with WLD now approaching the major $0.40 support level. A successful defense of $0.40 could lead to a rebound toward $0.50. However, a break below this support would expose the next major downside target near $0.23, as persistent selling pressure and a lack of buyer confidence leave the token vulnerable to further declines.

Worldcoin [WLD] declined by 10.27% over the past 24 hours to trade near $0.4635, while trading volume dropped 14.05% to $386.7 million.

The simultaneous decline in price and volume suggested market participation had weakened as buyers stepped back. However, sellers continued to control short-term direction instead of easing their grip.

The broader decline also left WLD below the psychological $0.50 level after failing to sustain its earlier advance.

As a result, buyers struggled to regain confidence, leaving Worldcoin vulnerable to additional downside pressure if demand failed to improve over the coming sessions.

Sellers retained control despite lighter Spot activity

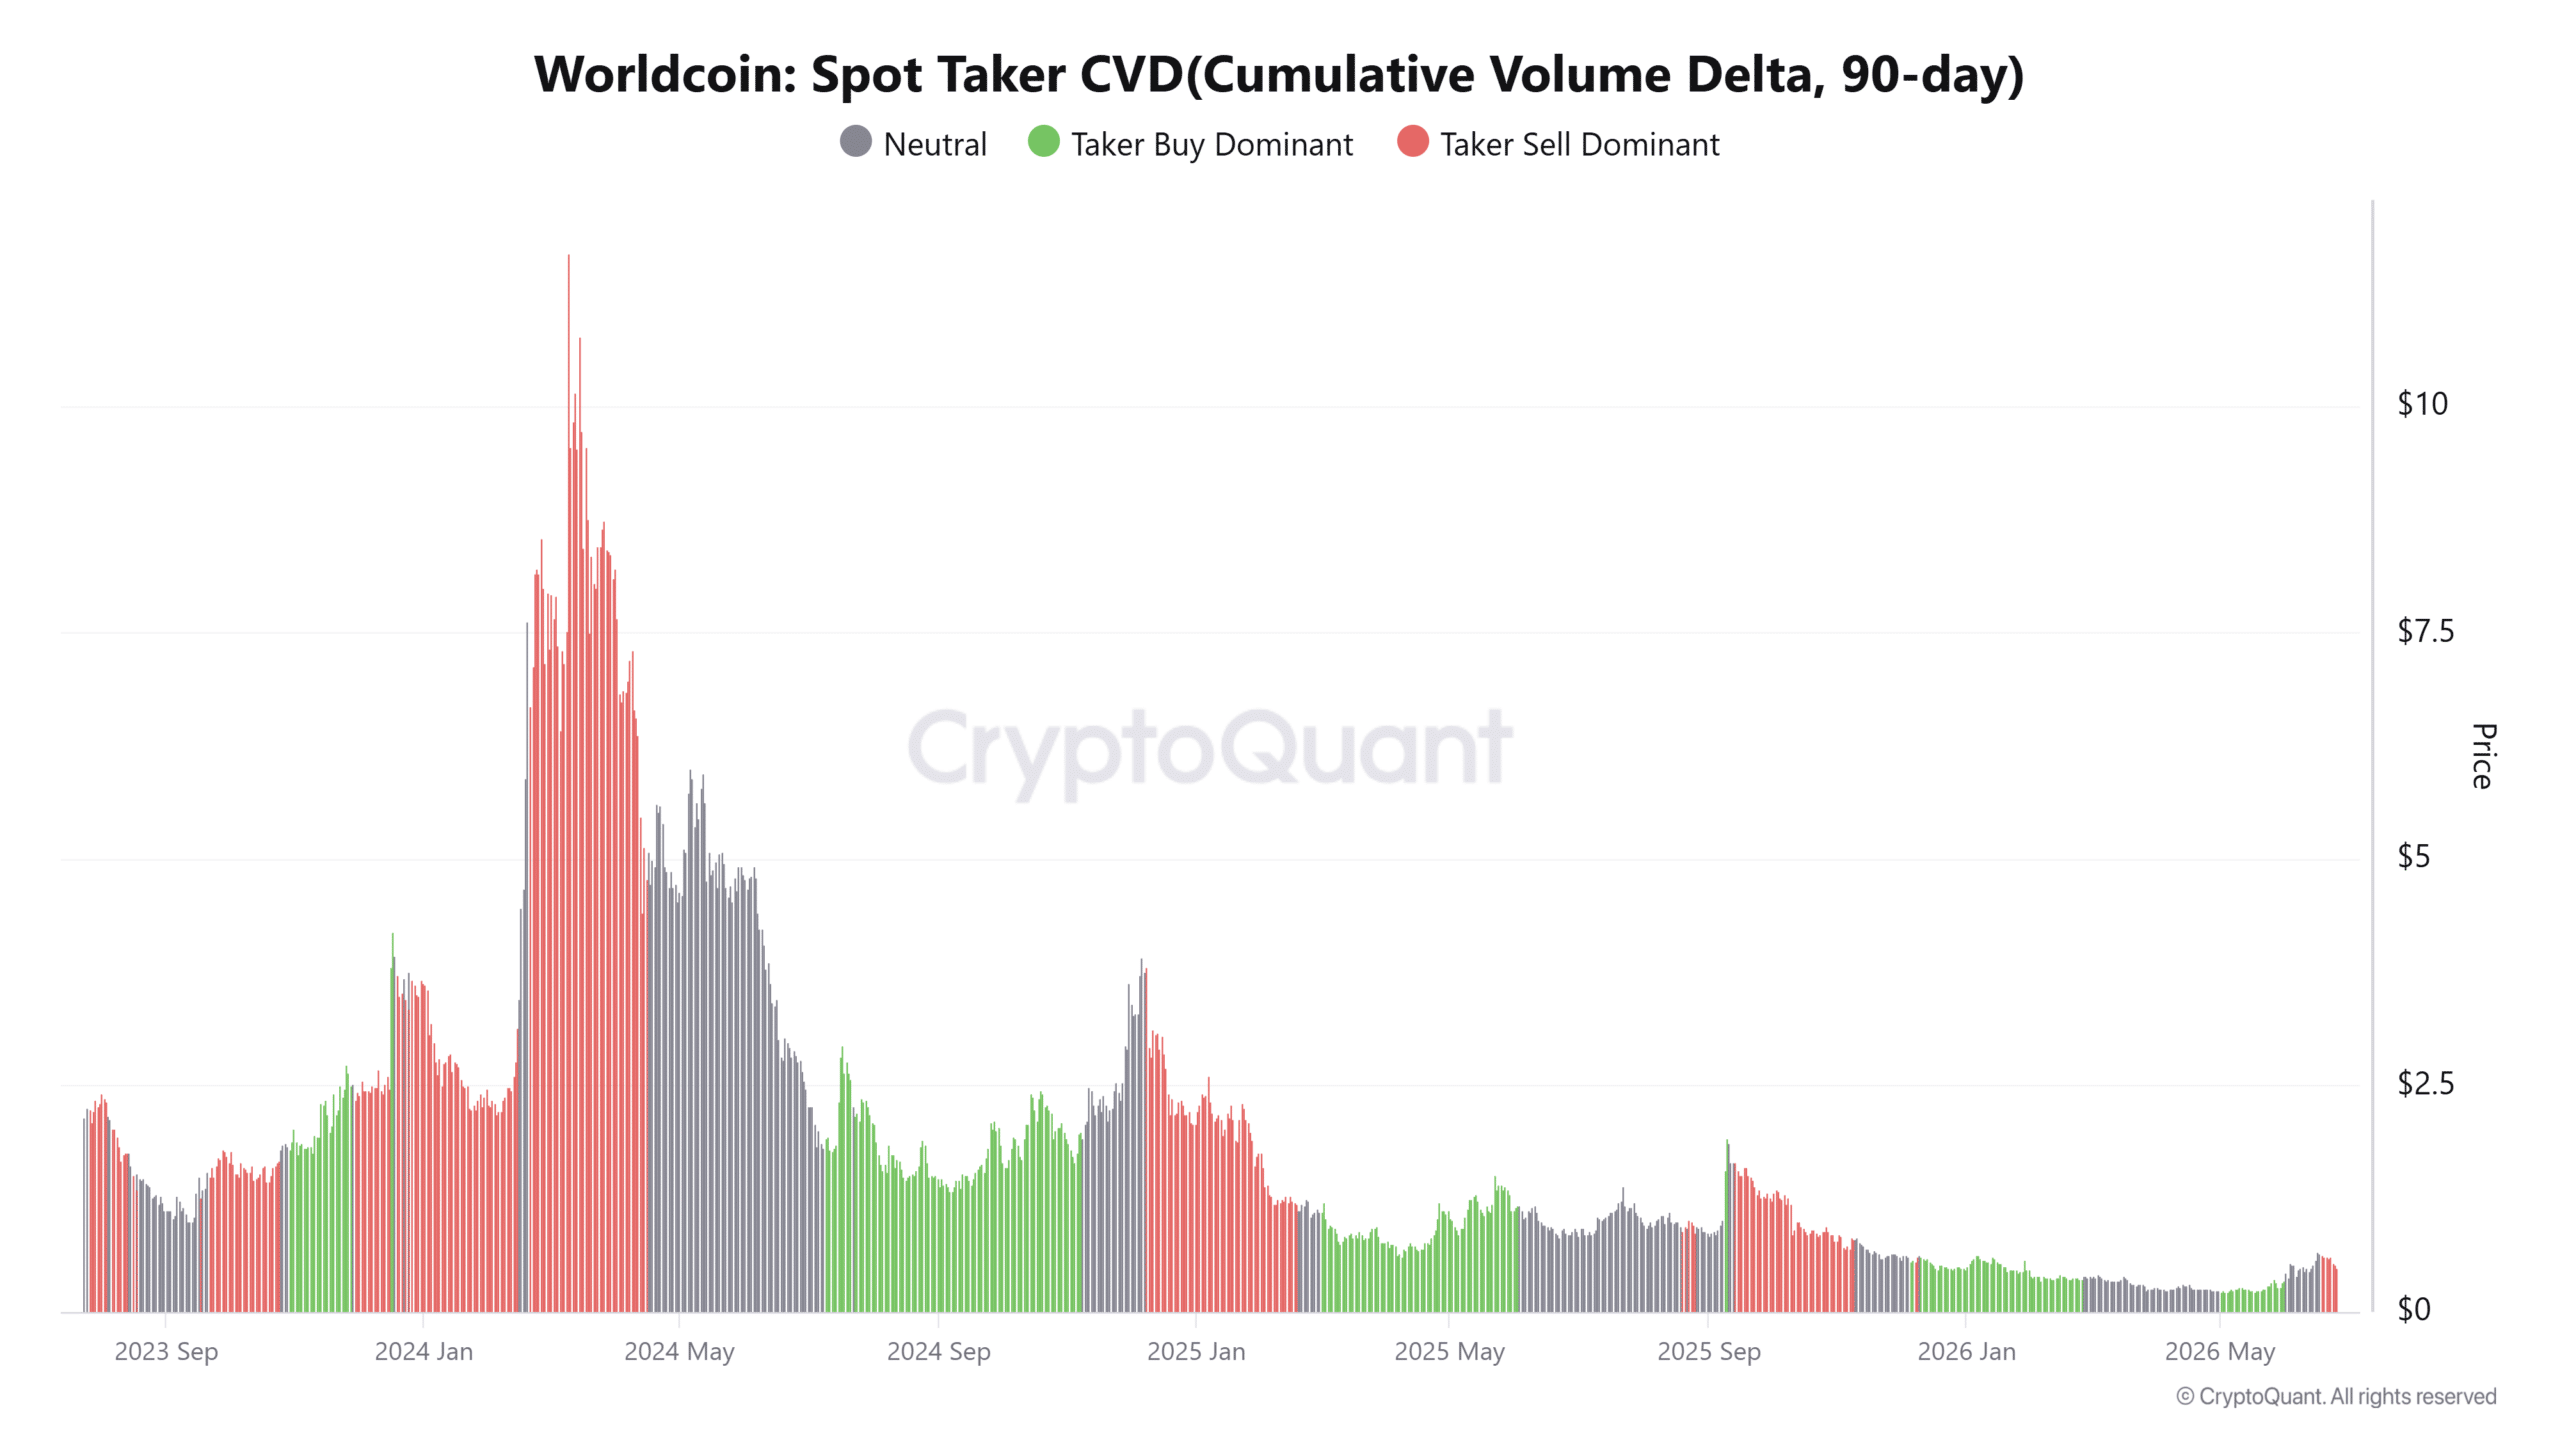
Spot Taker CVD remained seller dominant, indicating market sell orders continued to outweigh aggressive buying activity. This reading suggests traders consistently accepted lower prices instead of chasing higher bids.

Even though overall trading activity slowed, the imbalance between buyers and sellers continued favoring the bearish side. Such conditions often reflected limited willingness among market participants to absorb the available supply.

Until Spot Taker CVD shifts toward buyer dominance, sellers appear likely to dictate short-term price direction.
Source: CryptoQuant

Overheated volume kept volatility risks elevated

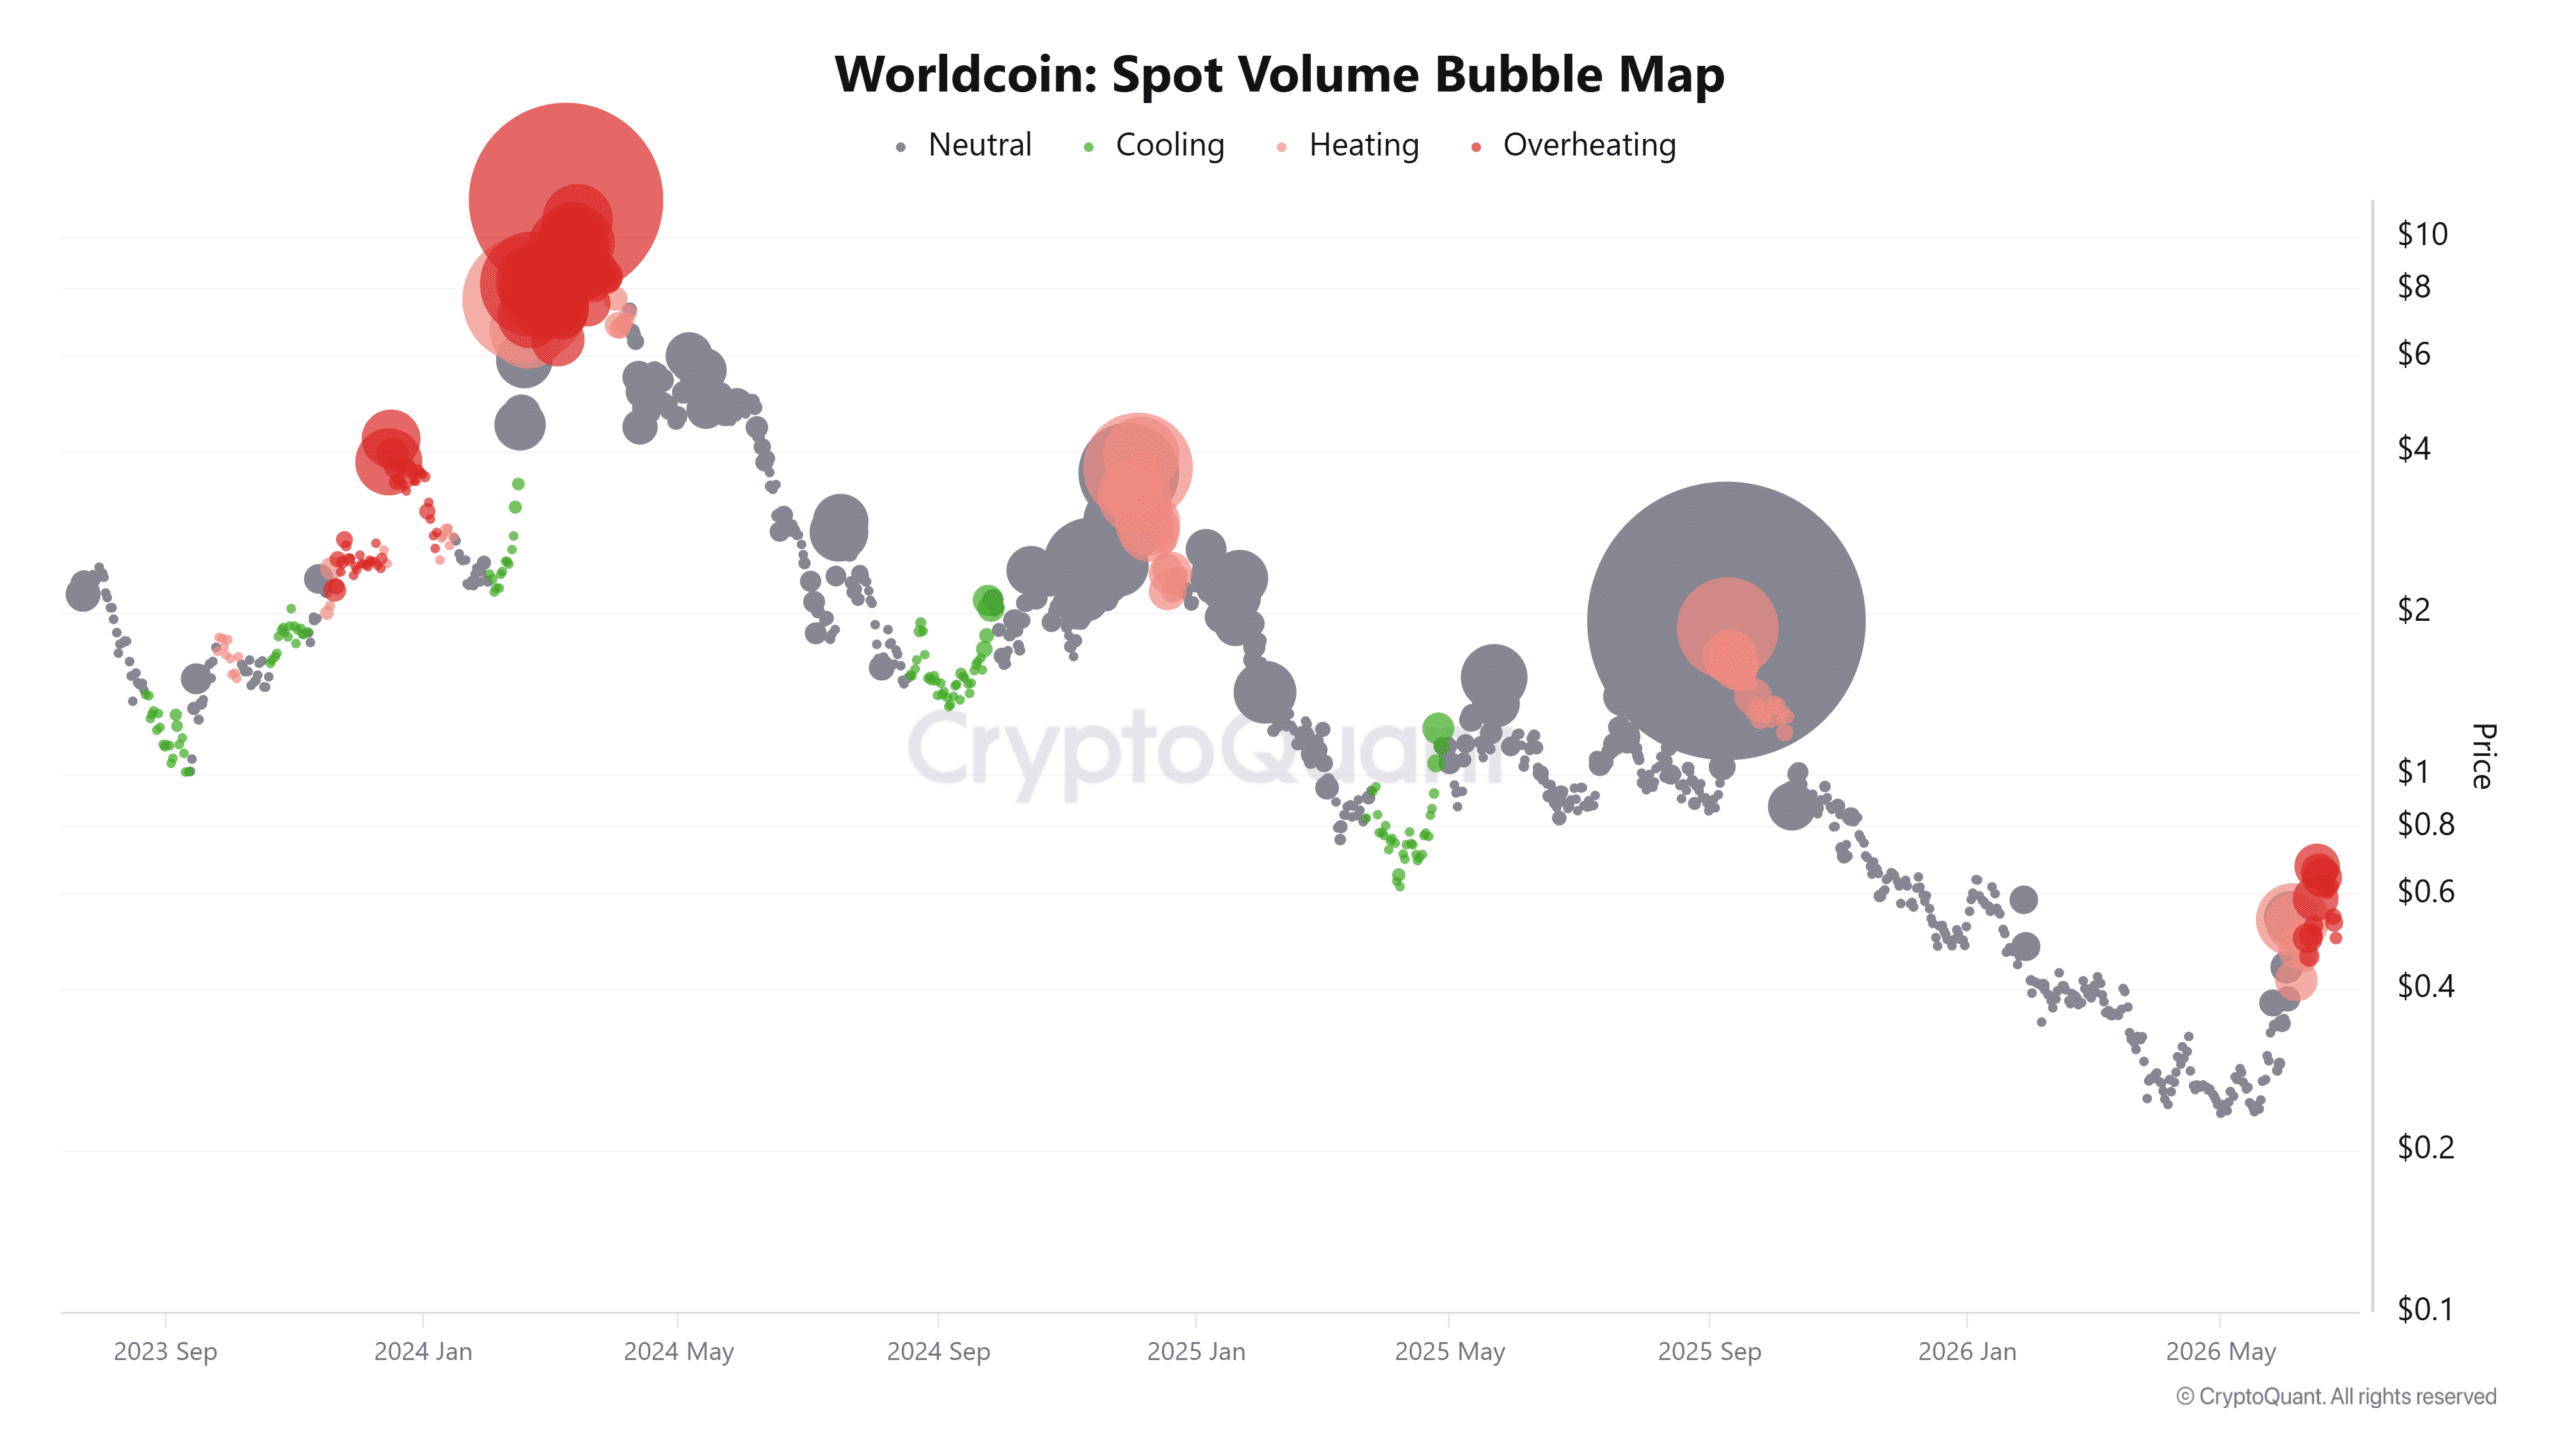
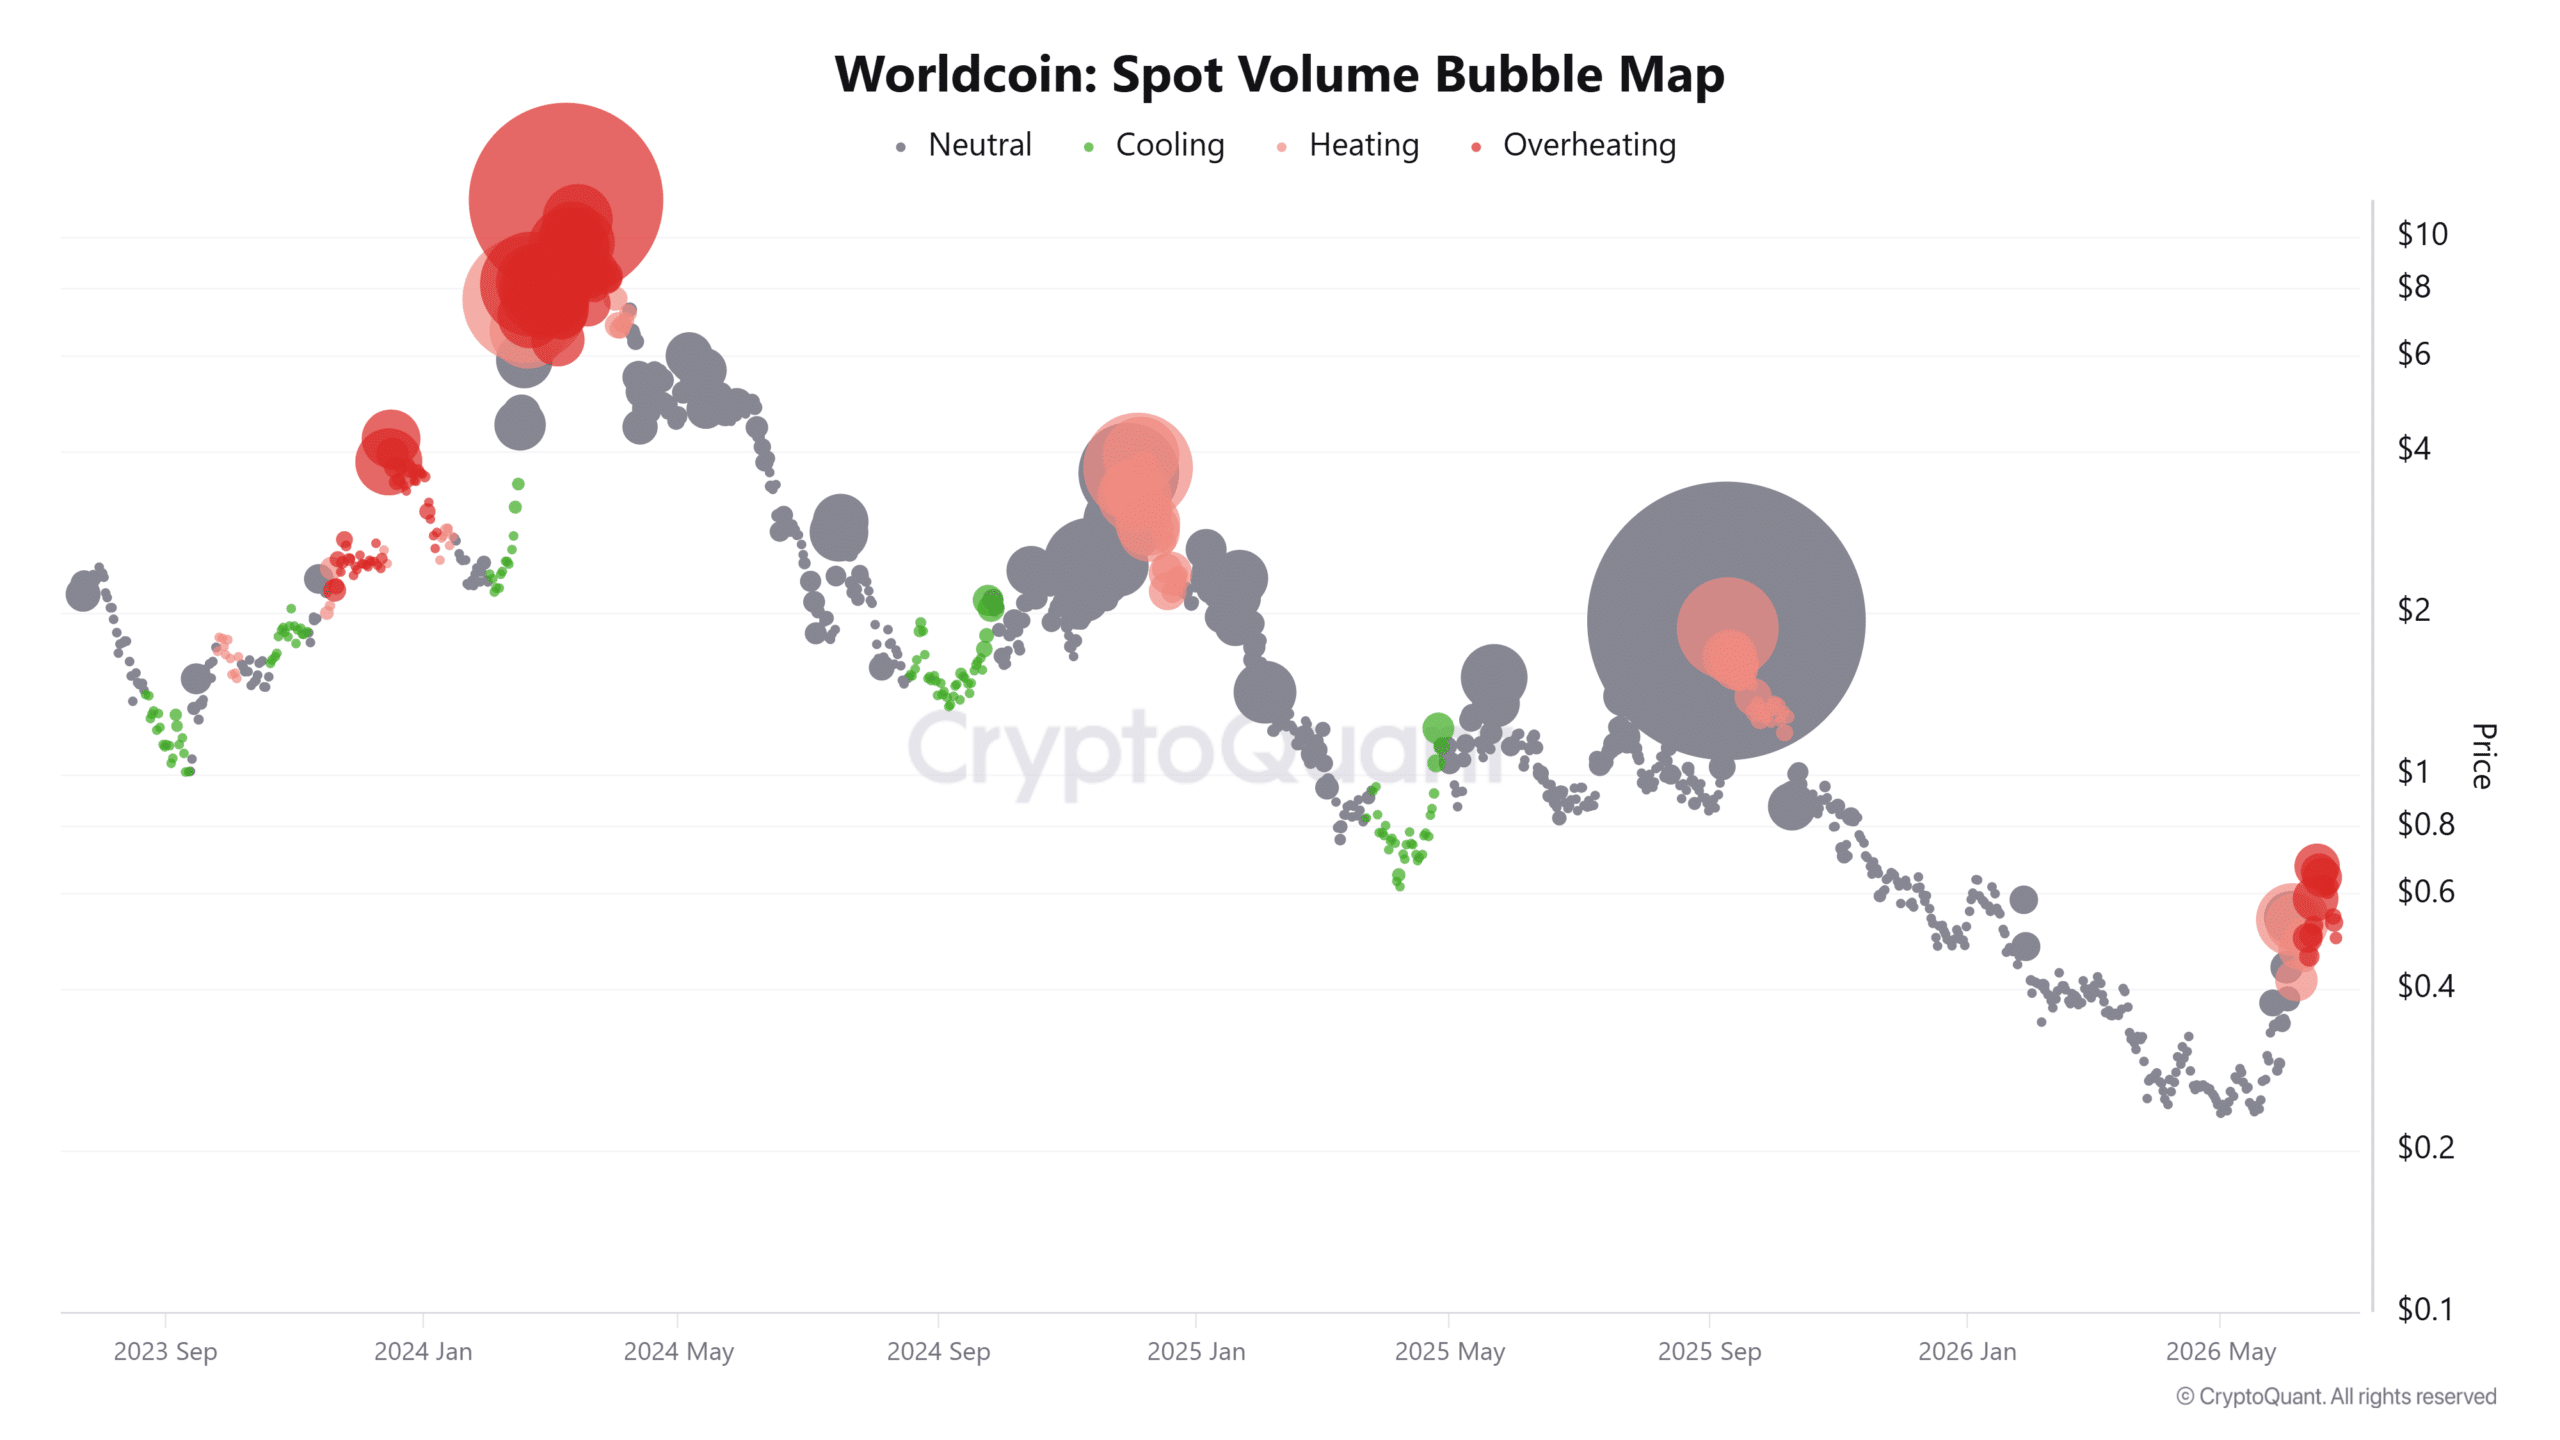
The Spot Volume Bubble Map continued signaling overheating, despite the decline in overall trading activity.

Rather than indicating renewed buying strength, the overheating condition suggested the market still carried elevated speculative activity capable of triggering sharp price swings.

Such conditions often precede heightened volatility as traders rapidly reposition around key levels.

Combined with persistent seller dominance, the overheating signal indicates uncertainty remained elevated instead of fading. Buyers, therefore, faced a difficult environment where abrupt price movements could emerge without sustained accumulation.

If speculative positioning gradually cooled while buying demand strengthened, price stability could improve. Otherwise, WLD will likely remain vulnerable to another period of elevated volatility before establishing a clearer direction.
Source: CryptoQuant

Channel breakdown shifts WLD’s outlook

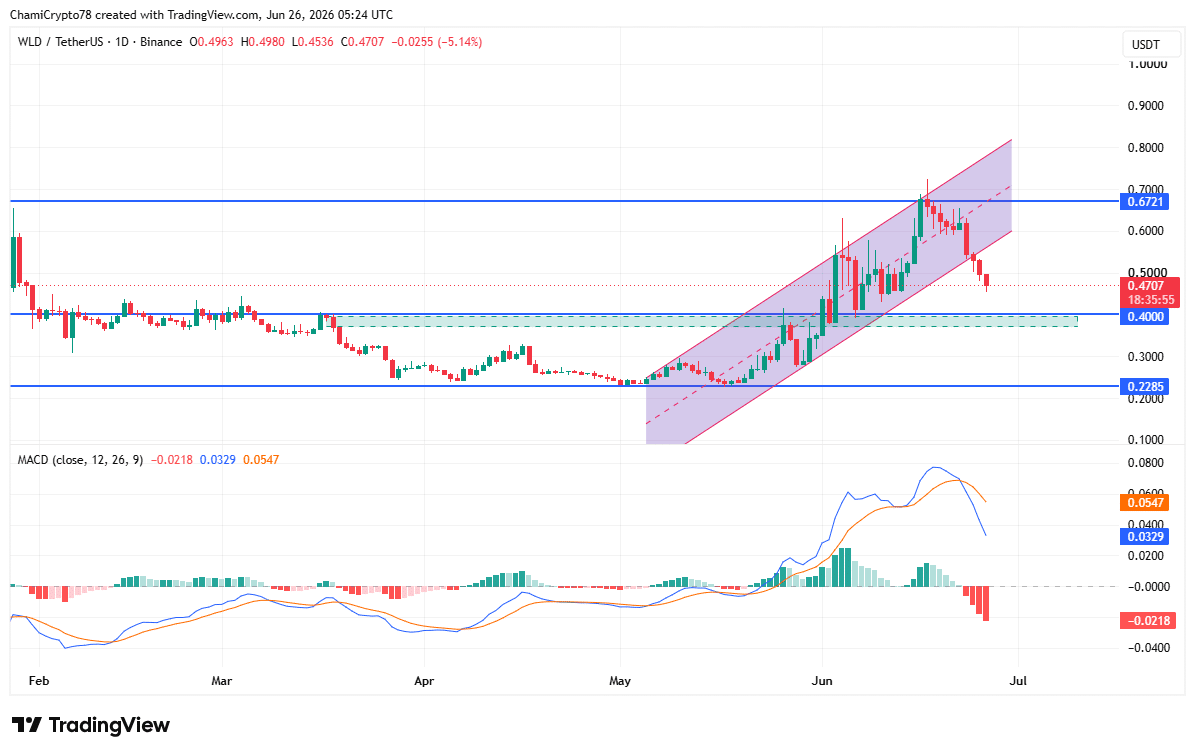
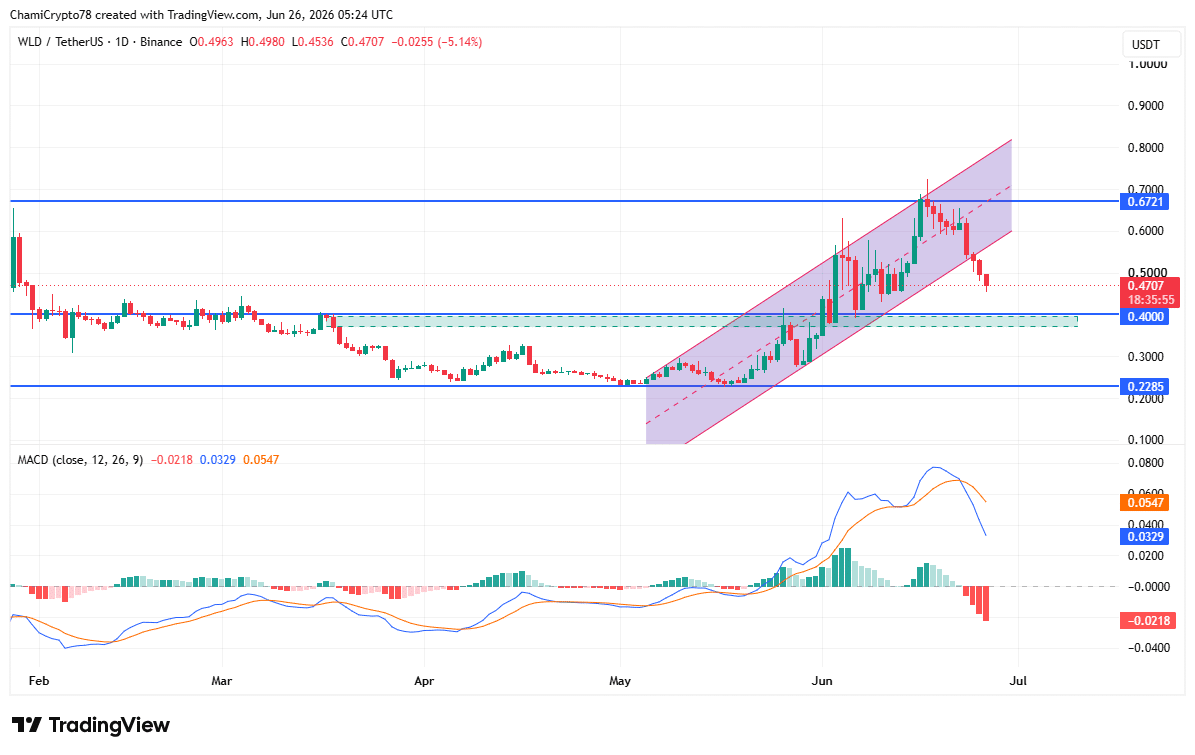
WLD broke below its ascending channel after facing strong rejection near the $0.67 resistance level, signaling the recent recovery structure had weakened.

The decline then pushed the price beneath $0.50, leaving the market moving toward the major $0.40 support without testing it yet. Meanwhile, the MACD completed a bearish crossover as the MACD line crossed below the signal line.

The histogram also expanded further into negative territory, confirming selling pressure had strengthened after the channel breakdown. These signals aligned with the weakening price structure rather than contradicting it.
Source: TradingView

If buyers defend the $0.40 area, WLD could attempt a rebound toward $0.50 before challenging $0.67 again. However, losing that support would expose the next major downside level near $0.23.


Final Summary

  • WLD approached the $0.40 support after breaking below its ascending channel structure.
  • Persistent Spot selling and a bearish MACD signaled buyers still lacked near-term control.

Trending Cryptos

Related Questions

QAccording to the article, what are the two main indicators that suggest Worldcoin (WLD) buyers lack near-term control?

AThe two main indicators are: 1) Persistent Spot Taker CVD showing seller dominance, indicating market sell orders outweigh aggressive buying. 2) A bearish MACD crossover where the MACD line crossed below the signal line, confirming strengthened selling pressure.

QWhat key price level did Worldcoin (WLD) fall below after its channel breakdown, and what is the next major support level mentioned if that level fails?

AAfter the channel breakdown, WLD fell below the psychological $0.50 level. The article states that if the $0.40 support area is lost, the next major downside level exposed would be near $0.23.

QWhat does the 'overheating' signal from the Spot Volume Bubble Map indicate about the market condition for WLD, according to the article?

AThe 'overheating' signal indicates that despite a decline in overall trading activity, the market still carries elevated speculative activity. This suggests a high level of uncertainty and the potential for sharp price swings or heightened volatility, rather than indicating renewed buying strength.

QWhat event technically signaled the weakening of Worldcoin's (WLD) recent recovery structure?

AThe weakening of the recent recovery structure was signaled when WLD broke below its ascending channel after facing strong rejection near the $0.67 resistance level.

QWhat was the change in Worldcoin's (WLD) price and trading volume over the 24-hour period discussed in the article?

AOver the past 24 hours, Worldcoin's (WLD) price declined by 10.27% to trade near $0.4635, while its trading volume dropped by 14.05% to $386.7 million.

Related Reads

Pharos Introduces On-Chain Institutional-Grade U.S. Corporate Bond Credit, Expanding Its RealFi Asset Portfolio

Pharos Network has launched the pRNH Vault, introducing institutional-grade US corporate high-yield bond exposure to its on-chain RealFi (Real World Finance) ecosystem. Developed by the R25 protocol, the vault provides qualified users access to a tokenized portfolio of high-yield corporate debt, broadening Pharos's asset offerings beyond stablecoins and cash-equivalents. The vault's underlying asset is the NYLIM Anemoy US High Yield Corporate Bond separate account (HYB), managed by New York Life Investment Management (NYLIM) and tokenized in collaboration with Anemoy and Centrifuge. Users can deposit USDC into the vault to receive pRNH tokens, representing indirect ownership of the HYB portfolio, which targets an annualized yield of approximately 7%. The structure offers programmability and composability for on-chain financial applications. Pharos views this move as a key evolution from basic asset tokenization towards building a dynamic marketplace where institutional assets can be actively discovered, evaluated, and utilized programmatically. The pRNH Vault architecture incorporates agent-assisted functionalities for credit screening, liquidity monitoring, and on-chain operations, signaling tighter integration between real-world finance and intelligent on-chain systems. To support this vision, Pharos employs a technical stack including the SALI engine for parallel execution, modular SPNs, protocol-level compliance, ZK-KYC/AML, and native AI agent support. The network positions itself as the "value discovery layer" for the agent economy, aiming to make real-world value, smart agents, and institutional assets widely accessible. The pRNH launch adds a core credit asset to this ecosystem and serves as a practical test case for its infrastructure.

marsbit10m ago

Pharos Introduces On-Chain Institutional-Grade U.S. Corporate Bond Credit, Expanding Its RealFi Asset Portfolio

marsbit10m ago

Deposits in RWA Tripled — Traditional Finance Chooses Blockchain

The decentralized finance (DeFi) sector is undergoing a structural shift, with tokenized real-world assets (RWA) taking center stage. According to a joint report by CoinShares and Token Terminal, deposits in RWA lending and trading platforms tripled year-over-year, reaching $7.4 billion in Q2 2026. This explosive growth starkly contrasts with a 15% decline in overall DeFi deposits and a nearly 70% drop in DEX trading volumes over the same period. Analysts highlight this divergence as evidence of a fundamental shift: demand is driven not by speculation but by the genuine utility of blockchain for traditional finance. The primary drivers are tokenized U.S. Treasury bonds and multi-strategy funds, like BlackRock's BUIDL, which investors use as reliable collateral to secure stablecoin loans while earning yield. The Ethereum network hosts about 70% of all RWA collateral. Beyond government bonds, the tokenization of equities and commodity derivatives is advancing. The tokenized equity market is estimated at $2.2 billion, while perpetual futures on assets like oil and the S&P 500 have seen explosive growth on platforms like TradeXYZ. Standard Chartered projects the total tokenized asset market could reach $4 trillion by 2028. This growth signals that RWA has moved beyond crypto market cycles, offering tangible value, deep liquidity, and 24/7 global access, marking a new phase of institutional scaling for blockchain-based finance.

cryptonews.ru45m ago

Deposits in RWA Tripled — Traditional Finance Chooses Blockchain

cryptonews.ru45m ago

Trading

Spot

Hot Articles

Discussions

Welcome to the HTX Community. Here, you can stay informed about the latest platform developments and gain access to professional market insights. Users' opinions on the price of S (S) are presented below.

活动图片