Uniswap (UNI) Price Prediction: UNI Eyes $5 as UNI Extends Bullish Breakout

cryptonews.ruPublished on 2026-07-31Last updated on 2026-07-31

Abstract

Uniswap (UNI) extended its recovery on Thursday, gaining over 10% in 24 hours and nearly 15% weekly, trading around $4.43. The key technical development was a breakout above the critical 0.786 Fibonacci retracement level at $4.33, signaling a significant shift in market structure. Price consolidated near the recent swing high of $4.58, with traders holding positions instead of taking profits. The token trades above all major moving averages (20, 50, 100, 200-day EMAs), confirming a bullish trend supported by a rising ADX and positive Directional Indicator. Open Interest in derivatives has steadily recovered to nearly $323 million, suggesting traders are rebuilding exposure, which combined with rising price signals growing market confidence. However, on-chain spot flow data shows persistent net outflows from exchanges, indicating some profit-taking remains. Key upside resistance levels are $4.58 and the $4.75–$4.80 zone; a decisive break above could open the path to $5.00. Key support lies at $4.33 (0.786 Fib), followed by $4.13 and the $4.00–$4.10 demand zone. The short-term outlook remains constructive above $4.33, but stronger spot demand is needed to sustain the next leg higher.

Uniswap ($UNI) extended its recovery on Thursday after strong gains in both daily and weekly trading sessions. The decentralized exchange token overcame a key technical barrier, strengthening the bullish sentiment in the market.

Technical Breakout Gives Bulls Control

$UNI traded at approximately $4.43 after rising over 10% in the last 24 hours and nearly 15% over the past week. The token also recorded a daily trading volume above $435 million, while maintaining a market cap of roughly $2.74 billion.

The recent break above the 0.786 Fibonacci retracement level at $4.33 marked a significant shift in market structure. Buyers quickly lifted the price towards the recent swing high around $4.58 before momentum slowed. However, the current consolidation suggests that traders are holding positions rather than taking profits.
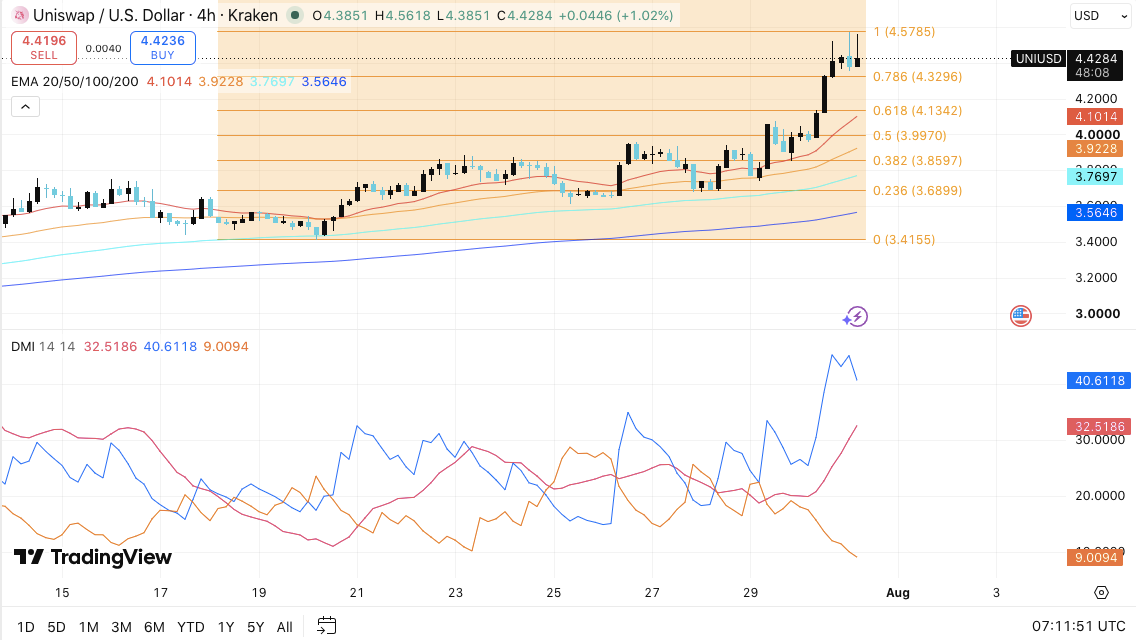
Uniswap Price Dynamics (Source: Trading View)

Furthermore, moving averages continue to support the uptrend. $UNI is confidently trading above the 20-day EMA at $4.10, the 50-day EMA at $3.92, the 100-day EMA at $3.77, and the 200-day EMA at $3.56. This alignment reflects healthy bullish momentum and reinforces the prevailing upward trend.

Related: Shiba Inu Price Prediction for August 2026: Can SHIB Hold 40% Gains Unlike Emirates and Support Its Search Traffic?

The Directional Movement Index also favors buyers. The Positive Directional Indicator remains significantly above the Negative one, while the rising ADX indicates strengthening trend momentum.

Open Interest Improves Despite Past Weakness

Derivatives data also paints a more constructive picture. Open interest has gradually recovered to nearly $323 million after a sharp decline from peaks above $700 million recorded in late 2025.
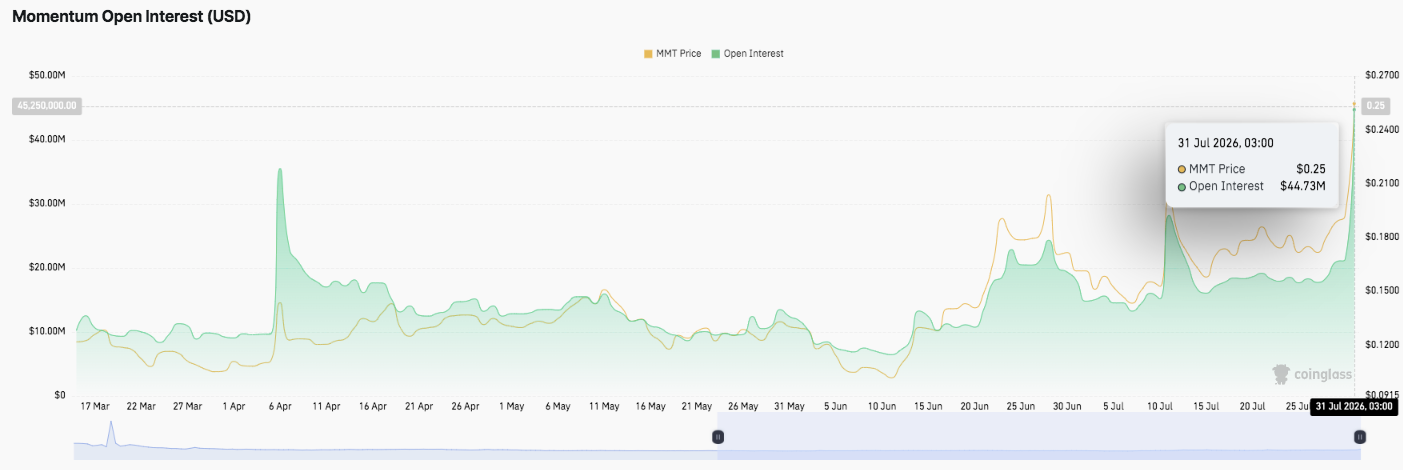
Source: CoinGlass

Although speculative positioning remains significantly below previous highs, the steady rise suggests that traders have begun to rebuild their exposure. Moreover, increasing open interest alongside rising prices often signals growing market confidence. Consequently, further gains in both metrics could provide additional fuel for $UNI's recovery.

Spot Flows Keep Traders on Edge

Despite encouraging technical indicators, spot market activity still reflects caution. Recent blockchain flow data shows that net outflows continue to exceed inflows, with the latest data indicating roughly $3.36 million leaving exchanges.
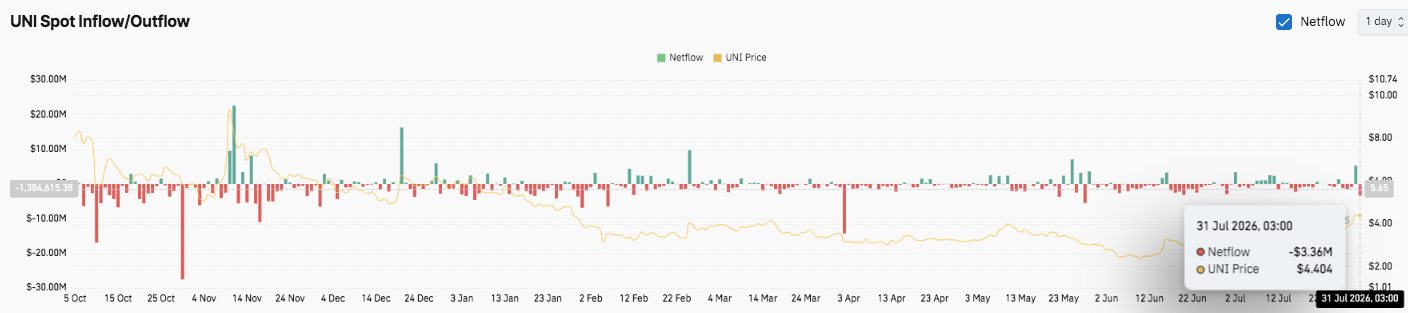
Source: CoinGlass

Furthermore, there have been recurring spikes of inflows followed by aggressive sell-offs in prior periods, highlighting ongoing profit-taking among market participants. Short bursts of accumulation have emerged in recent months, but they have failed to create sustained buying pressure.

Related: $XRP Price Prediction for August 2026: Can $XRP Break Its Year-Long Downtrend as Grayscale CEO Sells GXRP?

Uniswap ($UNI) Technical Overview

Key technical levels remain in focus as Uniswap attempts to continue its recovery after reclaiming a key Fibonacci resistance.

Upside Levels: $4.58 remains the immediate hurdle, followed by the $4.75–$4.80 resistance zone. A decisive break above these levels could open the door to the $5.00 psychological barrier.

Downside Levels: Initial support stands at $4.33, coinciding with the 0.786 Fibonacci retracement. Below this, $4.13 and the $4.00–$4.10 demand zone offer stronger support, while $3.86 serves as the next downside level should selling pressure intensify.

Trend Structure: $UNI continues to trade above its 20, 50, 100, and 200-day EMAs, confirming a bullish market structure. The rising ADX and dominant Positive Directional Indicator indicate that buyers still control the broader trend despite short-term consolidation.

Will Uniswap Rise?

Uniswap's short-term outlook remains constructive as long as the price holds above $4.33. A confirmed move above $4.58 is likely to enhance bullish momentum and increase the probability of a rise towards the $4.75–$5.00 range. The rising open interest also points to a gradual rebuilding of bullish positions, supporting the recovery.

However, spot market flows continue to show net outflows, indicating that some investors are still taking profits. If buyers fail to defend $4.33, $UNI could retreat towards $4.13 or the $4.00–$4.10 support zone before attempting another move higher. For now, the technical picture favors the bulls, but stronger spot demand will be required to sustain the next leg up.

Related: Cardano Price Prediction for August 2026: Will ADA's Triangle Breakout Happen Before or After the CLARITY Law Deadline?

end-content

Related Questions

QAccording to the article, what is the key technical level that Uniswap (UNI) recently broke through?

AThe article states that Uniswap (UNI) recently broke through the 0.786 Fibonacci retracement level at $4.33, which marked a significant shift in the market structure.

QWhat are the price targets for UNI's growth mentioned in the article?

AThe article mentions that a decisive break above $4.58 could pave the way for a move towards the $4.75-$4.80 resistance zone and the psychological barrier of $5.00.

QWhat does the trend of increasing Open Interest alongside rising prices suggest for the UNI market, according to the article?

AAccording to the article, an increase in Open Interest alongside rising prices often signals growing market confidence and can provide additional momentum for a recovery.

QDespite positive technical indicators, what ongoing activity in the spot market reflects investor caution regarding UNI?

AThe article points out that data shows net outflows from exchanges continue to exceed inflows, with recent figures showing approximately $3.36 million leaving exchanges, indicating profit-taking and investor caution.

QWhat is identified as the crucial support level for UNI to maintain its short-term constructive outlook?

AThe article states that Uniswap's short-term outlook remains constructive as long as the price holds above the key support level of $4.33.

Related Reads

Goldman Sachs: July Smashes Through Crowded Trades, U.S. Stock Bull Market Not Broken but Harder to Navigate

Goldman Sachs: July Sees Crowded Trades Unwound, U.S. Bull Market Intact but Getting Tougher. The U.S. stock market in July did not see an index-level crash, but rather a significant unwinding of speculative positions. While the S&P 500 remained stable—trading within a narrow 3.5% range and staying within 2% of its high—underlying market dynamics were volatile. Heavily crowded trades, particularly in high-momentum tech, AI-linked stocks, and Asian strategies, faced severe pressure and forced deleveraging. Data indicates this was a meaningful cleanse, not a minor adjustment. Global tech exposure saw its largest sell-off in over five years, leverage in Korean equity ETFs plummeted, and Goldman's prime brokerage recorded the largest gross exposure reduction since late 2022. Leverage on momentum factors among fundamental long/short clients fell to the 28th percentile of its one-year range. The AI trade narrative shifted from pure potential to a focus on tangible returns. While Meta failed to show clear AI monetization, Microsoft and Amazon provided evidence that massive capital expenditure is translating into scalable revenue and product growth, preventing a blanket sell-off of the AI sector. The Federal Reserve's more opaque communication style and volatility in long-end Treasury yields have introduced new friction, particularly for rate-sensitive growth and tech stocks. The broader outlook for U.S. equities remains favorable, supported by a strong economy, robust earnings, and substantial AI capital expenditure. However, risk/reward is no longer cheap, and the market's upward elasticity has weakened. The Nasdaq 100's trajectory—up 12% year-to-date despite significant pullbacks—illustrates that the bull trend persists but the path is becoming more difficult. The key lesson from July is that the market no longer rewards crowded, highly leveraged trades, requiring more disciplined and liquid portfolio approaches.

marsbit3h ago

Goldman Sachs: July Smashes Through Crowded Trades, U.S. Stock Bull Market Not Broken but Harder to Navigate

marsbit3h ago

Trading

Spot
活动图片