Original Author:Solus Group, Crypto Researcher
Compiled by: CryptoLeo(@LeoAndCrypto)

Editor's Note: Recently, analyst Ash stated in a popular post that among over 100 new tokens TGE'd in 2025, 84.7% had an FDV lower than at TGE. The median FDV of these tokens fell by 71% (median market cap fell by 67%). Only 15% of tokens saw an increase in FDV compared to their TGE FDV. Overall, for new tokens issued in 2025, most tokens fall into the category of "price peaking at TGE".
Extending from this data, I found a more interesting article (from Solus Group), which also starts from the project token TGE, analyzing the correlation between the post-TGE performance of 113 tokens in 2025 and their funding situation, community activity, and exchange listings. The research found that high funding, active communities, and exchange listings—common screening criteria for project quality—have little impact on token performance. We often used these conditions to filter for good projects, but in 2025, this project evaluation model has "failed". One set of data is particularly thought-provoking:
- Projects trading below their IDO price had an average revenue of $1.36 million.
- Projects trading above their IDO issuance price had an average revenue of $790,000.
But these projects all received venture capital support, indicating to some extent that the market values hype over actual performance, stories over data, promises over the product itself. Web3 can no longer pretend "everything is fine," nor call bot traffic "growth." Of course, this article draws some conclusions based on statistics and is not a standard suitable for all projects. Good projects and large funding rounds still represent the direction of the crypto industry's development. Odaily Planet Daily compiles it as follows:
$2 million in funding, top-tier VC participation, 500,000 community followers, listed on a major exchange, a spectacular first day, jubilation on Discord, and a celebratory atmosphere all over social media.

In a previous article, we revealed the reality of the 0.96x ROI: by 2025, the average token effectively died on day one, we proved the system is broken. Now, we've analyzed 113 token launch cases since 2025, proving it with hard data—data most founders dare not face.
The findings are shocking: large funding doesn't help, huge communities don't matter, every variable you optimize is statistically insignificant.
But something more twisted lies beneath the surface, still haunting many founders:
Currently, a project's revenue status is a bearish signal; tokens of profitable projects trade lower than those of unprofitable ones. This dynamic is a matter of life and death. If we continue to punish the profitable and reward the speculators, the entire industry cannot survive.
Odaily Planet Daily Note: Solus Group previously disclosed relevant data showing the average ROI for new project tokens TGE'd in 2025, calculated from the day after issuance, was 0.96, meaning their product launch was effectively losing money from day one.
The Founder's Data Trap: The Funding Paradox, High Funding ≠ Token Advantage
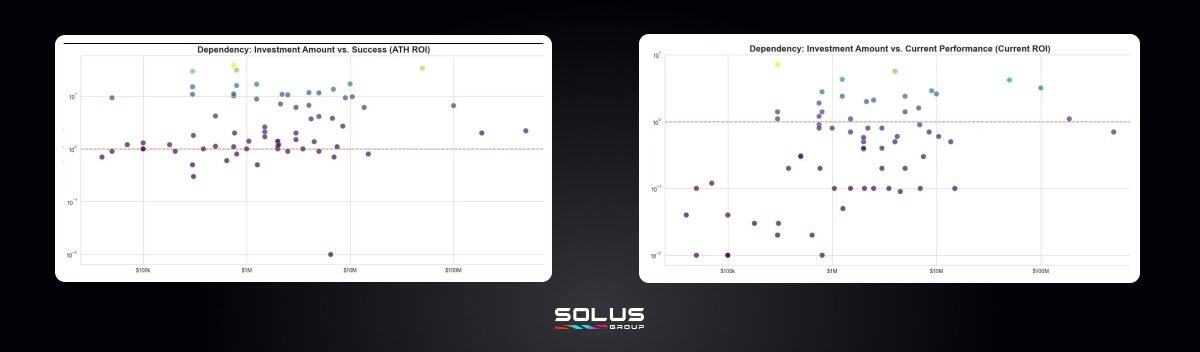
Correlation between funding and token performance: 0.04, statistically considered zero.
Tokens from projects that raised $10 million perform identically to those that raised $1 million. The chart above proves it—the distribution of token performance across the ROI range is random, regardless of funding amount. The best performers: Myshell, B2 Network, Bubblemaps, Mind Network, Particle Network, Creator.Bid (10x to 30x valuation at ATH) raised $300k to $3 million. Meanwhile, projects like Boundless and Analog that raised over $10 million have valuation multiples of around 1x.
Current token performance is even worse; most tokens have an ROI below 1x, regardless of funding size. For example, tokens that raised $5M to $100M have ROIs of 0.1x to 0.7x (e.g., Fleek, Pipe Network, Sahara AI), the same as tokens with little funding.
The truth is: Large funding accelerates token death spiral.

Projects with the least funding ($300k to $5M) have a higher ROI per dollar raised. They execute faster, pivot cheaper, and aren't drowned by quarterly VC token unlock schedules that destroy project gains.
If you chase $10M to "compete," you are preparing to fail.
The Community Myth: A Large Project Community is Also a "Paper Tiger"
500,000 social media followers vs. 50,000 followers, the statistical result is exactly the same.
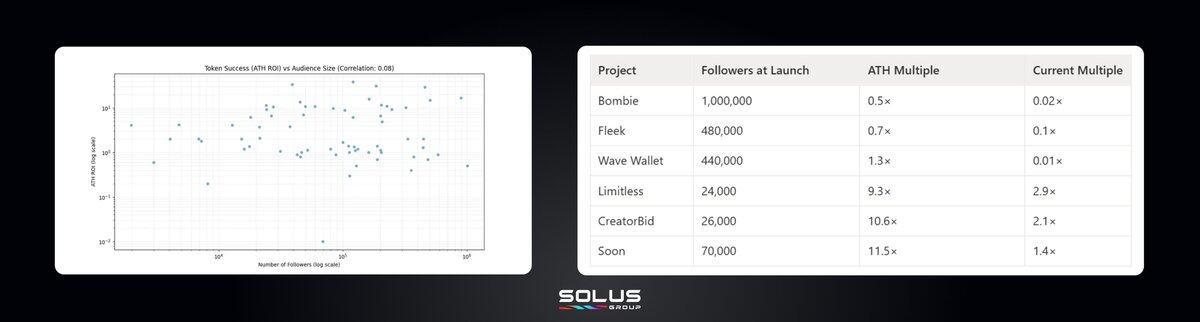
Correlation coefficients: 0.08 (Token ATH) and -0.06 (Token Current)
The data shows audience size has no predictive value for token performance. Projects with huge followings have mixed results—some surge, some crash. The same goes for projects with small audiences. No trend, no pattern, no correlation.
Your Discord group is not a community; it's a speculative audience waiting to leave.
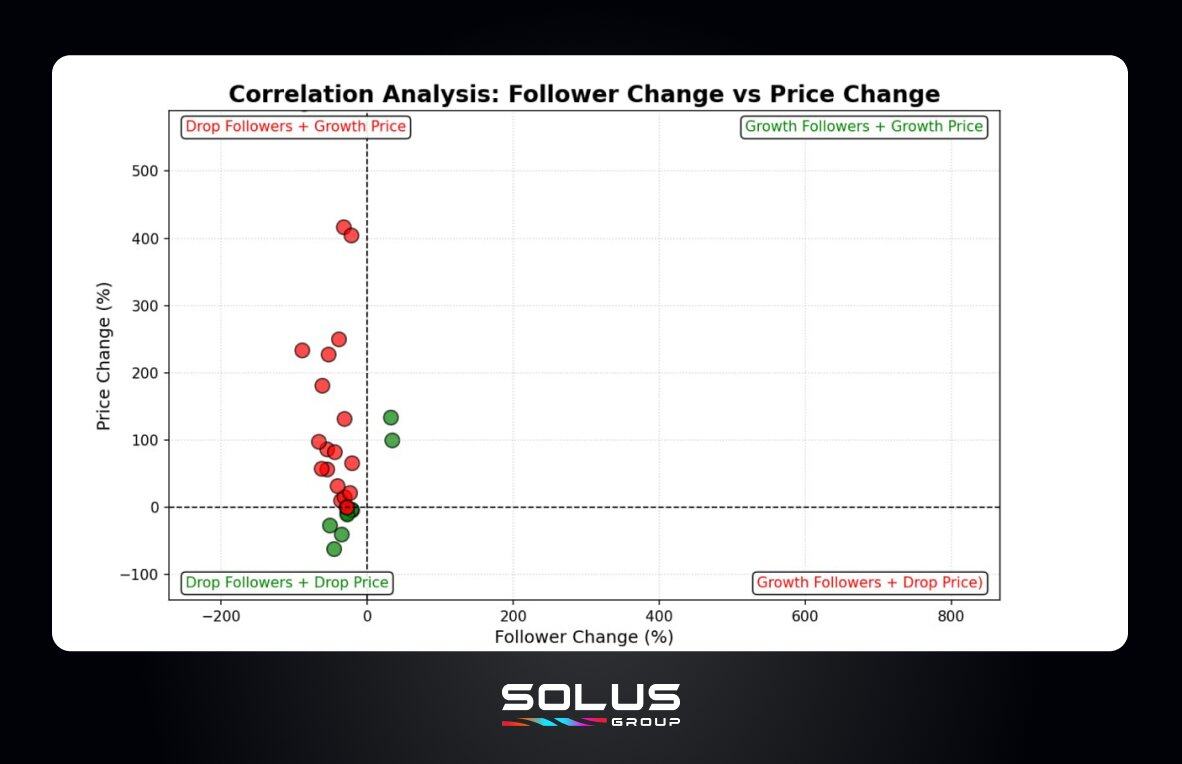
Reality: Price dictates community growth, not the other way around.
When price plummets, followers vanish. The chart proves this—the bottom-left quadrant (decreasing followers + falling price) is very dense. When price soars, followers sometimes grow, but it's not consistent.
This means:
Your "active community" never really cared about the product—they cared about the token price action. They disappear if the token underperforms. Community growth is a lagging indicator, not a leading one.
This isn't just theory; it's the stated view of @belizardd (Researcher & Trader/KOL):
Most people are here purely for speculation, not the product itself. We see very few protocols performing well post-TGE, mainly those with low initial FDV, not high fundraising, and generous airdrops. Honestly, I won't blindly ape into anything right now. The risk/reward isn't worth it; I'm just waiting for the market to improve.
Speculators know the game is broken. They are waiting on the sidelines. Meanwhile, founders keep burning 60% of their budget on Discord bots, Twitter giveaways, and KOL promotions—statistically insignificant metrics.
The real question is: "If the token dropped 50% tomorrow, how many would stay?"
Answer: Almost none.
Token Price Trap, Beware of Overpricing/Underpricing
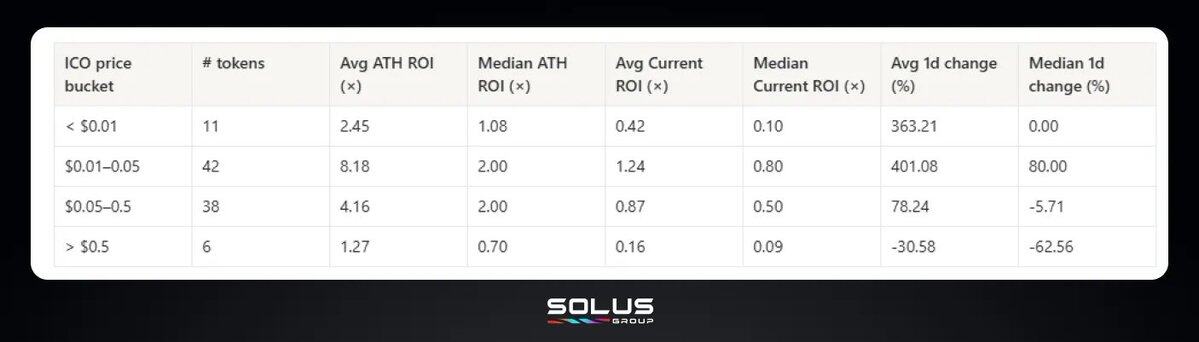
Median ROI by token listing price:
Below $0.01: 0.1x (90% loss)
$0.01 to $0.05: 0.8x (Viable zone)
$0.05 to $0.50: 0.5x (50% loss)
Above $0.50: 0.09x (91% loss)
Let me repeat that:
Pricing below $0.01 doesn't make your token "more accessible"; it makes you a low-priced coin attracting mercenary capital that pumps fast and dumps faster.
Pricing above $0.50 doesn't make your token a "premium token"; it makes it overpriced. Excessively high token prices kill retail markets, and whales won't bite either.
The $0.01 to $0.05 token price range is the only viable pricing zone. This price is high enough to signal legitimacy and low enough to leave room for upside. Within this price range, only 42 out of 97 tokens had a median positive performance.
If your tokenomics peg your valuation at $0.003 or $1.20, stop rebuilding the model; the data says it's already failed.
Industry Status: Stop Building Like It's 2021
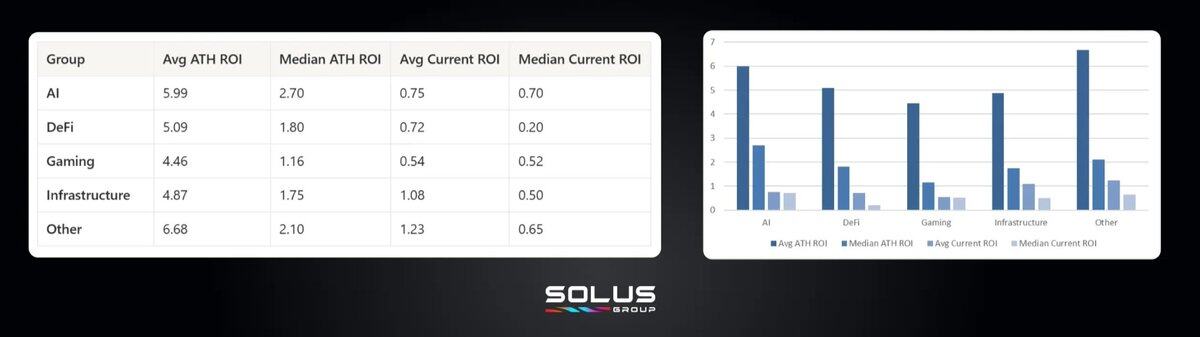
Loser: Gaming
Average ATH ROI: 4.46x (Lowest)
Median Current ROI: 0.52x
GameFi tokens are like lottery tickets; play once, forget forever.
Trap: DeFi
Average ATH ROI: 5.09x (Looks good)
Median Current ROI: 0.2x (Disastrous)
DeFi has early massive pumps followed by deeper crashes than any other sector. The gap between hype and reality is brutally stark.
Winner: AI
Average ATH ROI: 5.99x (Highest peak)
Median Current ROI: 0.70x (Best retention)
AI tokens pump and hold. The trend has staying power, and money follows.
If you're building GameFi, your execution needs to be 10x better than average to achieve an average result. If you're in DeFi, prepare for rapid pumps and violent dumps. If you're in AI, the market will give you a chance, but only if you deliver. Infrastructure is even more demanding: you burn more time and resources compared to standard dApps (like AI agents), yet your median current ROI is slightly lower than the universally frowned-upon GameFi sector.
The data doesn't care which project you find interesting.
IDO/IEO Data Overview: A Good Platform Cannot Save a Project
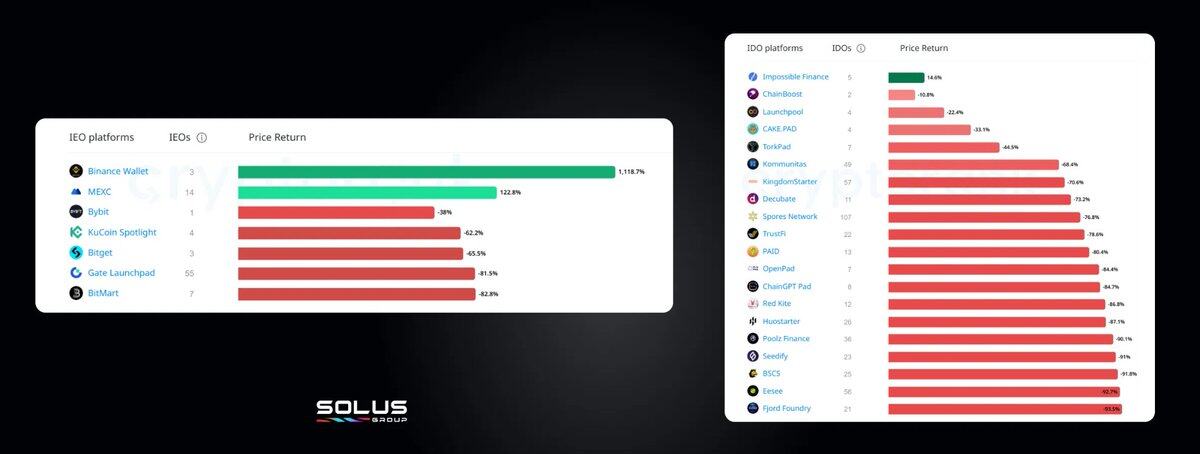
You spend months networking just to get a spot on Binance Launchpad or an allocation from a tier-1 IDO, thinking platform curation means protection. The data shows otherwise.
IDO Platforms: Almost all projects are in the red
Only one project on one of the 5 IDO platforms had a return of +14.6%. That's it. All others ranged from -70% to -93%.
So-called "premium Launchpads" don't protect buyers; they just offer a branded way to lose money.
IEO Platforms: Survivorship Bias at its Finest
Binance wallet shows an 11x return. Looks incredible, but it's only 3 launches, a tiny sample. MEXC shows +122.8% across 14 launches—a larger sample but still an outlier. Everyone else? Underwater. Bybit IEO tokens are down 38%, others are worse.
This proves:
Platform selection is a lottery with better branding. A few outlier wins skew the average, while the vast majority of launches trend downward. The "curation service" you pay for—whether through connections, listing fees, or token allocations—does not reliably protect token ROI.
Platforms cannot save garbage tokens, nor can they help good tokens.
Reflecting on 2025, Looking Ahead to 2026
Project development in 2025 failed at every level.
Layer Zero: Foundation
Problem: "Speculation-based tokenomics." Indiscriminate token dumping into illiquid markets without organic revenue models to absorb the shock.
First Layer: Funding
Problem: "Fake it in the PDF, fix it later."
Second Layer: Marketing
Problem: The KOL model, paid shills, rented users who vanish the moment payments stop.
Third Layer: Liquidity
Problem: Assuming liquidity follows hype; it doesn't. Institutional money waits for proof.
Fourth Layer: User Retention
Problem: Zero-retention infrastructure. The "project community" is 10,000 Telegram users who will abandon you within 90 days.
2026 shouldn't be about playing the old game. There's a deeper problem behind all this. Infrastructure does matter, but even with perfect infrastructure, timing is everything. As Ivan Paskar (Growth Lead at Altius Labs) said:
Tokens don't fix broken things—they amplify reality. Right timing = momentum multiplies. Wrong timing = years of work vanish instantly. Most teams don't fail on token design; they fail by misjudging their stage and the macro environment. Timing isn't a detail; it's everything.
What Should Projects Do in 2026
Survival isn't about following the old playbook; it's about building a new one.
1. Raise Wisely
Target $300k to $5M. The highest ROI per dollar is here. More money = more problems.
2. Price for Survival
Launch between $0.01 and $0.05. Everything else struggles. If your tokenomics don't fit this range, they are broken.
3. Product First, Token Second
If you can't explain why your token exists in one sentence, it doesn't. Revenue precedes speculation.
4. Ignore Vanity Metrics
Follower count is noise. Active wallets, retention, and revenue per user are signal.
5. Sector Realism
Know your sector's failure rate before writing code. GameFi needs 2x the execution just to break even. AI has tailwinds—if you can deliver.
6. Consolidate or Die
The era of M&A is coming. If you can't scale alone, find an acquirer. Acquisition isn't failure; it's strategy.
These six principles matter. But the truth is: The standard playbook is dead. There is no one-size-fits-all model anymore.


