Monad [MON] a bondi de 15 % tandis que le volume des échanges a augmenté de plus de 75 %, reflétant une forte participation alors que le prix avançait vers la résistance. Monad s'échangeait autour de 0,02512 $ après avoir rebondi depuis des creux récents, montrant une intention claire de hausse.
Ce mouvement fait suite à une reprise régulière depuis une consolidation près de 0,02039 $, où les acheteurs sont intervenus à plusieurs reprises. En conséquence, l'action des prix reflète désormais un renforcement de la demande plutôt que des pics aléatoires.
Cependant, l'avancée rencontre maintenant une zone de réaction clé, où des pressions de vente antérieures sont apparues. Ce positionnement crée un moment critique, car l'activité croissante coïncide avec MON testant la résistance.
La structure actuelle suggère de la force, mais la réaction à cette zone déterminera si la continuation se maintient ou s'arrête.
MON peut-il franchir cette zone d'offre ?
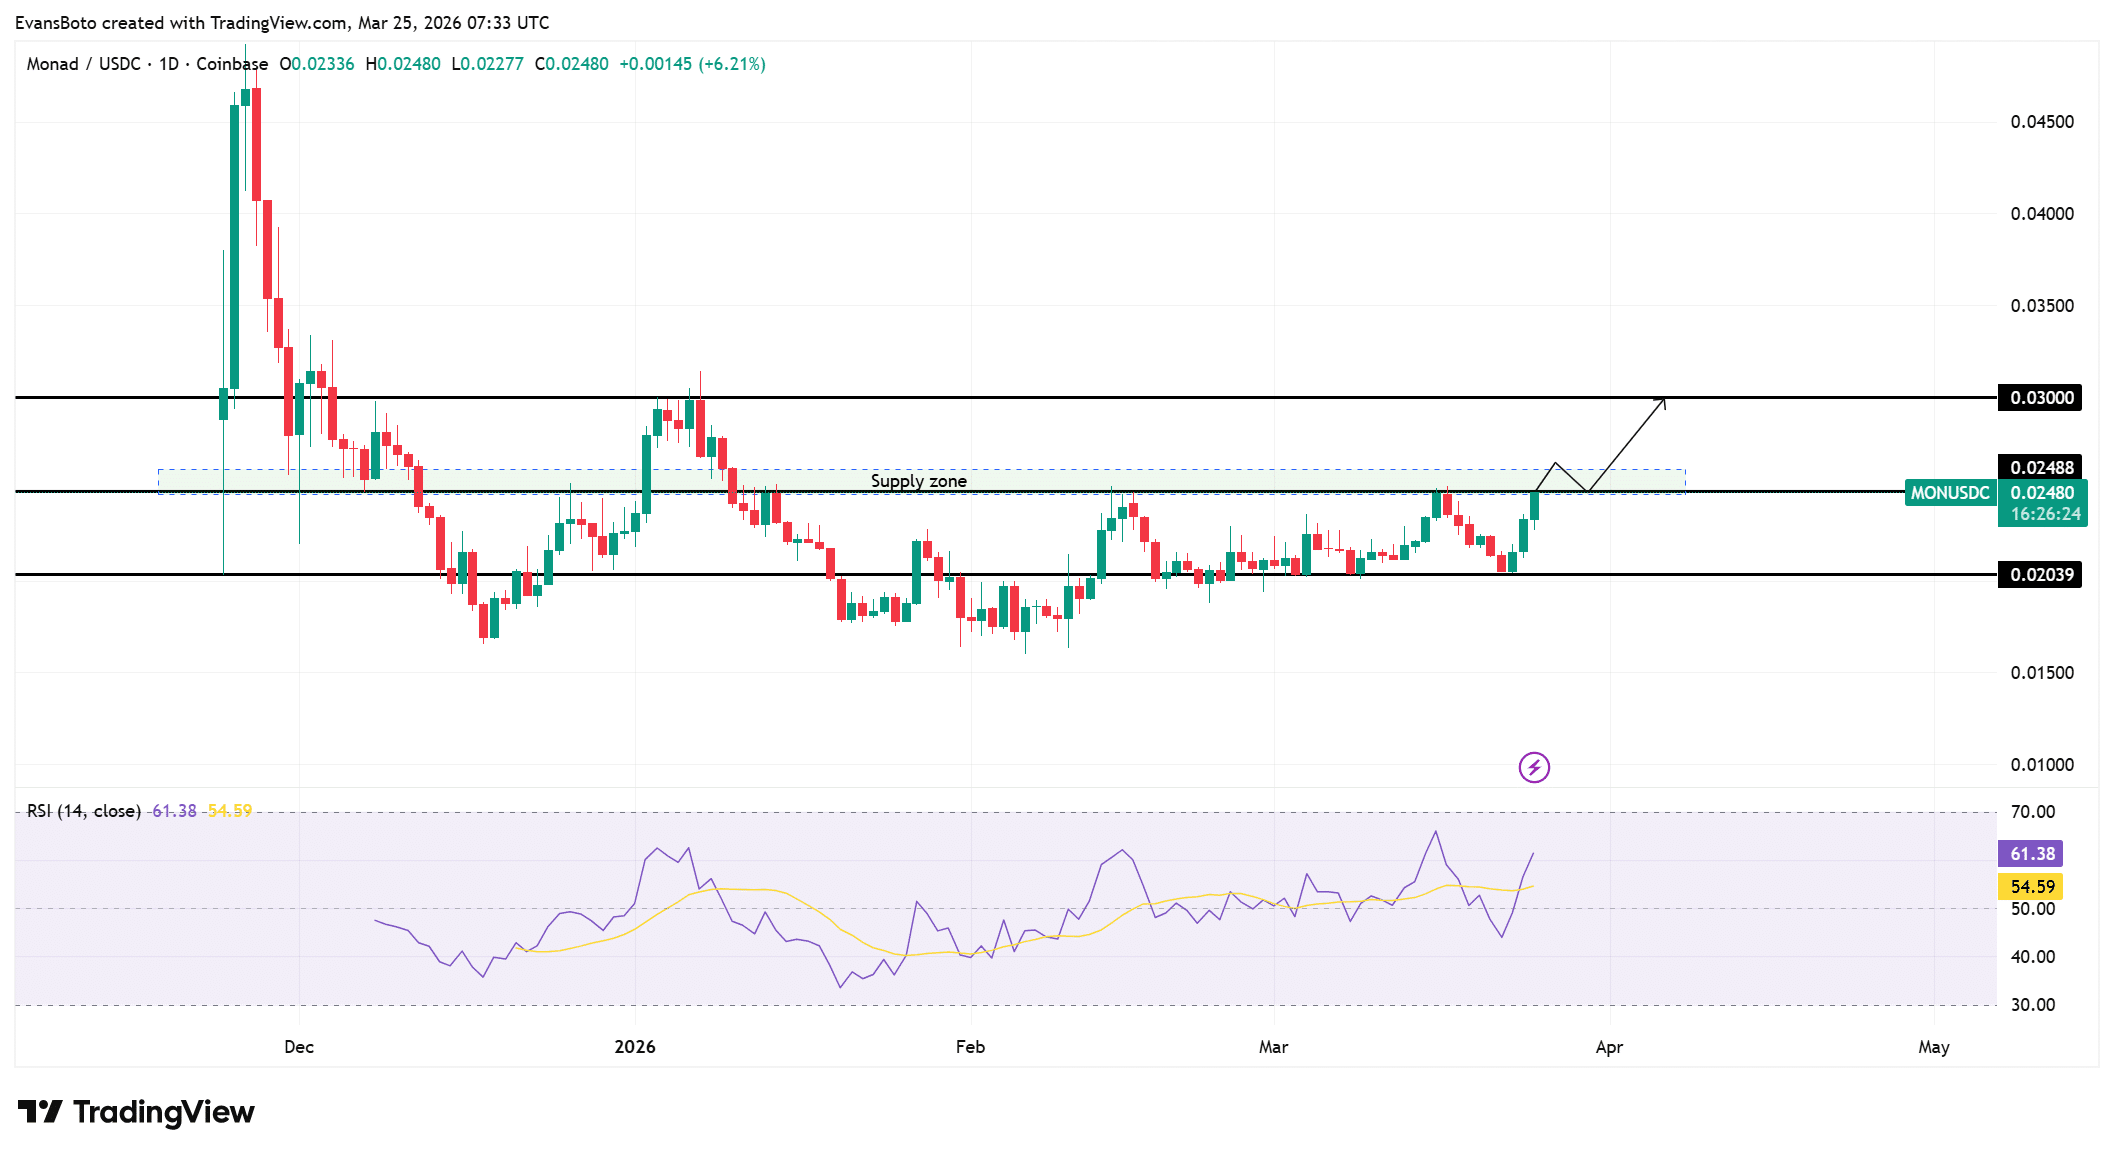
MON a reconquis le support à 0,02039 $ et continue d'imprimer des plus bas plus élevés, signalant une accumulation contrôlée.
Il fait maintenant pression directement sur la zone d'offre à 0,0248 $, où un rejet s'est produit précédemment. Cette structure montre une compression sous la résistance, qui précède souvent une expansion si les acheteurs maintiennent la pression.
Cependant, des tests répétés sans breakout pourraient affaiblir les acheteurs. Une franche cassure au-dessus de 0,0248 $ exposerait le niveau de 0,0300 $, qui constitue la prochaine résistance visible.
Jusqu'à ce que cela se produise, le prix reste à l'intérieur d'une zone contestée. La manière dont le prix se comporte ici importe plus que le mouvement lui-même.
Des clôtures soutenues au-dessus de cette zone confirmeraient la force, tandis que l'hésitation pourrait inviter un renouvellement de la pression vendeuse depuis ce niveau.
Le RSI était d'environ 61,38 au moment de la rédaction, se maintenant fermement au-dessus de la ligne médiane et reflétant un contrôle soutenu des acheteurs.
Il a maintenu cette position après avoir grimpé progressivement depuis des niveaux inférieurs, montrant une force structurée plutôt que des pics brusques.
Ce comportement suggère que les acheteurs continuent de soutenir le prix lors des légers replis. Cependant, le RSI reste en dessous du territoire de surachat, ce qui laisse de la place pour de nouvelles tentatives de hausse.

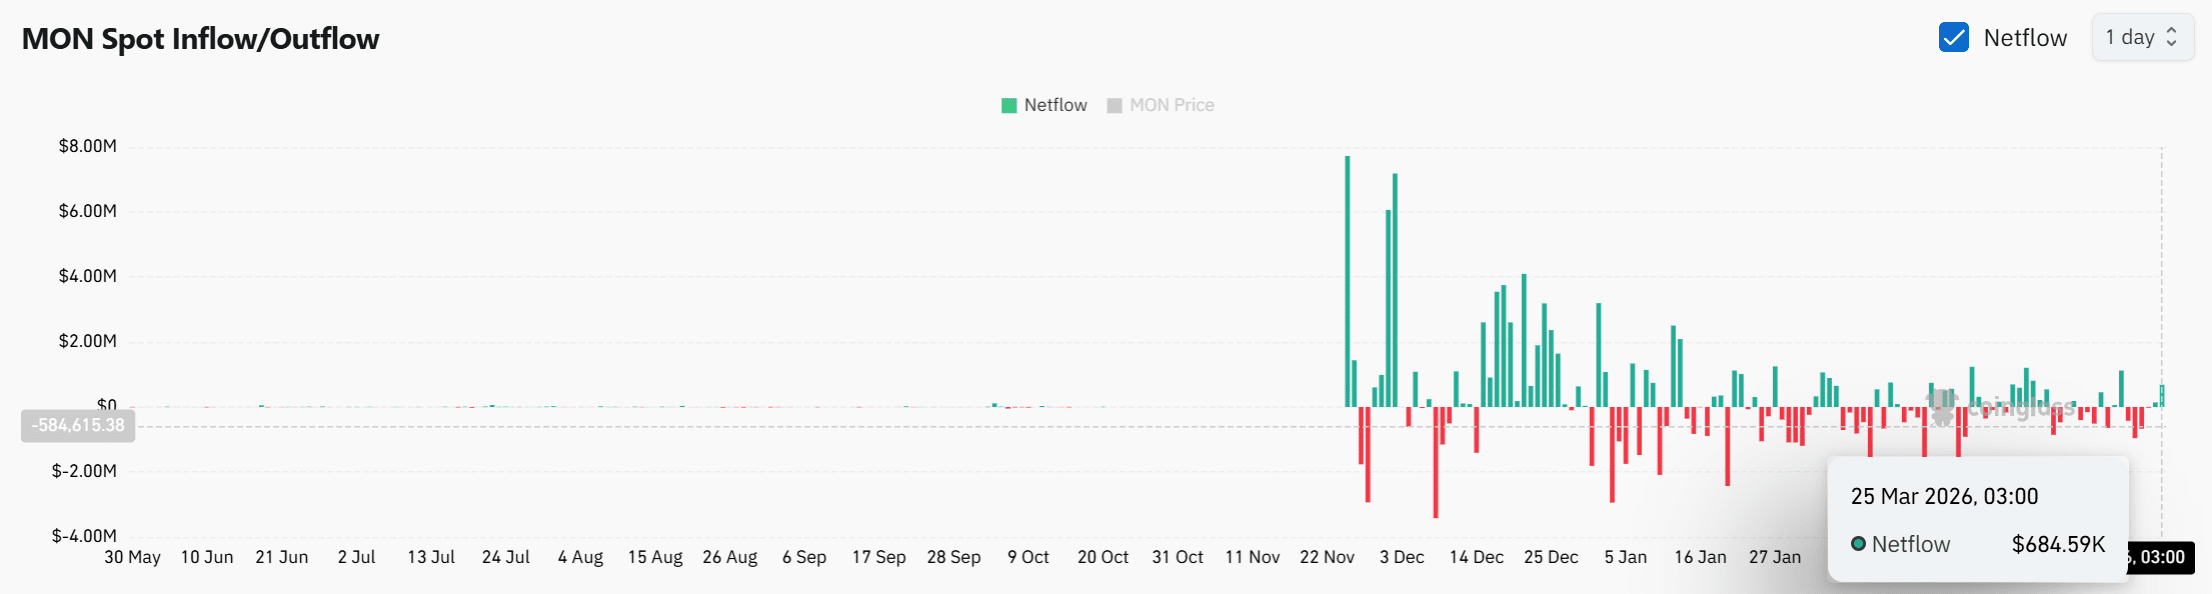
Les entrées sur les exchanges augmentent alors que les flux nets deviennent positifs
Les données récentes sur les flux nets montrent une entrée de +684 k $, indiquant que les jetons retournent sur les exchanges. Ce changement introduit une dynamique différente par rapport aux phases antérieures, où les sorties dominaient.
Alors que le prix approche de la résistance, l'augmentation des entrées suggère que les participants pourraient se préparer à distribuer leurs avoirs.
Ce comportement apparaît souvent près des niveaux clés où les traders réévaluent leurs positions. Cependant, les entrées à elles seules ne confirment pas une pression vendeuse à moins d'être soutenues dans le temps.
Le timing de cette entrée est important, car il coïncide avec le test de l'offre par le prix. Si les entrées continuent d'augmenter, la disponibilité des vendeurs augmenterait.
Si elles se stabilisent, l'impact pourrait rester limité. À présent, les flux nets reflètent un changement prudent plutôt qu'une distribution pure et simple.
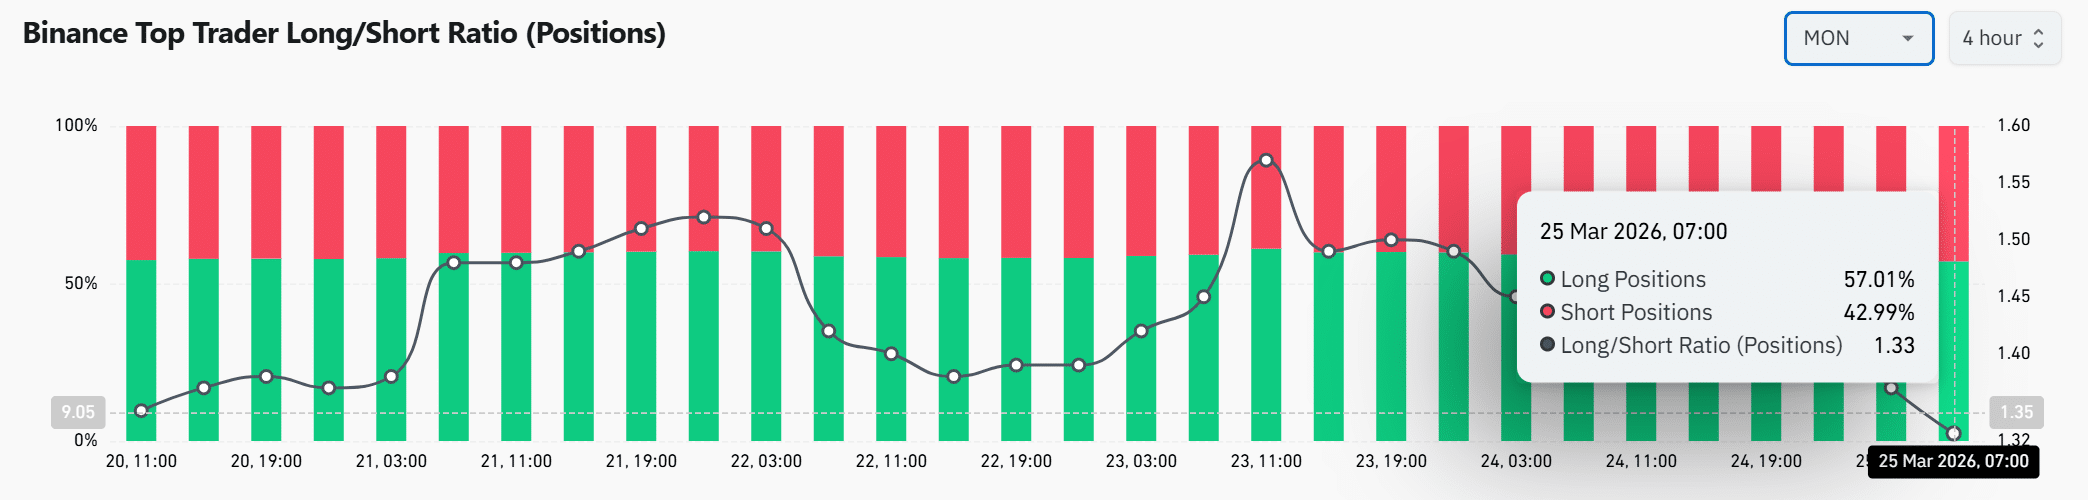
Le biais haussier se maintient alors que les traders se positionnent agressivement
Les principaux traders de Binance maintiennent un biais haussier clair, avec des positions longues à 57,01 % et un ratio Long/Short proche de 1,33.
Ce positionnement reflète une forte conviction directionnelle envers une continuation à la hausse. Il montre que les traders continuent de construire leur exposition même si le prix teste la résistance.
Cependant, un positionnement long élevé introduit une sensibilité aux renversements soudains. Si le prix ne parvient pas à franchir la résistance, ces positions pourraient se dénouer rapidement. Cette dynamique crée un environnement à effet de levier où les mouvements de prix peuvent s'accélérer dans les deux sens.
L'alignement entre la force au Spot et le positionnement sur les produits dérivés soutient l'avancée actuelle.
Néanmoins, un positionnement trop concentré augmente le risque si le sentiment change. À ce stade, les traders restent confiants, mais la configuration exige une confirmation par l'action des prix.
MON peut-il maintenir ce mouvement haussier ?
MON peut maintenir ce mouvement haussier seulement s'il assure une acceptation au-dessus de la zone d'offre à 0,0248 $ avec un soutien continu des acheteurs.
La force du RSI et le positionnement long dominant soutiennent la continuation. Cependant, l'augmentation des entrées sur les exchanges introduit un risque de vente à court terme.
Si les acheteurs maintiennent le contrôle et absorbent l'offre, le prix avancerait probablement vers 0,0300 $ ; sinon, un rejet déclencherait un repli contrôlé vers le support à 0,02039 $.
Résumé final
- Une force soutenue au-dessus de la résistance validerait la continuation, mais l'augmentation des entrées sur les exchanges pourrait perturber la structure haussière à court terme.
- Le positionnement des traders reste fortement haussier, ce qui pourrait accélérer la hausse si elle est validée ou déclencher une baisse brutale si elle est invalidée.