How VIRTUAL surged 12% while $190K tokens left exchanges – Assessing…

ambcryptoPublished on 2026-02-26Last updated on 2026-02-26

Abstract

VIRTUAL surged 12.53% in 24 hours, with trading volume up 32.64%, pushing its price toward $0.6660. Market cap held near $437 million as buyers consistently supported the $0.50–$0.55 demand zone. Despite the rally, price remains below the key $0.70 resistance—a level critical for a potential trend reversal. Technical indicators like the Parabolic SAR and Stochastic RSI suggest short-term bullish momentum, though overbought conditions may pose pullback risks. Exchange outflows of around $190K indicate reduced selling pressure, while a 20.61% rise in Open Interest to $69.45M shows aggressive derivatives positioning. The $0.70 level remains the decisive barrier for continued upside or renewed rejection.

VIRTUAL surged 12.53% in 24 hours as volume jumped 32.64%, pushing price toward $0.6660.

Market capitalization held near $437 million while participation expanded across spot and derivatives markets. Buyers stepped in repeatedly around the $0.50–$0.55 demand zone following the recent rebound.

The 24-hour volume reached $77.25 million, confirming genuine engagement rather than thin liquidity spikes.

However, price remained below the broader breakdown region that triggered the prior leg lower.

This left traders focused on whether the recovery could shift structure. For now, Virtuals Protocol [VIRTUAL] built short-term strength while testing overhead supply.

Can VIRTUAL reclaim the $0.70 ceiling?

As of press time, VIRTUAL continued trading within a broader descending structure that has defined lower highs since late 2025. Price was approaching the $0.70 resistance zone, which aligned with prior breakdown support turned supply.

Recent candles show higher lows forming from the $0.5033 base, indicating buyers continue defending structural demand. However, the descending trend framework still caps upside attempts beneath the $0.9045 level.

A decisive reclaim of $0.70 would shift short-term structure toward expansion and could open a path toward $0.9045.

On the other hand, rejection at this level would keep the price rotating within a compression between $0.55 and $0.70. Therefore, this zone defines the structural inflection point for continuation or renewed pressure.

The Parabolic SAR has flipped below the price near $0.5497, signaling that the short-term trend direction has shifted in favor of buyers.

This flip confirms that recent downside pressure has eased compared to the prior sequence of lower highs.

At the same time, the Stochastic RSI reads 71.69 and 68.58, showing that price strength continues building toward overbought territory.

As oscillators rise above 70, upside acceleration remains intact; however, stretched readings also increase pullback probability. Still, Stochastic RSI has not yet reached extreme exhaustion levels.

As a result, buyers retain short-term control, although they must defend higher lows to prevent indicator rollover from triggering another corrective phase.

Exchange outflows persist despite recovery

Spot Netflows continue printing negative readings across multiple sessions, reflecting consistent exchange outflows even as price advances.

The latest reading shows approximately -$190.31K, extending the broader pattern of withdrawals seen throughout February.

This persistent negative netflow suggests holders continue moving tokens away from exchanges rather than preparing to distribute aggressively.

Although price recovery unfolds near $0.66, the supply available for immediate selling appears restrained. However, sustained upside requires steady demand to absorb overhead resistance near $0.70.

If outflows continue while price stabilizes above support, structural supply tightness could reinforce bullish positioning over time.

Derivatives traders increase VIRTUAL exposure aggressively

Open Interest has climbed 20.61% to $69.45 million, signaling that traders continue building leveraged positions alongside the rally.

This expansion confirms that derivatives participants actively engage rather than observing from the sidelines.

As Open Interest rises with price, speculative conviction strengthens, yet leverage expansion also increases liquidation sensitivity.

Should price secure acceptance above $0.70, long positioning could accelerate toward higher resistance zones. However, if rejection emerges, elevated leverage could amplify volatility through forced unwinds.

Thus, derivatives positioning now plays a critical role in determining whether this breakout attempt evolves into sustained upside continuation.

Breakout or renewed rejection?

VIRTUAL currently builds strength directly beneath $0.70, and this level now stands as the immediate structural barrier that must transition into support.

Price has stabilized after defending its recent base and continues pressing upward with controlled pullbacks rather than sharp rejections.

This behavior reflects absorption instead of distribution. Given the constructive structure and sustained buying pressure into resistance, the chart now favors a reclaim of $0.70.

A successful transition of this level into support would confirm a short-term trend shift and establish the foundation for further upside expansion.


Final Summary

  • VIRTUAL surged 12.53% in 24 hours as volume jumped 32.64%, signaling expanding participation across markets.
  • Price approached the critical $0.70 resistance zone within a broader descending structure.

Related Questions

QWhat was the percentage increase and new price target for VIRTUAL in the 24-hour surge?

AVIRTUAL surged 12.53% in 24 hours, pushing the price toward $0.6660.

QWhat is the critical resistance level that VIRTUAL needs to reclaim to signal a potential trend shift?

AThe critical resistance level that VIRTUAL needs to reclaim is $0.70.

QWhat did the persistent negative Netflows of approximately -$190.31K indicate about holder behavior?

AThe persistent negative Netflows indicated that holders were consistently moving tokens away from exchanges rather than preparing to sell them aggressively, suggesting a reduction in immediate selling supply.

QHow much did Open Interest increase by, and what does this signify for the market?

AOpen Interest increased by 20.61% to $69.45 million, signaling that derivatives traders were aggressively building leveraged positions and engaging with the rally, which strengthens speculative conviction.

QWhat two technical indicators were mentioned as showing a shift in favor of buyers?

AThe Parabolic SAR flipped below the price near $0.5497, signaling a shift in the short-term trend direction to buyers, and the Stochastic RSI readings of 71.69 and 68.58 showed building momentum toward overbought territory.

Related Reads

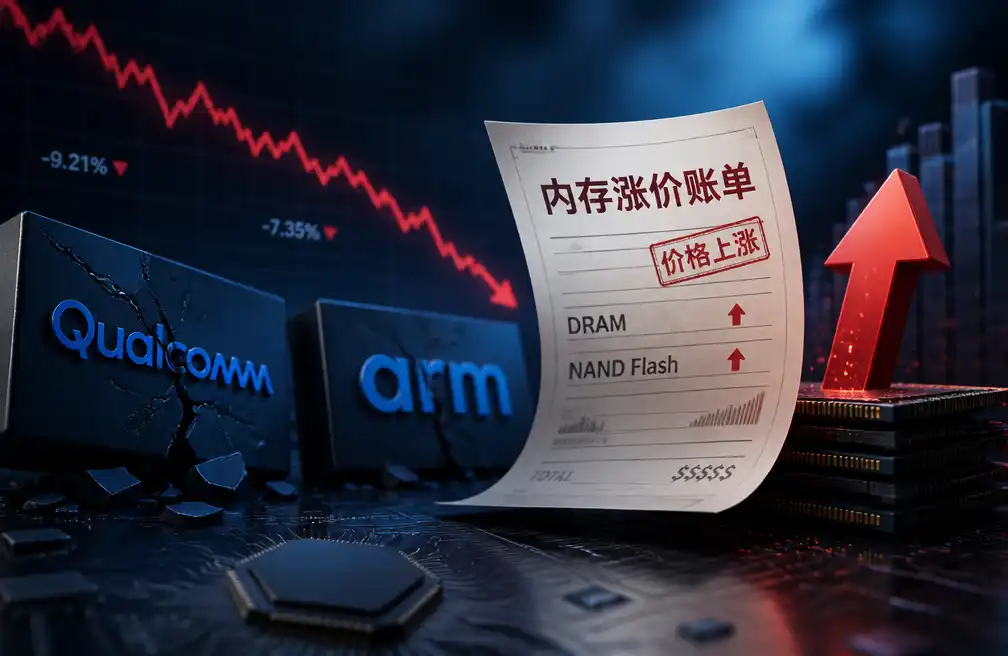
Qualcomm and Arm Fall Together: The Bill for Memory Price Hikes Finally Arrives at Mobile Chip Companies

After posting Q2 FY2026 results, Qualcomm and Arm both saw their shares decline, reflecting the impact of memory price increases on the smartphone chip sector. Qualcomm's revenue of $9.95B slightly beat expectations, but EPS of $2.21 fell short. More concerning was its guidance for next quarter, with EPS projections below analyst estimates. The company directly attributed a >$1.50 per share annual EPS headwind to rising memory costs and supply constraints in Android phones, prompting planned price hikes. While automotive revenue grew 61% and is approaching one-third of phone revenue, the mobile segment declined 20%. Qualcomm also confirmed a significant reduction in its modem share for the upcoming iPhone and outlined a plan for data center revenue to replace all Apple-related income by FY2027. Arm's results surpassed expectations with revenue of $1.29B and EPS of $0.45, and its guidance was also strong. However, its stock fell. Key concerns included royalty revenue failing to set a new record and a downward revision to full-year royalty growth guidance from ~20% to the high-teens, citing weak smartphone demand and high memory prices. Despite robust growth in its data center business, Arm's premium valuation (over 100x forward P/E) means even beating expectations isn't enough to push the stock higher, as any sign of uncertainty is magnified. Ongoing global antitrust investigations add another risk factor. The situation highlights a broader shift. Memory price surges, which boosted Samsung's profits, are now pressuring chip designers. Meanwhile, the semiconductor sector saw significant corrections in July, with the hardest-hit stocks often being those with the biggest AI-driven gains year-to-date. Qualcomm, lacking such a premium, was an exception.

marsbit16m ago

Qualcomm and Arm Fall Together: The Bill for Memory Price Hikes Finally Arrives at Mobile Chip Companies

marsbit16m ago

13 Business Lines Surpass $100 Million in Annualized Revenue, Robinhood Moves Toward a 'Super Financial App'

Robinhood Q2 2026 Earnings: Record Revenue and a Push Towards a "Super Financial App" Robinhood (HOOD) reported strong Q2 2026 results, with net revenue reaching $1.308 billion, up 32% year-over-year, and net income hitting $561 million, a 45% increase. The company now has 13 distinct business lines each generating over $100 million in annualized revenue. Key drivers included a 44% surge in transaction-based revenue to $776 million, led by a more than 10x growth in "event contracts" (prediction markets) and strong performance in stocks and options. User metrics also grew, with funded accounts rising to 28.4 million and total assets under custody reaching $369 billion. The Robinhood Gold subscription service hit a record 4.8 million users. The report highlights a strategic shift for Robinhood. Moving beyond its core as a zero-commission trading platform for retail investors, it is actively building a broader financial ecosystem. This includes expanding into wealth management (Robinhood Strategies), payments (Robinhood Credit Card), and next-generation infrastructure like AI-powered "Agentic Trading" and its own Ethereum Layer 2 blockchain, Robinhood Chain. The company's goal is to evolve from a trading app into a comprehensive "super financial app," offering a one-stop shop for investing, cash management, and future on-chain finance.

Odaily星球日报45m ago

13 Business Lines Surpass $100 Million in Annualized Revenue, Robinhood Moves Toward a 'Super Financial App'

Odaily星球日报45m ago

13 Business Lines Surpass $100 Million in Annualized Revenue, Robinhood Advances Toward a 'Super Financial App'

On July 30th, Robinhood (HOOD) reported its Q2 2026 financial results, showcasing significant growth with record revenue and profits. The company achieved a net revenue of $1.308 billion, a 32% year-over-year (YoY) increase, and a net income of $561 million, up 45% YoY. This strong performance was driven by robust trading activity and expansion into new financial services. A key highlight was the surge in transaction-based revenue, which rose 44% YoY to $776 million. Notably, income from event contracts (prediction markets) skyrocketed over 10x to $156 million, emerging as a major new growth driver alongside strong gains in stock and options trading. However, crypto trading revenue declined by 38%. Beyond trading, Robinhood is successfully diversifying its revenue streams. User assets grew 32% to $369 billion, and the subscription service Robinhood Gold reached a record 4.8 million users. The company revealed that 13 of its business lines now generate over $100 million in annualized revenue, including its new credit card, prediction markets, and Gold subscriptions. Looking forward, Robinhood is strategically investing in AI and blockchain to build a comprehensive financial ecosystem. It has launched AI-powered "Agentic Trading" and the "Robinhood Chain," a layer-2 blockchain network. The company's vision is evolving from a retail trading platform into a "super financial app" that integrates trading, wealth management, payments, and next-generation digital asset services, though regulatory hurdles remain for some new ventures.

marsbit46m ago

13 Business Lines Surpass $100 Million in Annualized Revenue, Robinhood Advances Toward a 'Super Financial App'

marsbit46m ago

Trading

Spot
活动图片