Author: Mac, Crypto Trader
Compiled by: Felix, PANews
Is technical analysis too complex to understand? Are various indicators dazzling? Mac, a crypto trader with 10 years of experience, believes that trading is "simplicity in complexity" and shares three lessons. Details below.
Most people overcomplicate trading. As someone who has spent over 10,000 hours watching charts over the past decade, this article can save you a lot of time and money: mastering some basic knowledge that people often forget can take you far in your trading journey.
After reading this article, I hope you can quickly determine whether a chart is worth buying within 3 seconds of opening it. This method applies to stocks, commodities, and cryptocurrencies. It doesn’t work well for forex, but if you’re still trading forex, you need to reevaluate your life anyway.
The Problem
Most people click buy without even looking at the chart. They hear about a stock from the news. Someone on a forum says a certain cryptocurrency is about to surge. Their friend suggests they buy. So they buy.
Then they hold these assets for up to 6 months, during which the price just fluctuates sideways, making no progress, or worse, the asset starts "bleeding." They just sit there watching their money vanish, not understanding what went wrong.
This is why index funds are so popular. Not because they are the best investment, but because most people don’t know what to look at when they open a chart. So they give up and just buy the S&P 500 index (SPY).
It’s not that technical analysis is always 100% correct, because it isn’t. But trading is about probabilities, and as a trader, your job is to do everything possible to improve your odds.
What does improving odds mean? Let me explain it in a way even a five-year-old can understand.
Rule of Thumb:
- Chart in an uptrend = Worth buying
- Chart in a sideways trend = Probably not worth buying
- Chart in a downtrend = Not worth buying
- Chart transitioning from downtrend to uptrend = Maybe worth buying
You don’t need any indicators; it all depends on market structure.
The first thing to do when opening a chart: zoom out. Switch to the weekly chart or a higher time frame (if possible). What you want to see is the actual major trend, not the noise on the 1-hour chart.
Second: observe the market structure.
What is market structure?
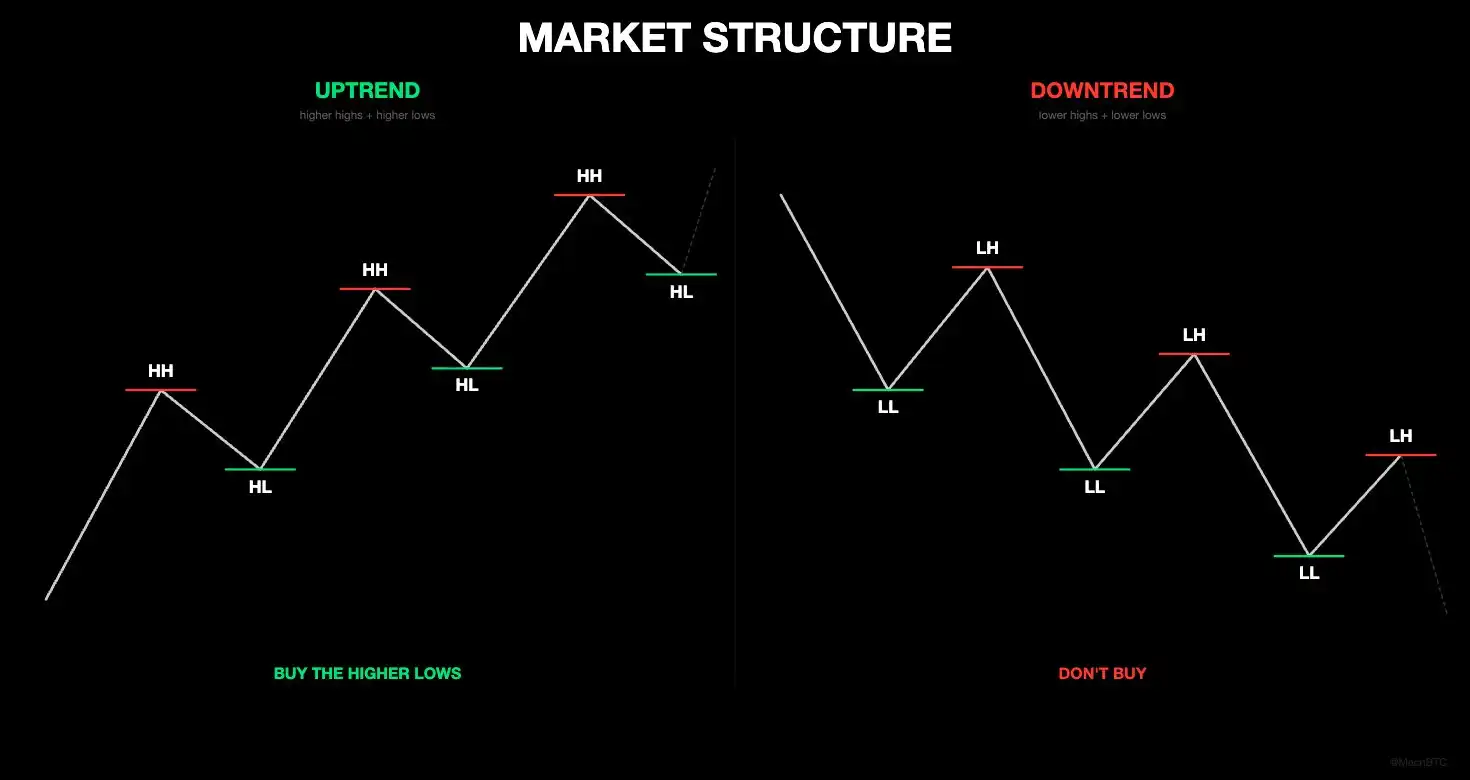
Market Structure Basics
- A chart in an uptrend continuously makes higher highs and higher lows.
- A chart in a downtrend continuously makes lower lows and lower highs.
Now, here’s the key. What does it mean when market structure "breaks"?
Imagine a candlestick chart rising, continuously making higher highs and higher lows, everything is going smoothly. Then one day, the price falls and breaks below the recent "higher low." That low is the breakout line. That was supposed to be the level where buyers step in again, but they didn’t. Sellers smashed right through it.
The same applies in reverse. A candlestick chart is in a downtrend, continuously making lower highs and lower lows. Then one day, the price breaks above the recent "lower high." Sellers were supposed to push the price down there, but they didn’t. Buyers rushed right through the resistance.
This is also a market structure breakout, but this time it’s bullish. This could be the start of a reversal.
This is absolutely the most important point you can learn from this article: when the pattern of highs and lows is broken, it means something is changing.
More practical examples:
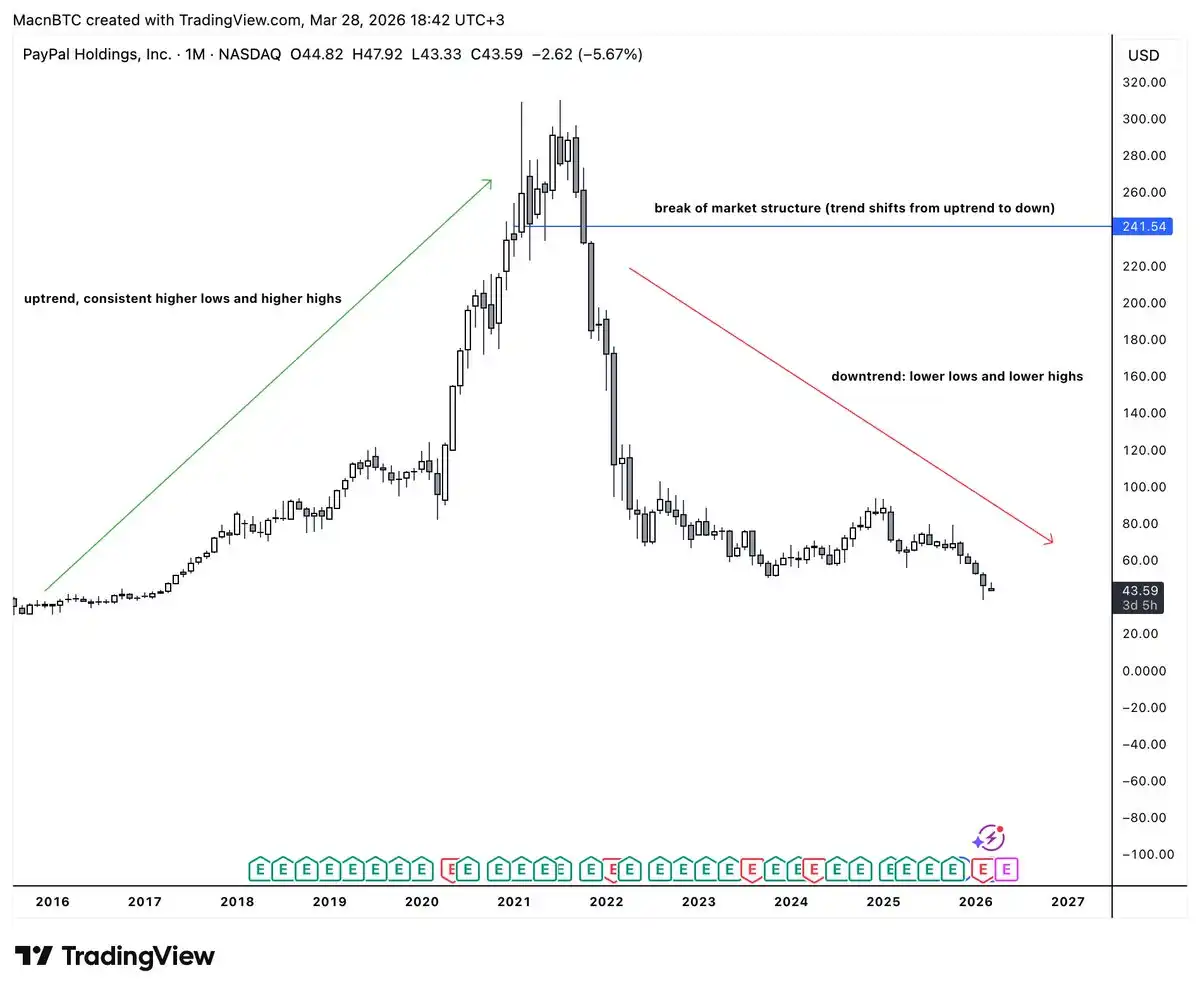
PYPL: PayPal Monthly Chart
PYPL’s monthly chart is a great example of market structure. On the left, you can see a clear uptrend. The chart is making higher lows and higher highs, and the price keeps rising.
At the peak in 2021, you can see a clear breakdown in market structure: the chart no longer makes higher highs and higher lows but instead falls below the "higher low" from 6 months prior. This "higher low" should have held, but it didn’t. Buyers lost control, and sellers took over. This is a clear market structure breakdown, indicating that we should sell and stay away from it for now. (Downtrend begins)
Now fast forward a few years to today, the chart is still continuously making lower lows. There are definitely some people saying "PYPL is undervalued, I believe in PYPL." Please, the chart shows something completely different. If you really want to believe in something, believe in God.
Next, let’s look at some more practical examples so you can understand everything and start applying it to your trading.
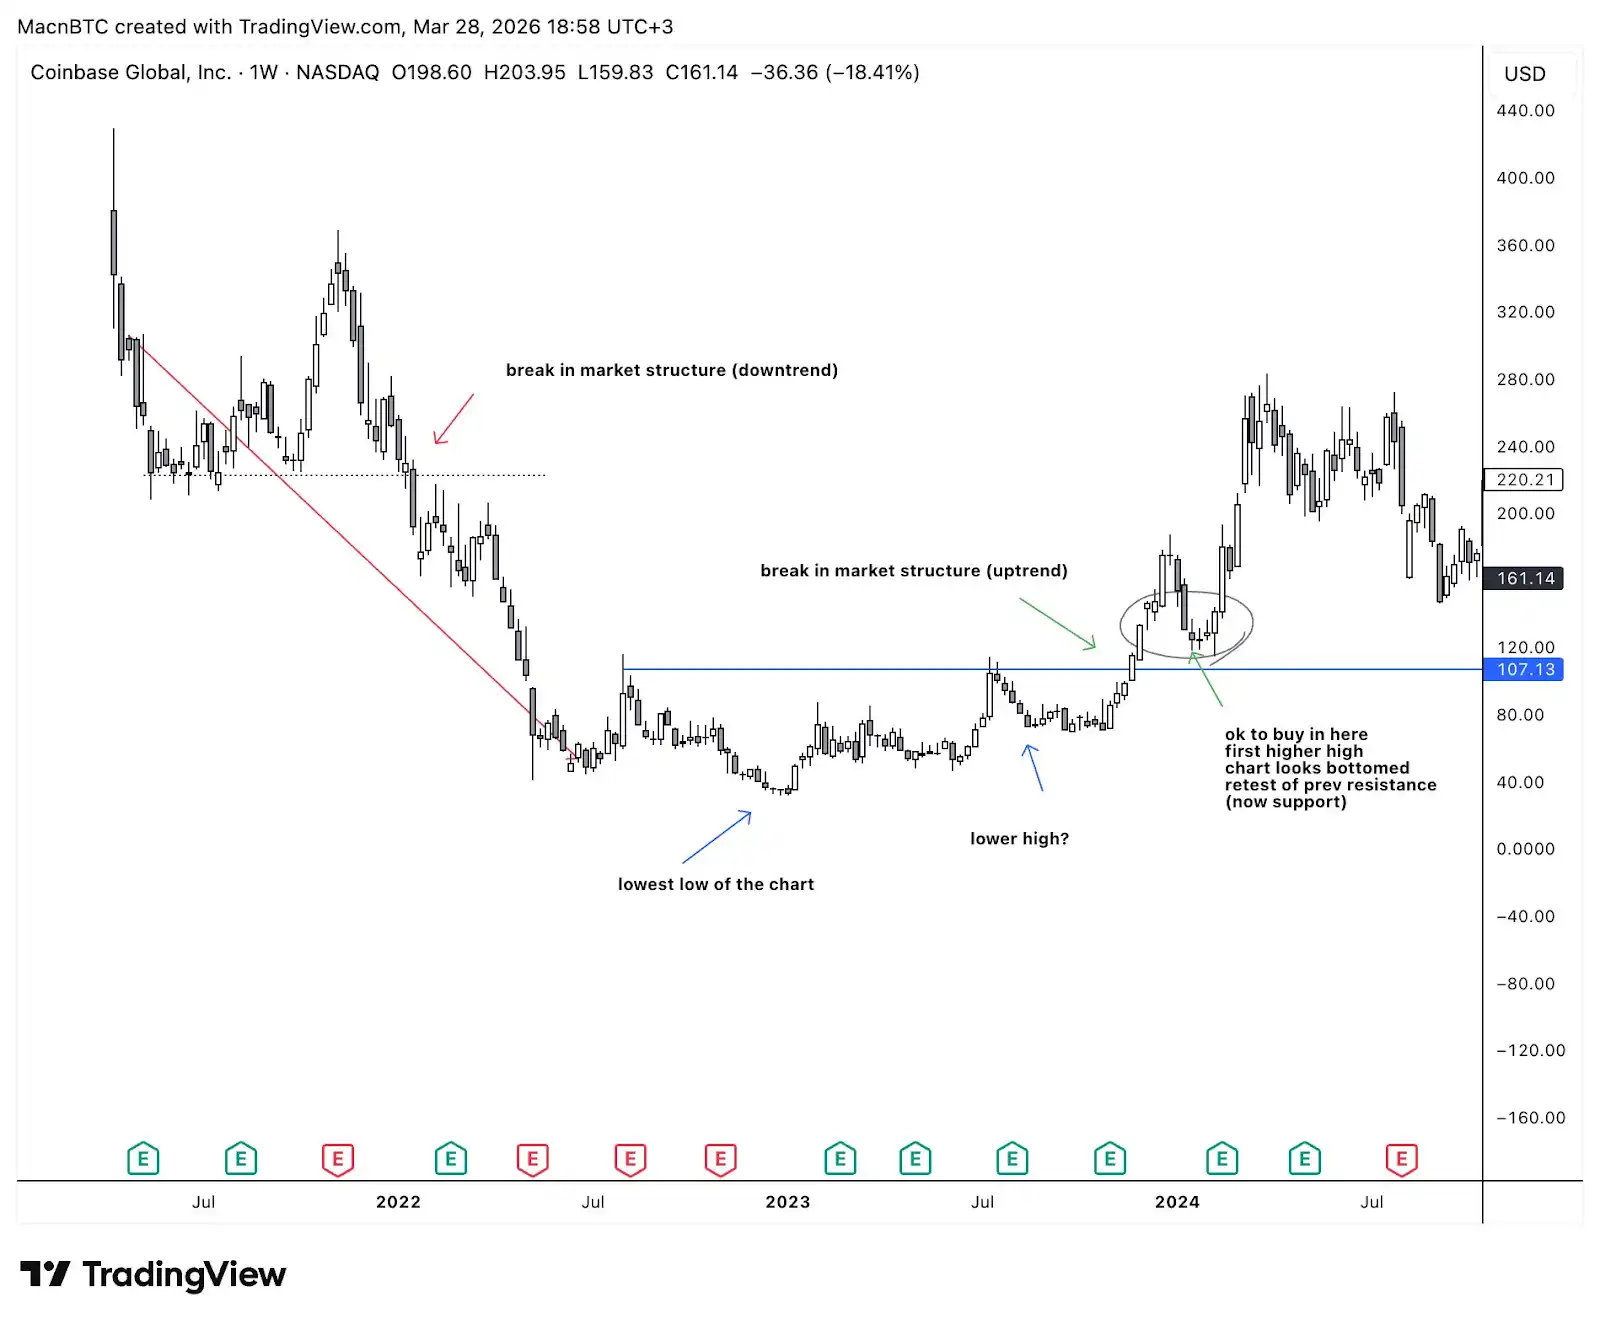
Coinbase Weekly Chart
Let’s look at the Coinbase weekly chart.
- On the left, there is a clear market structure breakdown (support break), with lower lows --> downtrend begins.
- The chart hits the lowest low, after which the price may form a lower high, then consolidate, and finally break above that lower high. This is an upward market structure breakout, forming the first higher high, confirming the uptrend.
Note the "can buy" position marked; know that you don’t have to buy early. It’s okay to buy "a bit later." In fact, it’s recommended to buy a bit later. Buying after the uptrend is confirmed is far better than buying too early and hoping the downtrend ends. I lost a lot of money before understanding this, so don’t make the same mistake.
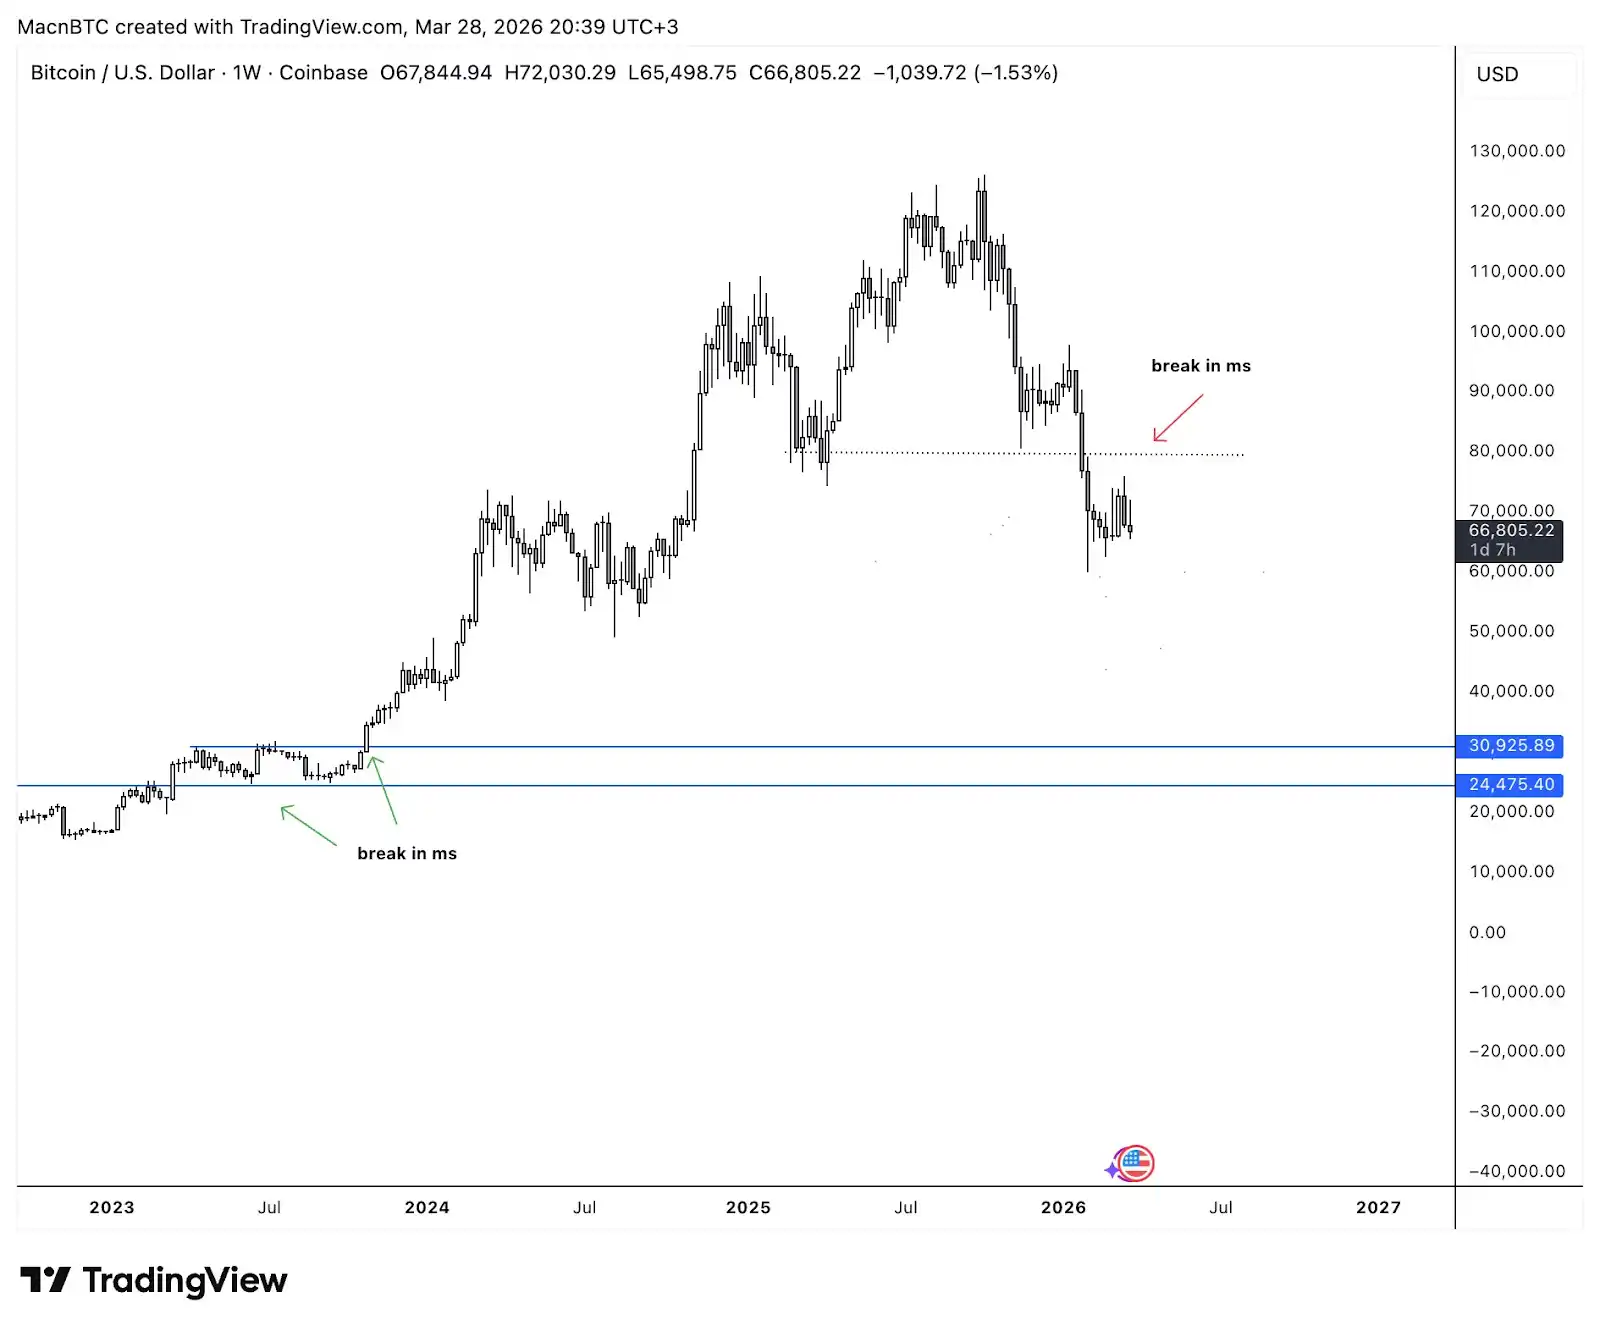
BTC 2023-2026
Let’s look at the Bitcoin price. In this example, you can see both bullish and bearish market structure breakouts.
In 2023, Bitcoin price hovered between $15,000 and $20,000, continuously making lower highs and lower lows. Almost everyone said "crypto is dead." Then the price broke above the previous "lower high" around $25,000 (green arrow on the chart). This breakout changed everything. Since then, it has been making higher highs and higher lows, soaring all the way to $125,000. Note that even if you enter "late," you can still make money. You don’t need to buy at the bottom of $15,000; just see the structural reversal around $25,000 to $30,000 and then buy. Even if you are a few weeks or even months late, you can still profit.
Now look at the right side. Bitcoin price peaked around $125,000, then started forming lower highs. Then the price fell below a "higher low" around $85,000 to $90,000 (red arrow on the chart), and the structure was just broken downward. The current price is around $66,000.
Of course, I’m not saying Bitcoin will drop to zero, but looking at this chart, it’s clear that the trend has turned bearish. The best-case scenario is a return above the breakdown level, but until then, boring sideways consolidation and torturous price action will be the main theme (even worse than the current situation).
Let’s look at more examples.
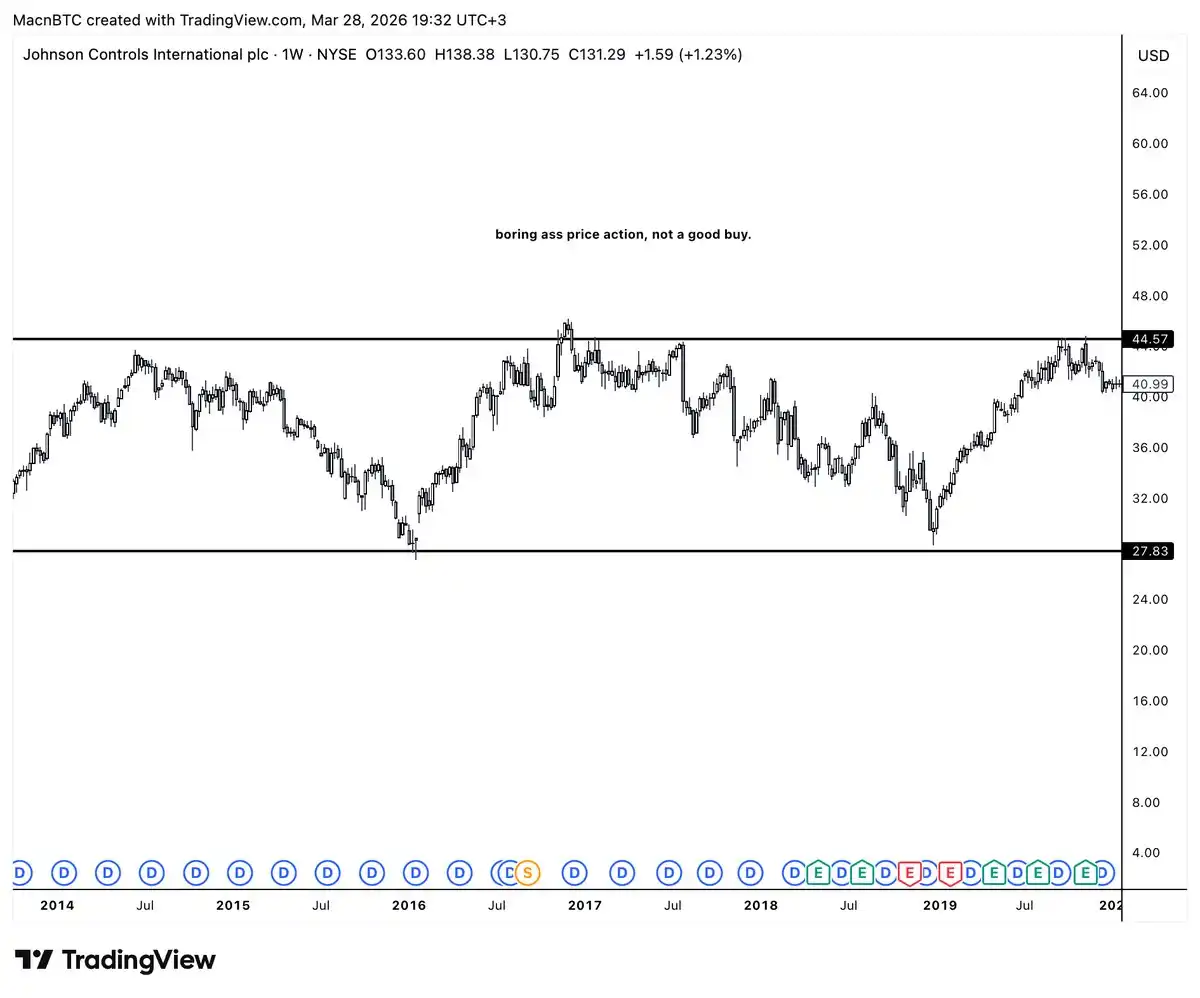
Boring Chart
Here’s a chart that has done nothing for over five years. The same sideways consolidation, no market structure breakout at all, just boring sideways movement. Don’t buy a chart that looks like this; you might as well take your money to Las Vegas and bet it all on a dark horse.
To succeed, remember these three points:
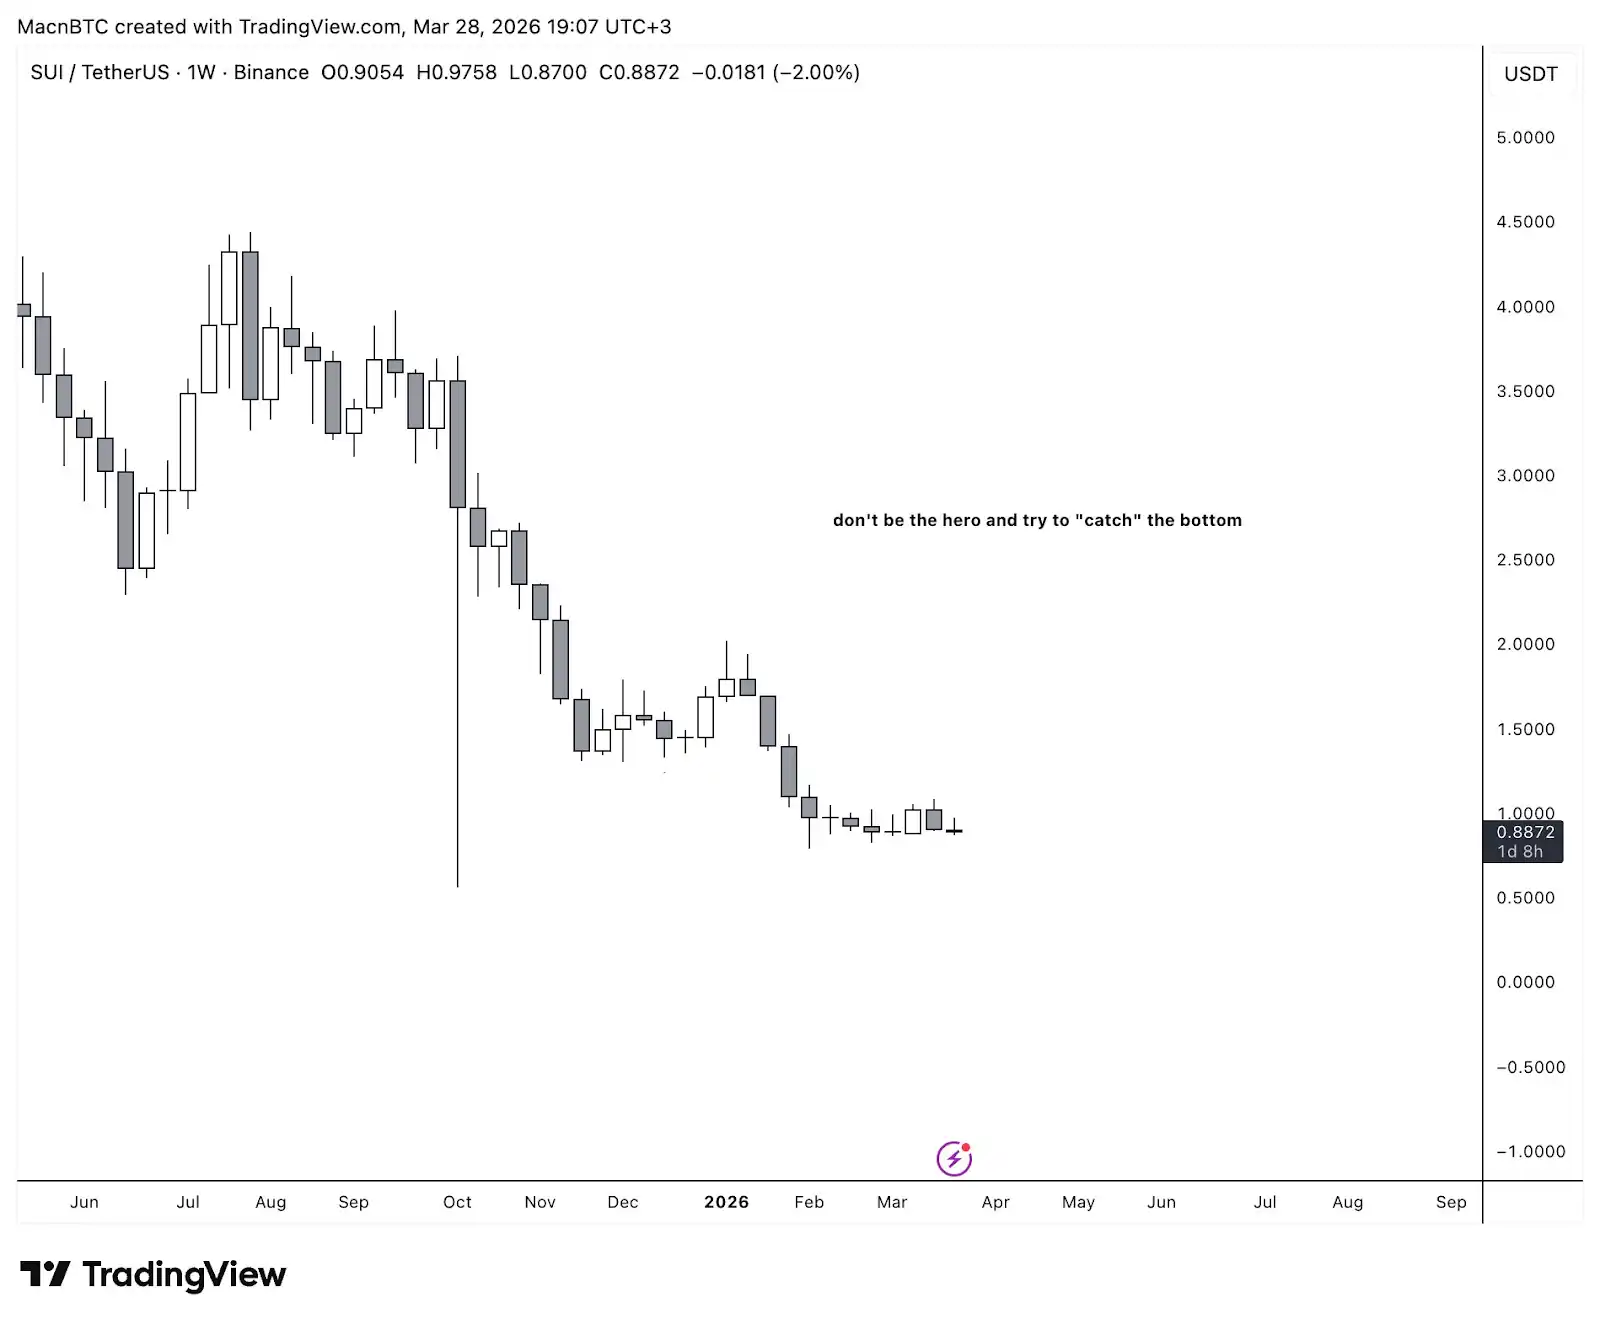
"Shitcoin"
Lesson 1: Don’t try to be a hero and "buy the bottom." This will cost you a lot of money and energy. If it’s a confirmed downtrend with no rebound strength, the best thing to do is sell, cut losses, and look for another target. I used to be that person, holding positions for months while they kept falling, just because I firmly believed "this is the bottom." It wasn’t the bottom. The chart kept making lower lows; I just refused to admit it. If the structure shows it’s falling, it’s falling. Get out.
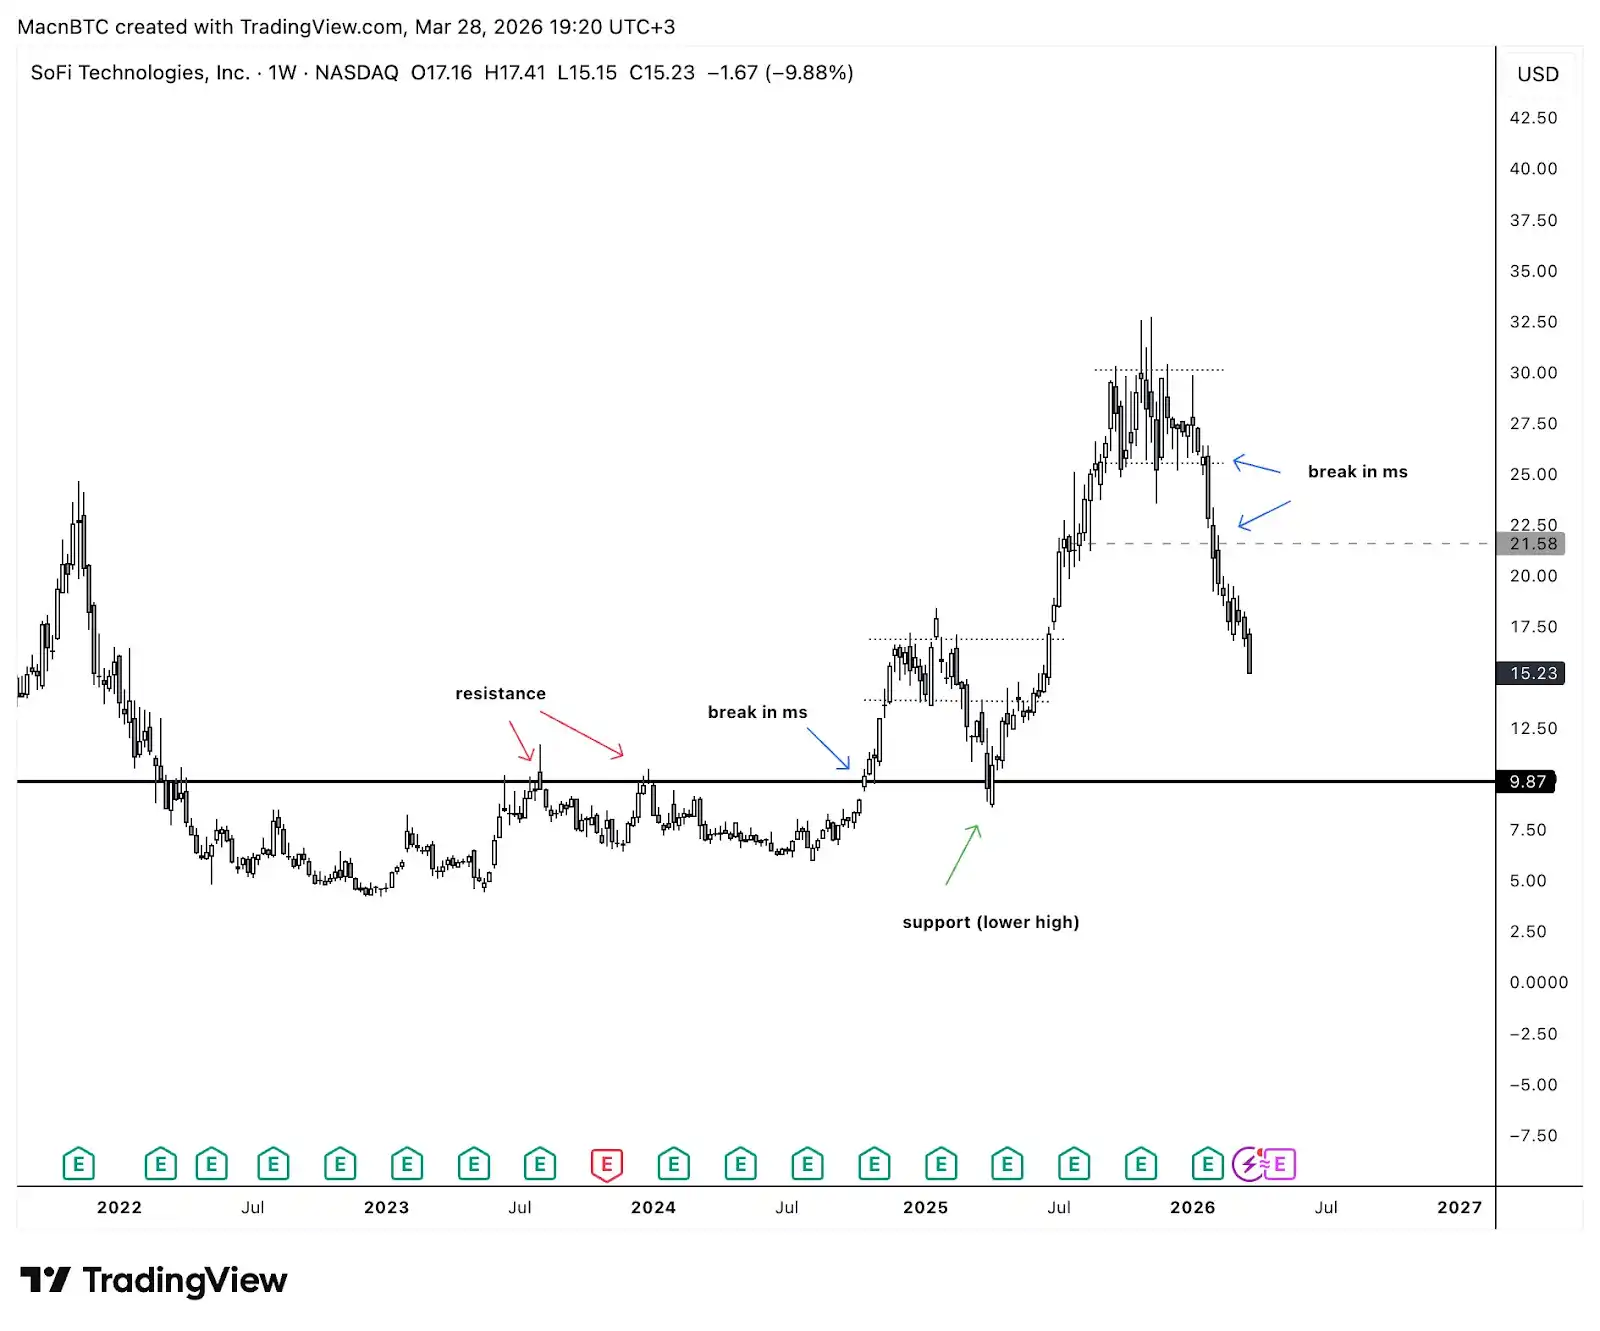
All Good Things Must Come to an End
Lesson 2: The market will deceive you over and over again. If the market structure has just turned bullish and you’re worried you bought at the top, I have only one suggestion: zoom out. Switching to a higher time frame helps you better control your emotions and avoid making stupid buys and sells due to emotional impulses. I can’t count how many times I panicked on the 4-hour chart, then zoomed out to the weekly chart and realized nothing had changed. The structure was still intact; I was just watching too closely. This is where fundamental analysis comes in handy. If the fundamentals or market narrative support your technical analysis, you’re likely making a good trade.
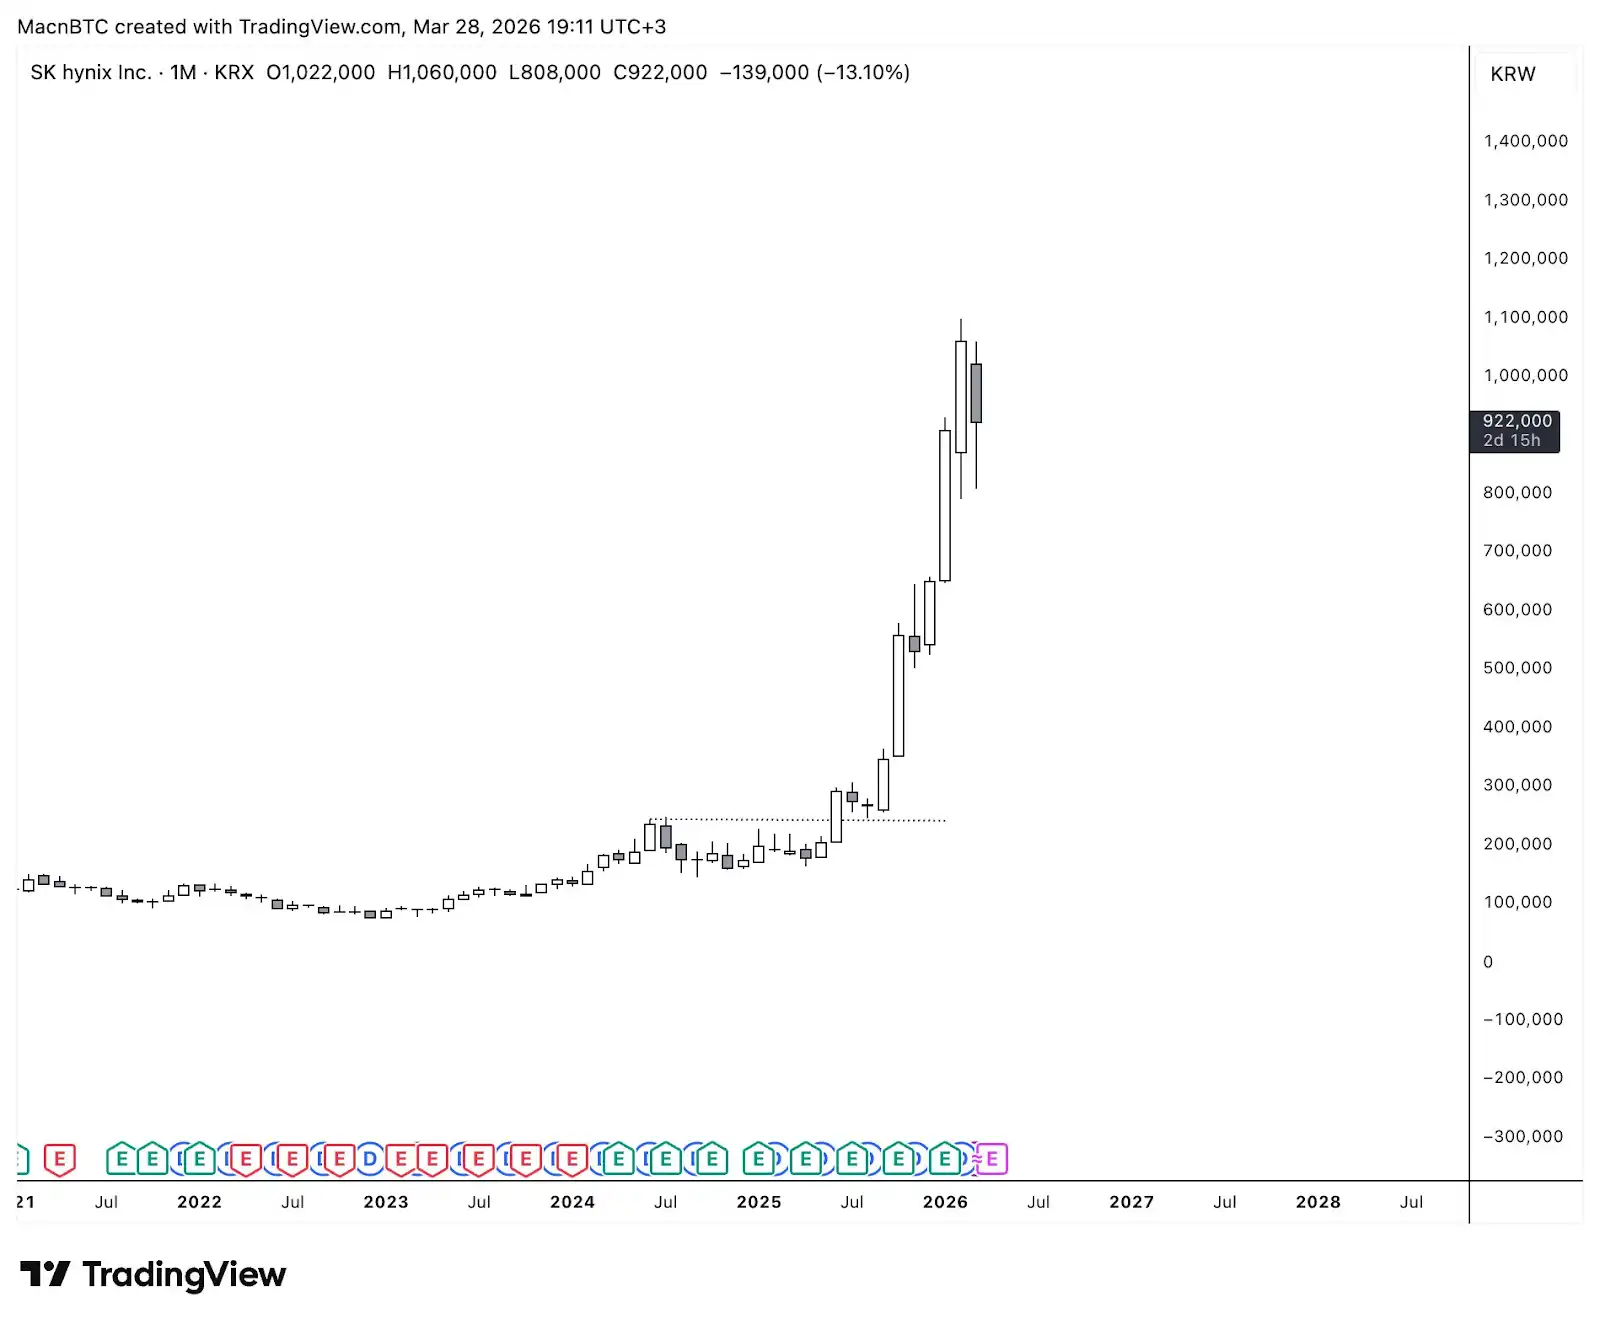
Hynix’s Bull Run
Lesson 3: It’s okay to enter late, but not too late. At this point, you might ask: How do I know if I’m too late? Well, the answer is it’s hard to say. It takes years of experience with candlestick charts to tell, and even after years, you’ll still make mistakes. Technical analysis can only take you so far; if you combine it with news/narrative analysis and fundamental analysis, you’ll go further. A good rule of thumb is: If the chart has already made 3-4 higher highs and higher lows on a high-level time frame like two weeks or monthly, and the price is far above the structural change point, you’ve probably missed the best opportunity. This isn’t always the case, but it’s likely. Instead of chasing a move that has already happened, wait for a pullback to form a "higher low" before entering.
Summary
- Chart in an uptrend = Worth buying
- Chart in a sideways trend = Probably not worth buying
- Chart in a downtrend = Not worth buying
- Chart transitioning from downtrend to uptrend = Maybe worth buying
3 Lessons:
- Don’t try to be a hero and buy the bottom
- Trust your analysis
- It’s okay to enter late, but not too late
Related reading: Starting from $100, Deconstructing the Three Dimensions and Five Levels of Trader Advancement