Ethereum Exchange Deposits Hit A Six-Month High: Panic Selling Or Structural Reset?

bitcoinistPublished on 2026-02-26Last updated on 2026-02-26

Abstract

Ethereum is experiencing sustained selling pressure amid a broader shift toward caution and panic in crypto markets. A key on-chain metric shows the number of unique deposit addresses to Binance surged to a six-month high, rising from 360,000 to over 450,000. This often signals potential selling intent, as assets moved to exchanges are easier to liquidate. However, such spikes can also reflect hedging, margin replenishment, or derivatives activity rather than outright selling. The increase coincides with a sharp price decline from October's peak near $4,900 to around $1,900. This may indicate retail capitulation or traders adding collateral to avoid liquidations. While elevated deposits raise near-term volatility and selling risk, such spikes have historically occurred near market bottoms. Technically, ETH is testing key support near $1,900 and the 200-week moving average—a level critical for medium-term direction. The market remains fragile, with resistance overhead and volume patterns suggesting distribution rather than accumulation. A breakdown below support could lead to further declines, while stabilization may signal accumulation. Confirmation of a reversal requires reclaiming resistance levels and improved market participation.

Ethereum continues to face sustained selling pressure as broader crypto market sentiment shifts toward caution and, in some segments, outright panic. Price action has struggled to regain stability in recent weeks, with repeated rebound attempts failing to produce sustained upside momentum. Elevated volatility, tightening liquidity conditions, and persistent macro uncertainty have reinforced a defensive posture among both retail and institutional participants, leaving Ethereum vulnerable to further short-term weakness.

A recent CryptoQuant report provides additional context through on-chain activity. According to the data, the ETH Binance User Deposit Address metric has recorded a sharp increase. The number of unique addresses depositing Ethereum to Binance has surged from roughly 360,000 to more than 450,000, representing the highest level observed since August 2025. Metrics tracking deposit addresses often serve as a proxy for potential sell-side intent, since assets transferred to exchanges are typically more accessible for liquidation, collateral usage, or portfolio rebalancing.

However, such spikes do not automatically translate into immediate selling. In some cases, they reflect positioning adjustments, hedging activity, or preparation for derivatives trading. Even so, the scale of the recent increase suggests heightened market anxiety and warrants close monitoring as Ethereum navigates an increasingly fragile market environment.

Exchange Deposits Surge As Price Correction Deepens

The report highlights that this metric breakout has occurred alongside a severe price correction. Ethereum has declined sharply from its October peak near $4,900 to roughly the $1,900 region. The simultaneous drop in price and surge in exchange deposit addresses suggests two primary on-chain interpretations that merit careful consideration.

Ethereum Binance User Deposit Address | Source: CryptoQuant

The first scenario points to retail capitulation. A rapid increase in unique depositing addresses often reflects panic behavior among smaller investors. Participants who held through earlier stages of the decline may now be transferring assets to exchanges to exit positions, reinforcing short-term sell-side pressure.

The second interpretation relates to derivatives market positioning. With ETH trading below the $2,000 threshold, some deposits likely represent collateral replenishment. Traders facing liquidation risk may be adding margin to maintain leveraged long positions rather than outright selling their holdings.

In the near term, increased deposits elevate potential supply on exchanges, which can intensify volatility if selling materializes. However, historically, extreme spikes in deposit activity have frequently appeared during late-stage corrective phases. Such conditions sometimes precede seller exhaustion.

Monitoring exchange outflows, spot volume absorption, and derivatives positioning will be critical to determine whether this activity signals continued downside risk or the early formation of a local market bottom.

Ethereum Tests Structural Support As Downtrend Persists

Ethereum continues to trade under sustained pressure, with the weekly chart showing a clear loss of bullish momentum following the rejection near the $4,800–$5,000 region. Price has now retraced toward the $1,900 area, a zone that previously acted as consolidation support during earlier cycle phases. The inability to hold above the mid-cycle moving averages suggests that sellers still maintain structural control.

ETH testing critical price level | Source: ETHUSDT chart on TradingView

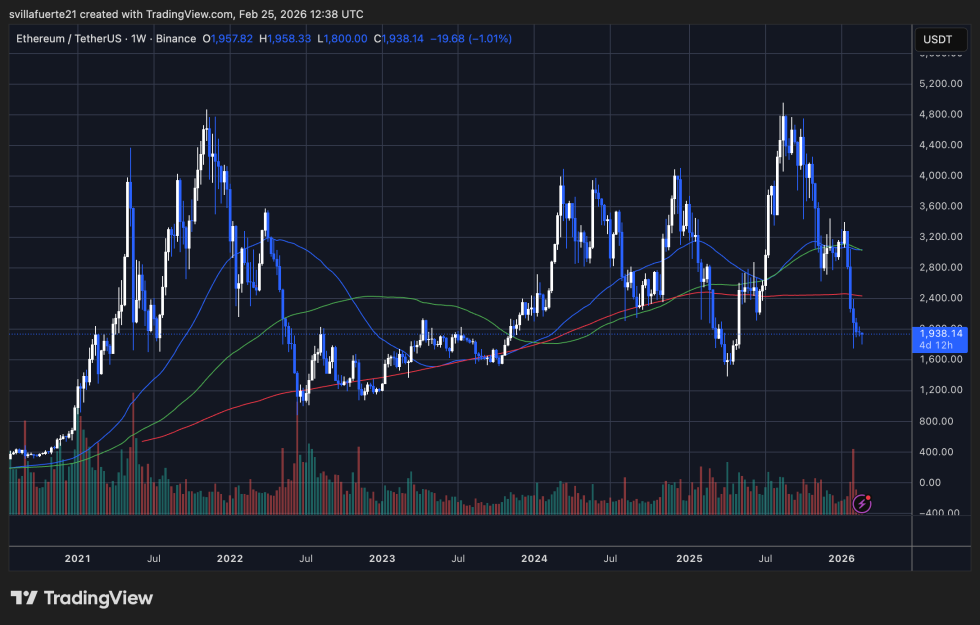
The 50-week moving average has rolled over and now acts as overhead resistance, while the 100-week average appears to be flattening. Meanwhile, price is approaching the longer-term 200-week moving average, a level historically associated with major cyclical support. A decisive breakdown below this region could expose deeper downside, whereas stabilization here may encourage medium-term accumulation.

Volume patterns indicate intermittent spikes during declines, which typically reflect distribution rather than sustained buying interest. This reinforces the interpretation of a defensive market phase rather than a confirmed recovery trend.

Despite the weakness, volatility compression near long-term averages sometimes precedes transitional periods. Confirmation, however, would require sustained closes above reclaimable resistance levels and improving participation metrics. Until then, Ethereum remains in a fragile technical posture with risk skewed toward continued consolidation or downside drift rather than immediate bullish continuation.

Featured image from ChatGPT, chart from TradingView.com

Related Questions

QWhat does the sharp increase in Ethereum Binance User Deposit Addresses suggest about market sentiment?

AThe sharp increase in Ethereum Binance User Deposit Addresses, which surged from roughly 360,000 to over 450,000, suggests heightened market anxiety and potential sell-side intent, as assets moved to exchanges are often more accessible for liquidation or portfolio rebalancing.

QWhat are the two primary on-chain interpretations for the simultaneous drop in Ethereum's price and surge in exchange deposits?

AThe two primary interpretations are: 1) Retail capitulation, where smaller investors panic and transfer assets to exchanges to exit positions, and 2) Derivatives market positioning, where traders deposit ETH as collateral to maintain leveraged long positions amid liquidation risks.

QWhat critical support level is Ethereum approaching on the weekly chart, and why is it significant?

AEthereum is approaching the 200-week moving average, a level historically associated with major cyclical support. A breakdown below this could expose deeper downside, while stabilization here might encourage medium-term accumulation.

QHow do volume patterns during Ethereum's decline reinforce the current market phase?

AVolume patterns show intermittent spikes during declines, which typically reflect distribution rather than sustained buying interest, reinforcing the interpretation of a defensive market phase rather than a confirmed recovery trend.

QWhat factors will be critical to determine whether the increased deposit activity signals continued downside risk or a potential market bottom?

AMonitoring exchange outflows, spot volume absorption, and derivatives positioning will be critical to determine if this activity signals continued downside risk or the early formation of a local market bottom.

Related Reads

US Stocks Suffer Worst Plunge Since 2025: Three Triggers Ignite Tech Stock Valuation Reset

The US stock market experienced its most severe sell-off since the 2025 tariff crisis on June 5th, 2025. The Nasdaq Composite plummeted 4.18%, the S&P 500 fell 2.64%, and the Dow Jones dropped 695 points. The panic stemmed from three converging factors. First, Broadcom's earnings report ignited fears of a slowdown in AI growth. While its AI chip revenue surged 143% YoY to $10.8B, its Q3 AI revenue guidance of $16B fell short of the $17.2B consensus. This triggered a massive sector-wide sell-off, with the Philadelphia Semiconductor Index crashing 10.26% and semiconductor stocks losing roughly $1.3 trillion in market value in a single day. Second, a shockingly strong May jobs report crushed hopes for Federal Reserve rate cuts. Non-farm payrolls added 172,000 jobs, doubling expectations. This robust data, combined with persistently high oil prices above $92/barrel due to the ongoing Iran war and blockade of the Strait of Hormuz, drastically increased market expectations for a potential Fed rate hike instead of a cut. Higher interest rates compress the valuations of growth-heavy tech stocks. Third, the prolonged Iran conflict continues to fuel inflationary pressures, complicating the Fed's policy decisions and undermining the "inflation is tamed" narrative. Together, these events challenged the twin pillars of the market rally: the "limitless AI growth" story and expectations for imminent monetary easing. The sell-off spread globally, impacting Asian and European markets and cryptocurrencies. The article posits this is likely a severe "valuation repricing" rather than the end of the AI story. The underlying demand for AI remains strong, but investor expectations for growth speed and the prices they are willing to pay are being recalibrated. Key upcoming factors include the June FOMC meeting, future AI company earnings, and developments in the Iran conflict.

marsbit3h ago

US Stocks Suffer Worst Plunge Since 2025: Three Triggers Ignite Tech Stock Valuation Reset

marsbit3h ago

From Madison Square Garden to Kalshi: Prediction Markets Break into the NBA Finals

From Madison Square Garden to Kalshi: Prediction Markets Break into the NBA Finals Prediction markets are playing a significant role in the 2026 NBA Finals, particularly around the New York Knicks' unexpected 2-0 series lead. Platforms like Kalshi and Polymarket have seen massive trading volumes, exceeding hundreds of millions of dollars on championship and related markets. Their influence extends beyond online trading. Kalshi's official partnership with Madison Square Garden has given it prominent physical branding at the arena. Furthermore, local businesses like The Jeffrey bar are using prediction market contracts to hedge the risk of game-result-based promotions, turning potential losses into manageable costs—a concept similar to the famous "Mattress Mack" strategy from traditional sports betting. These markets differentiate themselves by offering a wider, more entertainment-focused range of "event contracts" beyond typical game outcomes, such as predicting celebrity attendance. They also have broader accessibility across the U.S. compared to age- and location-restricted traditional sportsbooks. However, their rapid integration into sports raises regulatory and ethical questions. The NBA is cautiously engaging, discussing integrity frameworks with regulators like the CFTC. While the league permits minor investments like Giannis Antetokounmpo's stake in Kalshi, it advocates for strict rules to prevent insider trading. Many fans express concern on platforms like Reddit, fearing that the close ties between prediction markets, the league, and players could compromise the game's integrity. The NBA Finals has thus become a high-stakes testing ground, showcasing prediction markets' commercial potential while challenging traditional boundaries between financial trading, entertainment, and gambling.

marsbit6h ago

From Madison Square Garden to Kalshi: Prediction Markets Break into the NBA Finals

marsbit6h ago

Recursive Self-Improvement AI Gains Traction, Google Pours Cold Water, While DeepSeek and Others Approach the Fringes

The term "recursive self-improvement" (RSI), where AI improves itself autonomously, is gaining momentum in the AI industry. Startups like Recursive Superintelligence and projects such as Andrej Karpathy's Auto-Research aim to create systems where AI designs, implements, and validates its own research, moving toward superintelligence. While Google CEO Sundar Pichai cautions that such exponential acceleration is not yet a reality, progress is evident. For instance, Anthropic reported its Claude Code writes nearly 100% of the team's code, though it still lacks true self-direction. Analysts frame RSI development in stages: "adequacy" (systems functioning without humans), "parity" (matching human research quality), and "supremacy" (exceeding human-AI collaboration). Reaching parity could trigger rapid, unpredictable advancement due to AI's continuous operation. In China, companies like DeepSeek and Baidu incorporate self-optimization techniques without explicitly branding them as RSI, focusing on algorithmic efficiency and reinforcement learning. However, challenges remain, including "model collapse" from training on AI-generated data and the immense computational and open-collaboration requirements. Ultimately, RSI represents a trend of increasing automation in AI development, potentially reducing human oversight in the creation process itself.

marsbit6h ago

Recursive Self-Improvement AI Gains Traction, Google Pours Cold Water, While DeepSeek and Others Approach the Fringes

marsbit6h ago

Trading

Spot
Futures

Hot Articles

Discussions

Welcome to the HTX Community. Here, you can stay informed about the latest platform developments and gain access to professional market insights. Users' opinions on the price of ETH (ETH) are presented below.

活动图片