Ethereum Classic has joined the list of cryptocurrencies posting double-digit gains, pushing its price to about $9.03 at press time.
The asset’s renewed momentum has drawn fresh market attention and redirected capital allocation toward the altcoin. Broader market analysis suggests the upside trend may persist, although its continuation depends on whether investor demand and capital inflows remain strong.
For now, sentiment across several indicators suggests that traders remain optimistic as the rally unfolds.
Investor appetite strengthens
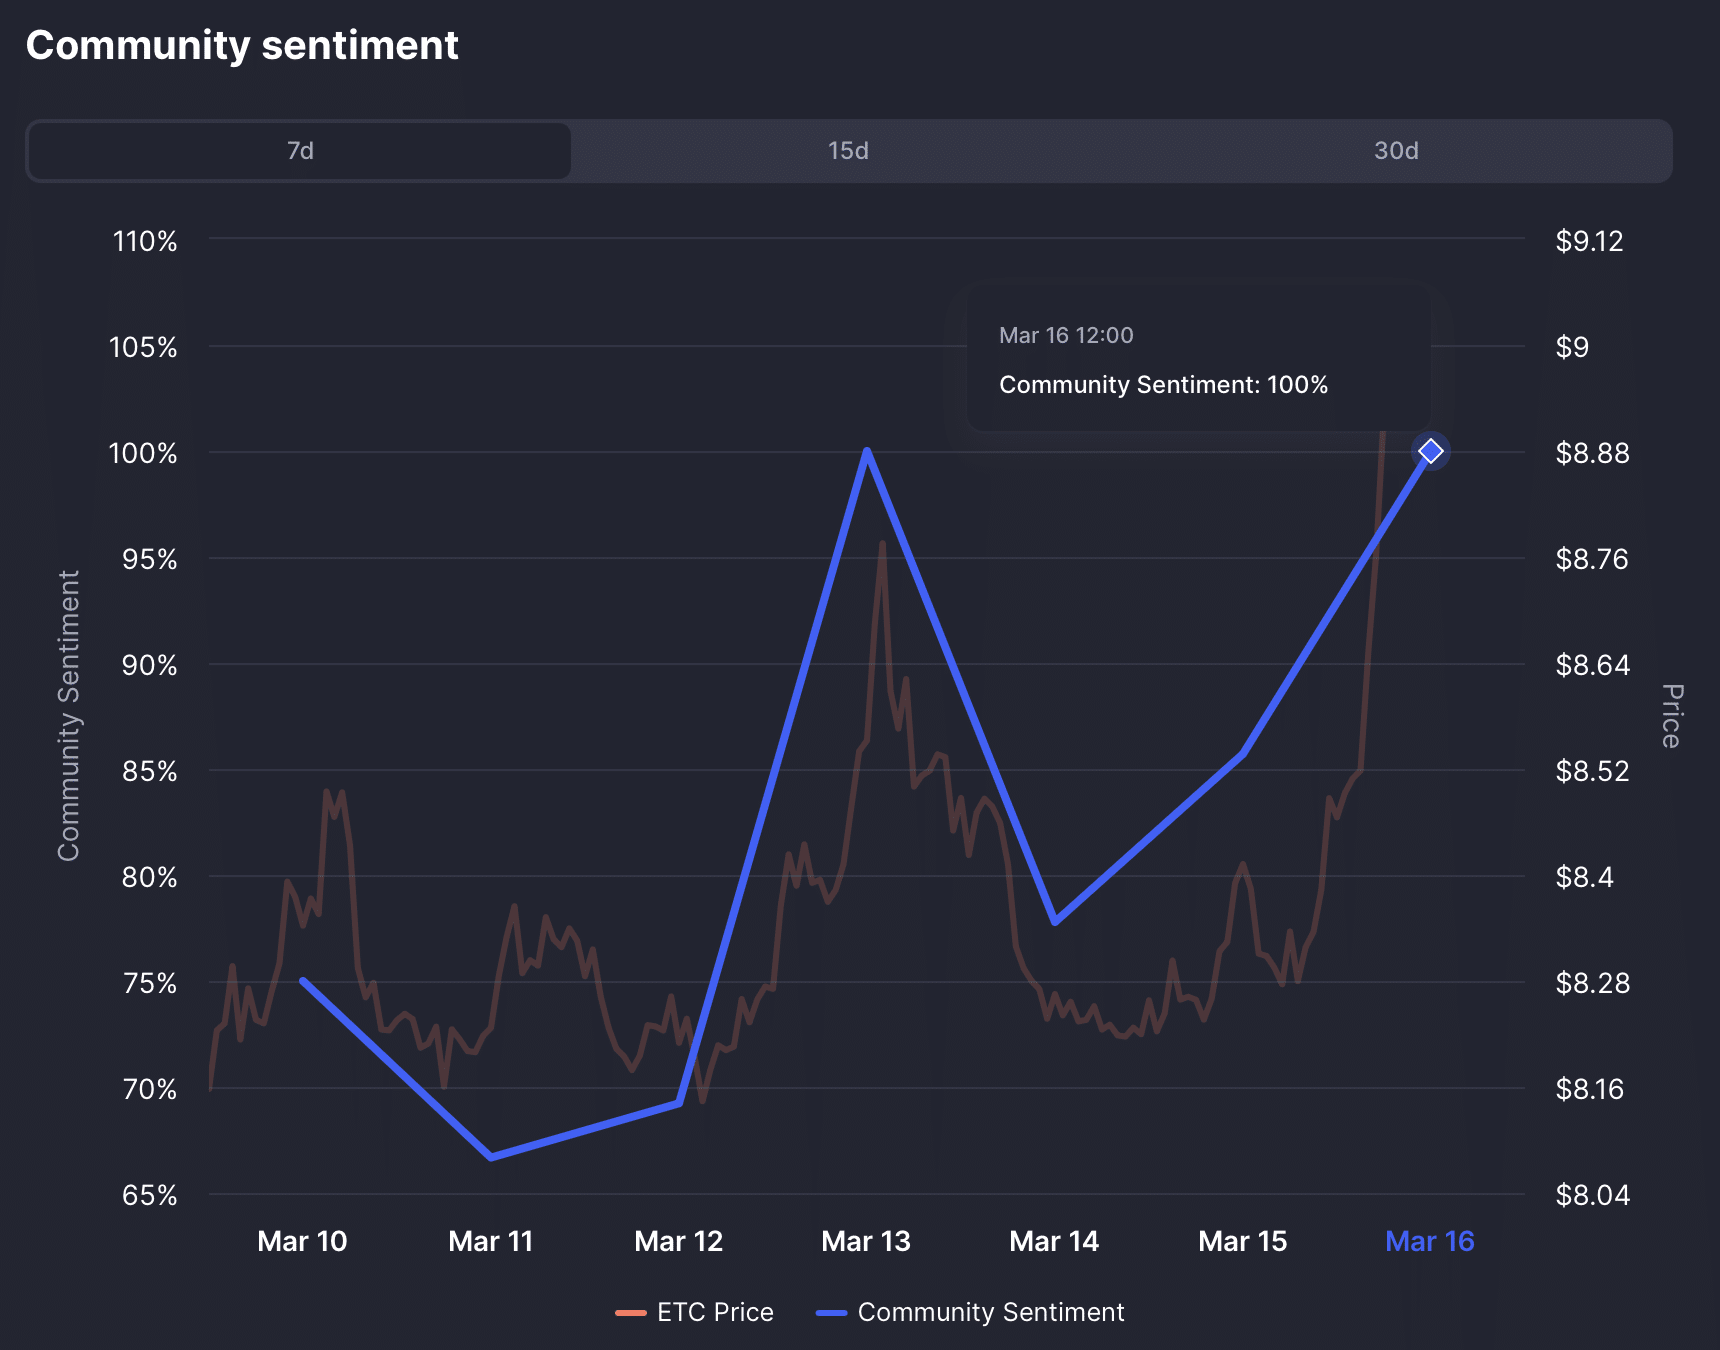
Investor appetite for Ethereum Classic [ETC] has increased sharply, according to sentiment data from CoinMarketCap.
The indicator, which aggregates community votes to track whether traders are bullish or bearish, showed that 100% of roughly 4.3 million participants expected further upside for ETC.
Google search data also pointed to a gradual rise in public interest.

Data from Google Trends showed that search interest for Ethereum Classic’s ticker has increased by 10 points, rising from 32 on the 15th of March, which marked the lowest level recorded this year.
Although the increase remained modest, sustained growth in search activity could translate into broader market attention. Higher visibility often precedes stronger capital allocation as more traders begin to track and participate in the asset’s movement.
Breakout places higher levels in focus
AMBCrypto’s analysis suggested that the rally may still have room to extend if current momentum holds. Based on the chart structure ETC recently exited, an additional 11% to 30% price expansion remains possible.
The formation resembles a bullish consolidation pattern, where price trades within a tightening range defined by a horizontal support level and a descending resistance line.
Such structures typically reflect a period of accumulation before price breaks out and attempts to reclaim the start of the pattern.

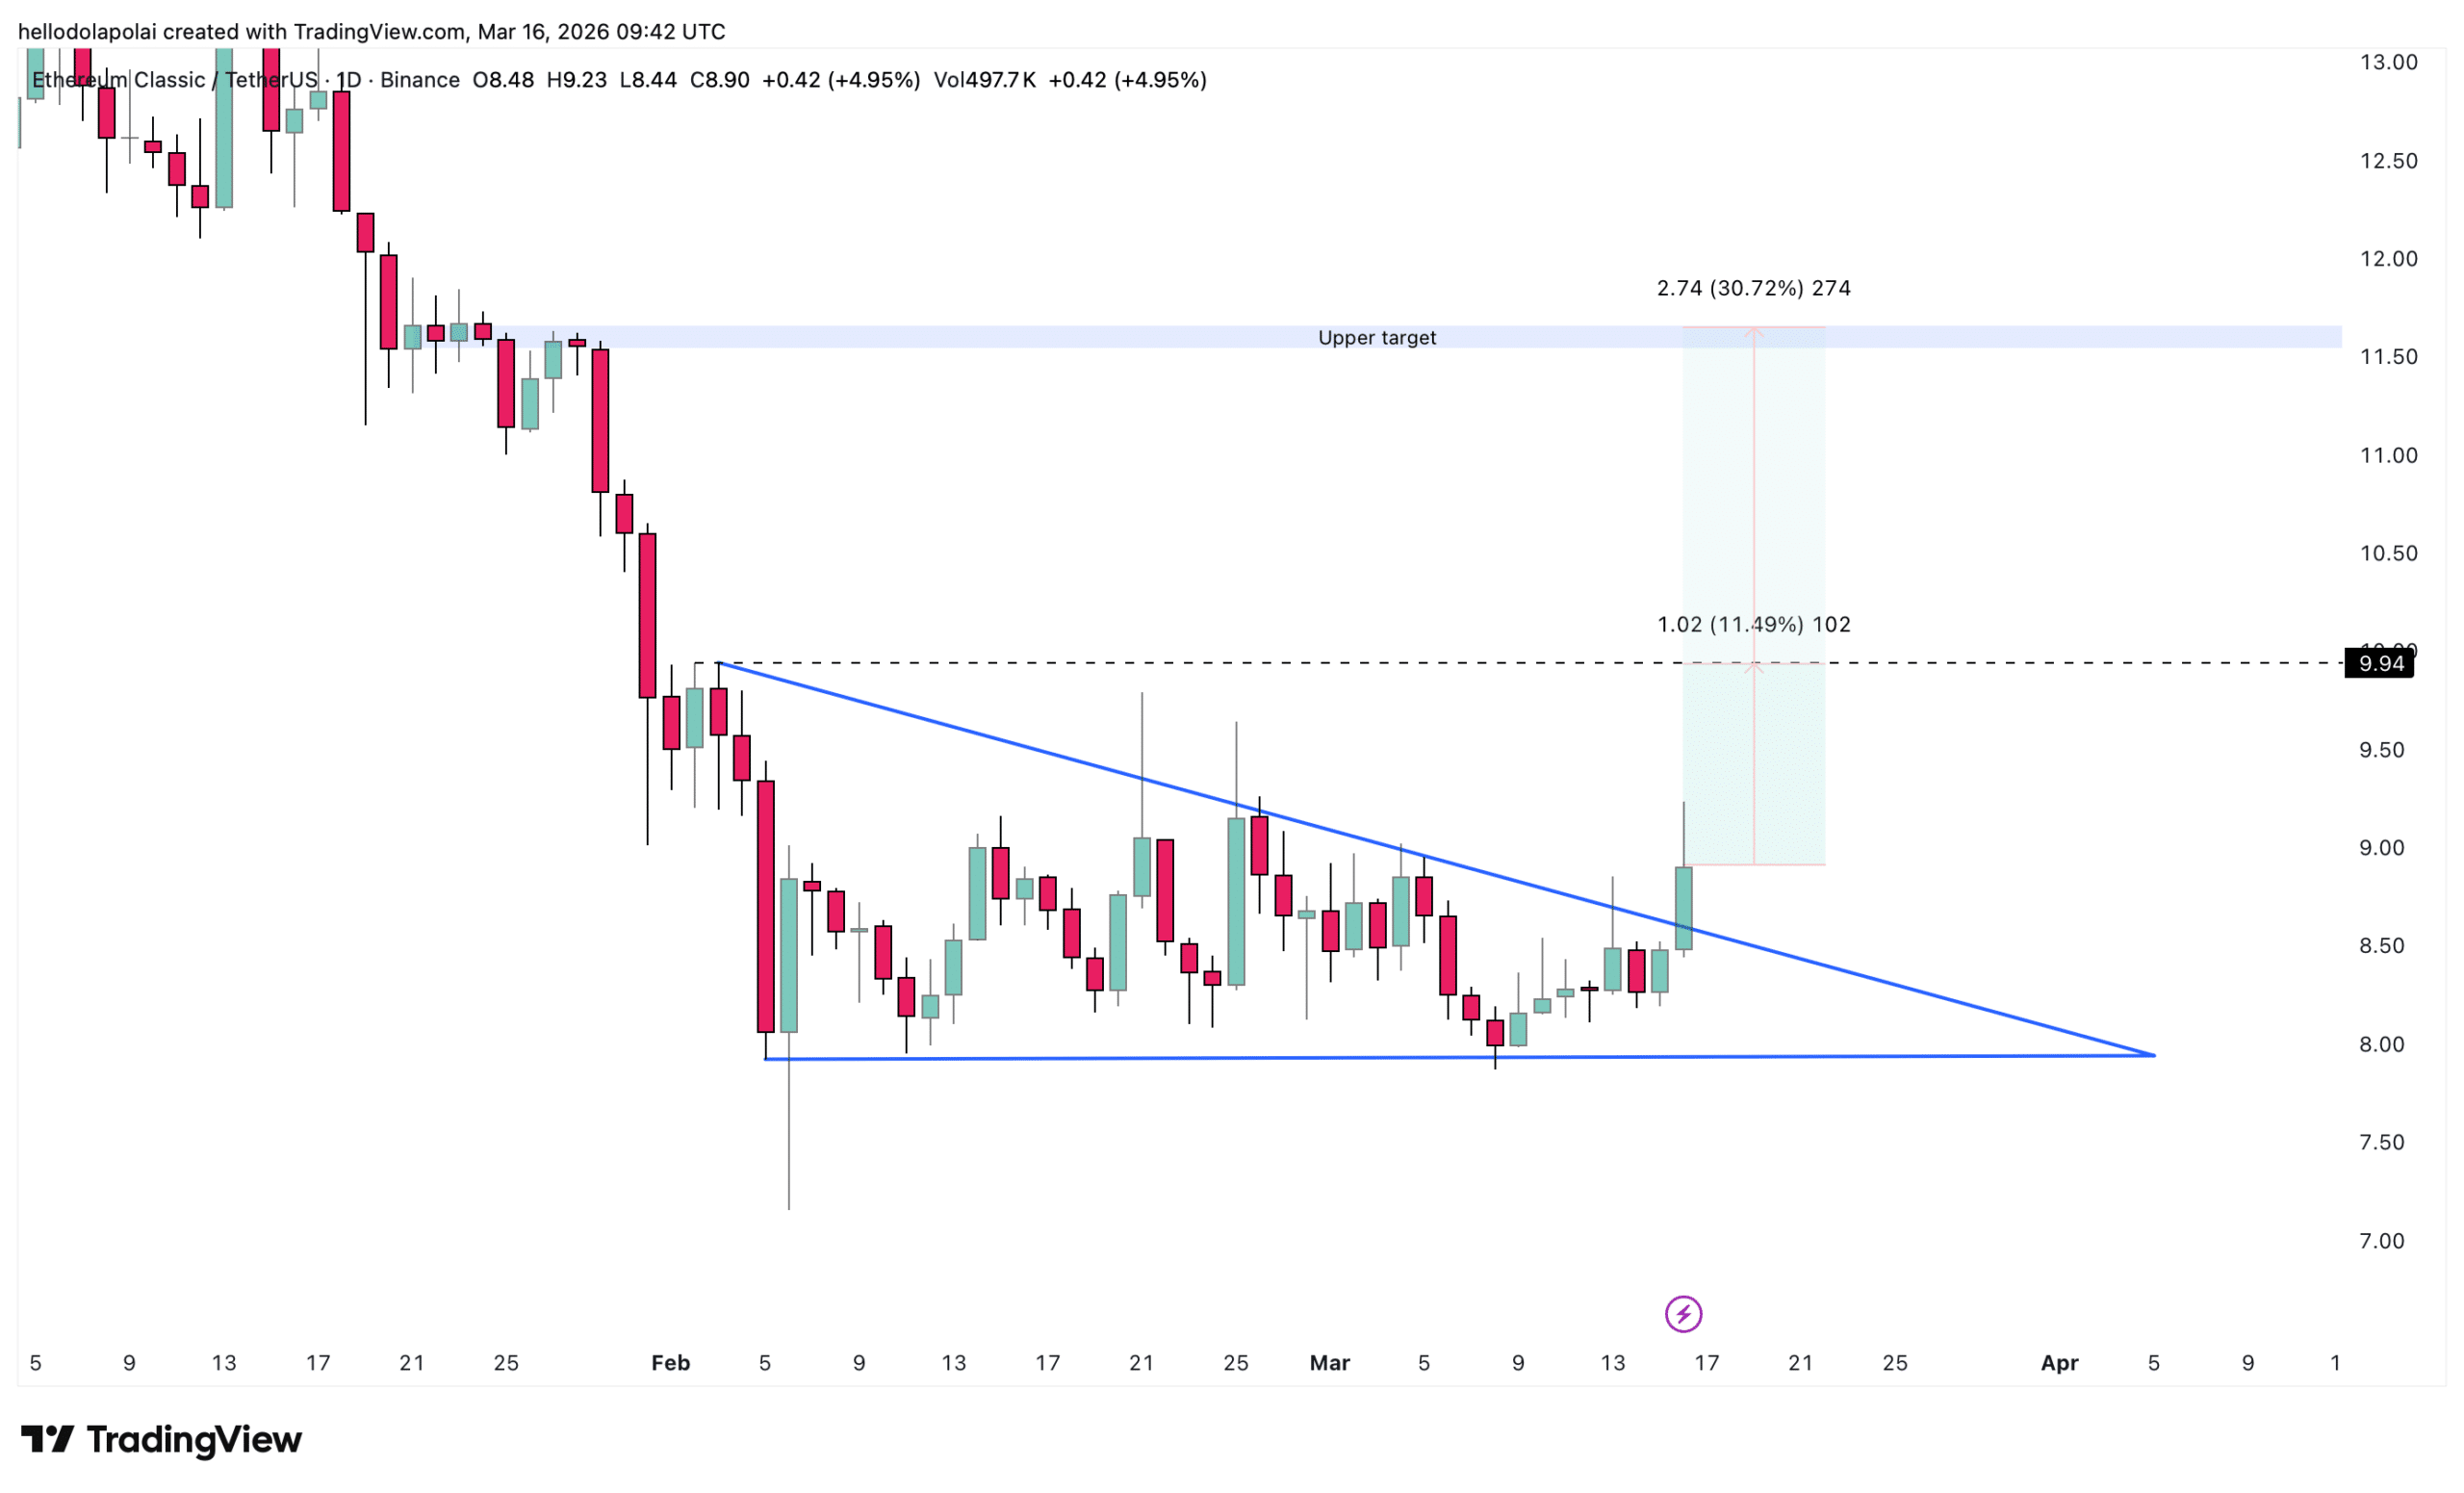
The distance between ETC’s current price and the beginning of that structure represents roughly 11% additional upside.
If the asset manages to clear the next resistance zone around $11.66, the rally could extend further, potentially reaching 30% above current levels, according to the chart projection.
However, failure to sustain the breakout could invalidate the move. In that scenario, ETC may return to the channel and resume trading within the previous range, especially if broader market sentiment weakens.
Indicators show strengthening momentum
Several technical indicators also suggest that the market is preparing for further movement.
The Moving Average Convergence Divergence (MACD) indicator, which measures momentum shifts, shows strengthening bullish pressure through a series of rising histogram bars on the chart.
If the MACD line (blue) crosses decisively above the signal line (orange) in positive territory, it would confirm that momentum is accelerating and could support a stronger upward move.

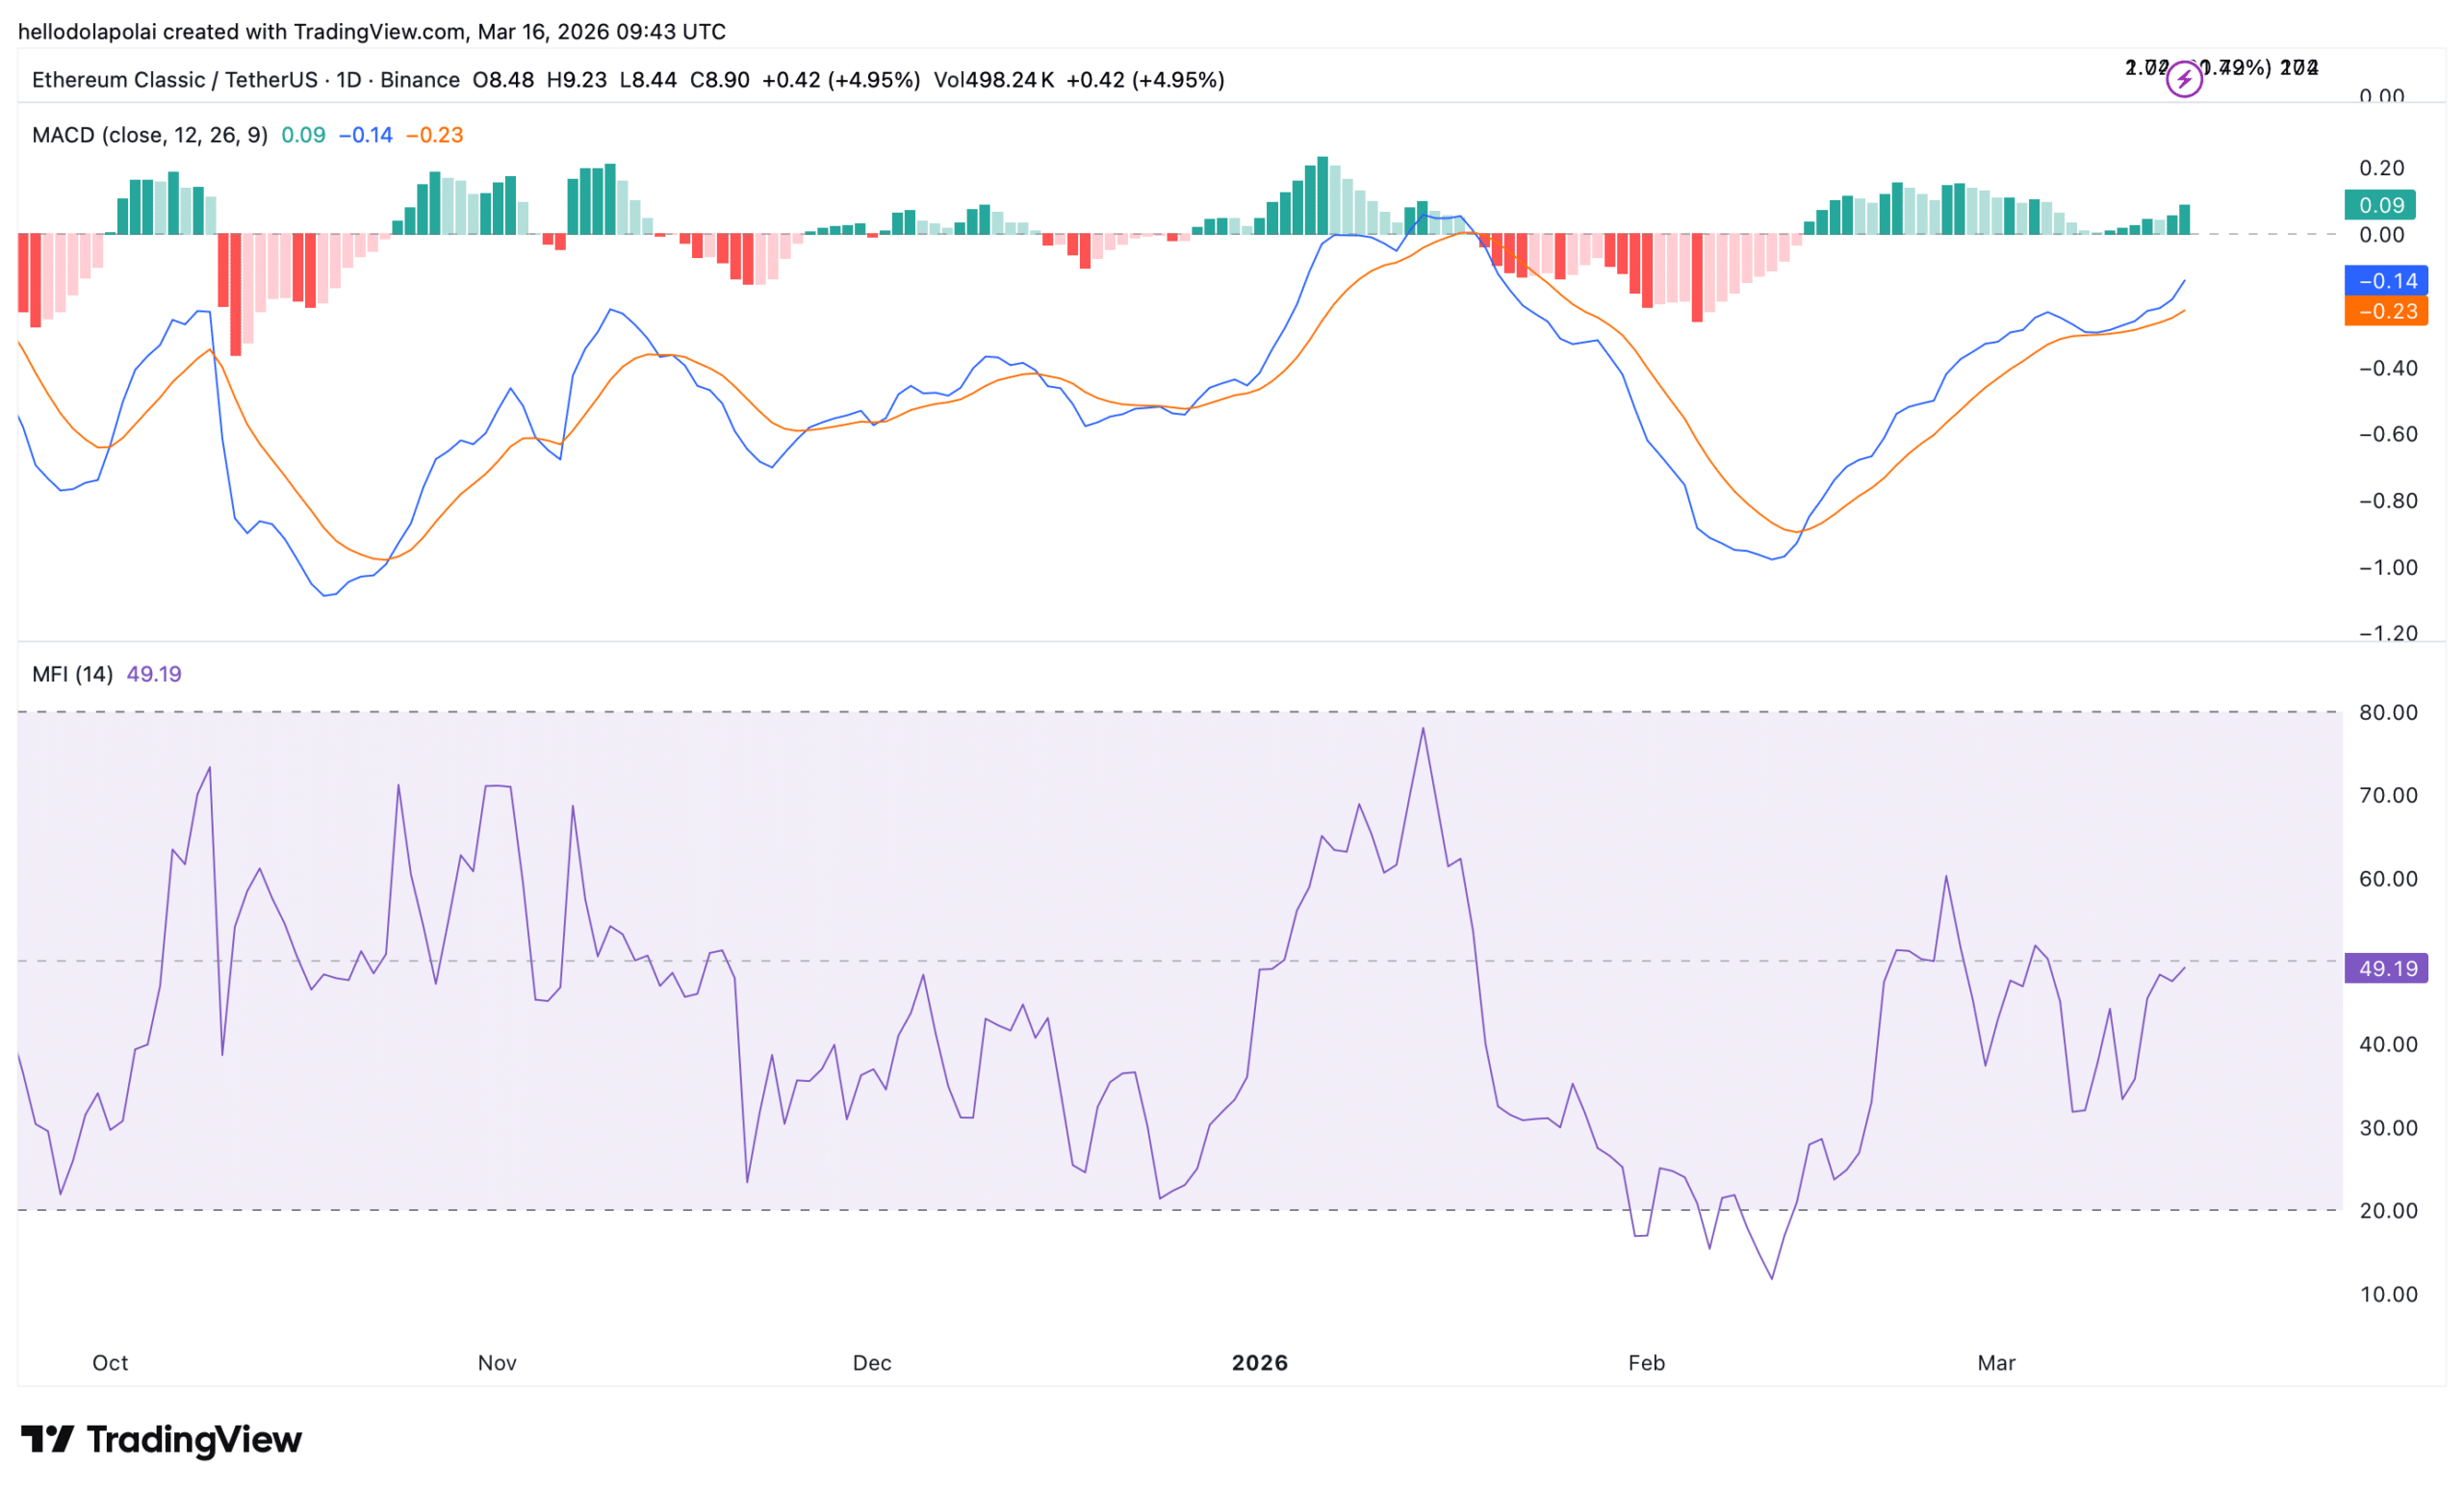
Meanwhile, the Money Flow Index (MFI), which tracks capital inflows and outflows, has continued to trend higher. The indicator, however, remains below the 50 threshold, a level typically used to confirm stronger buying pressure.
A break above this level would indicate that investors are increasing capital allocations into Ethereum Classic and could reinforce the asset’s ongoing rally.
For now, ETC’s upside momentum remains intact, but the sustainability of the move will depend largely on whether capital inflows and bullish sentiment continue to build.
Final Summary
- ETC jumps sharply as investor confidence strengthens across social platforms.
- Further upside now depends largely on sustained momentum and continued capital inflows.