Ethereum activity hits 788K addresses – Can ETH finally break out?

ambcryptoPublished on 2026-04-03Last updated on 2026-04-03

Abstract

Ethereum's network activity has surged, with over 788,000 daily active addresses and more than 255,000 new addresses created, indicating strong underlying demand and user growth. Despite this, ETH's price remains range-bound between $1,807 support and $2,371 resistance, failing to break out despite repeated tests. On-chain data shows persistent outflows from exchanges, suggesting accumulation, but this has not yet translated into significant buying pressure. Derivatives markets reveal declining open interest and a negative funding rate, reflecting bearish sentiment and reduced leverage. While network fundamentals strengthen, the price lacks the momentum for a sustained breakout due to ongoing consolidation and dominant short positioning.

Ethereum’s network activity has surged toward historic highs, with over 788K Daily Active Addresses interacting across the network.

Source: Santiment

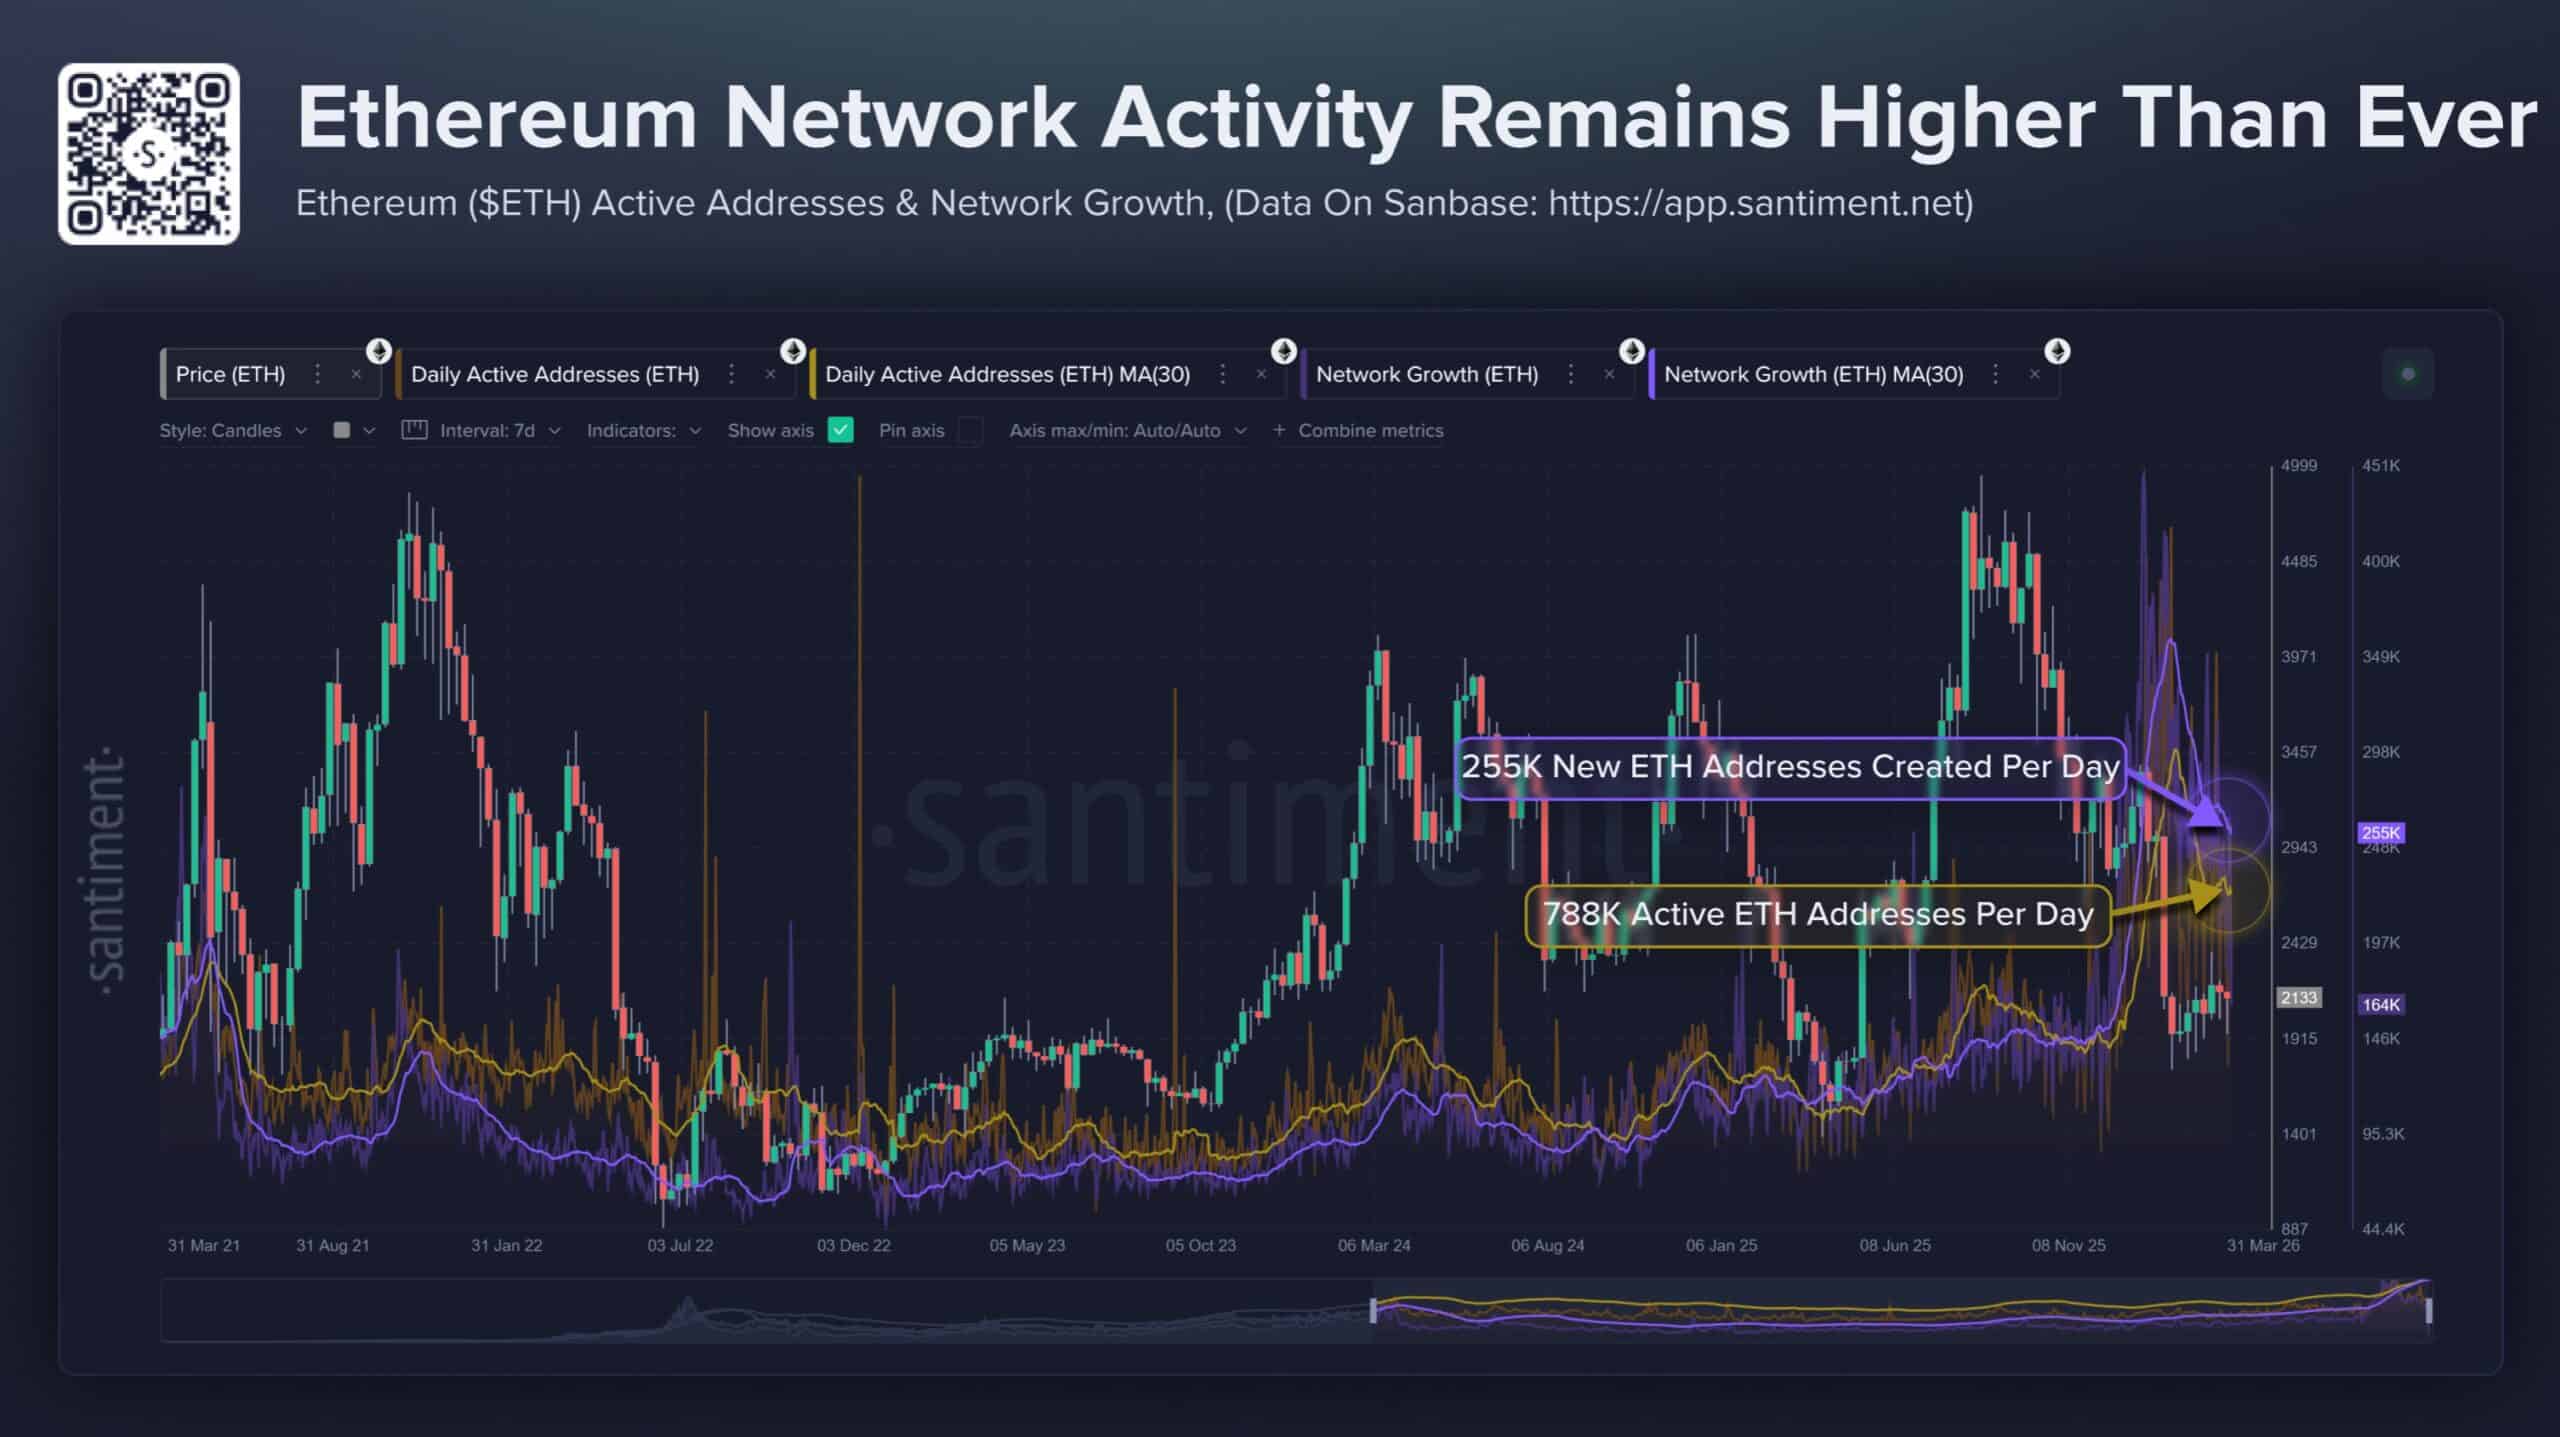
In addition, more than 255K new addresses are being created each day, reflecting sustained user onboarding.

As more addresses interact with the network daily, underlying demand appears to strengthen beneath the surface.

Yet, price behavior suggests that this demand has not fully translated into visible buying pressure.

This gap raises a critical question about how much of this activity reflects organic growth versus structural positioning, leaving the market in a state where participation increases, but price direction remains unresolved.

Ethereum price range holds as resistance caps upside

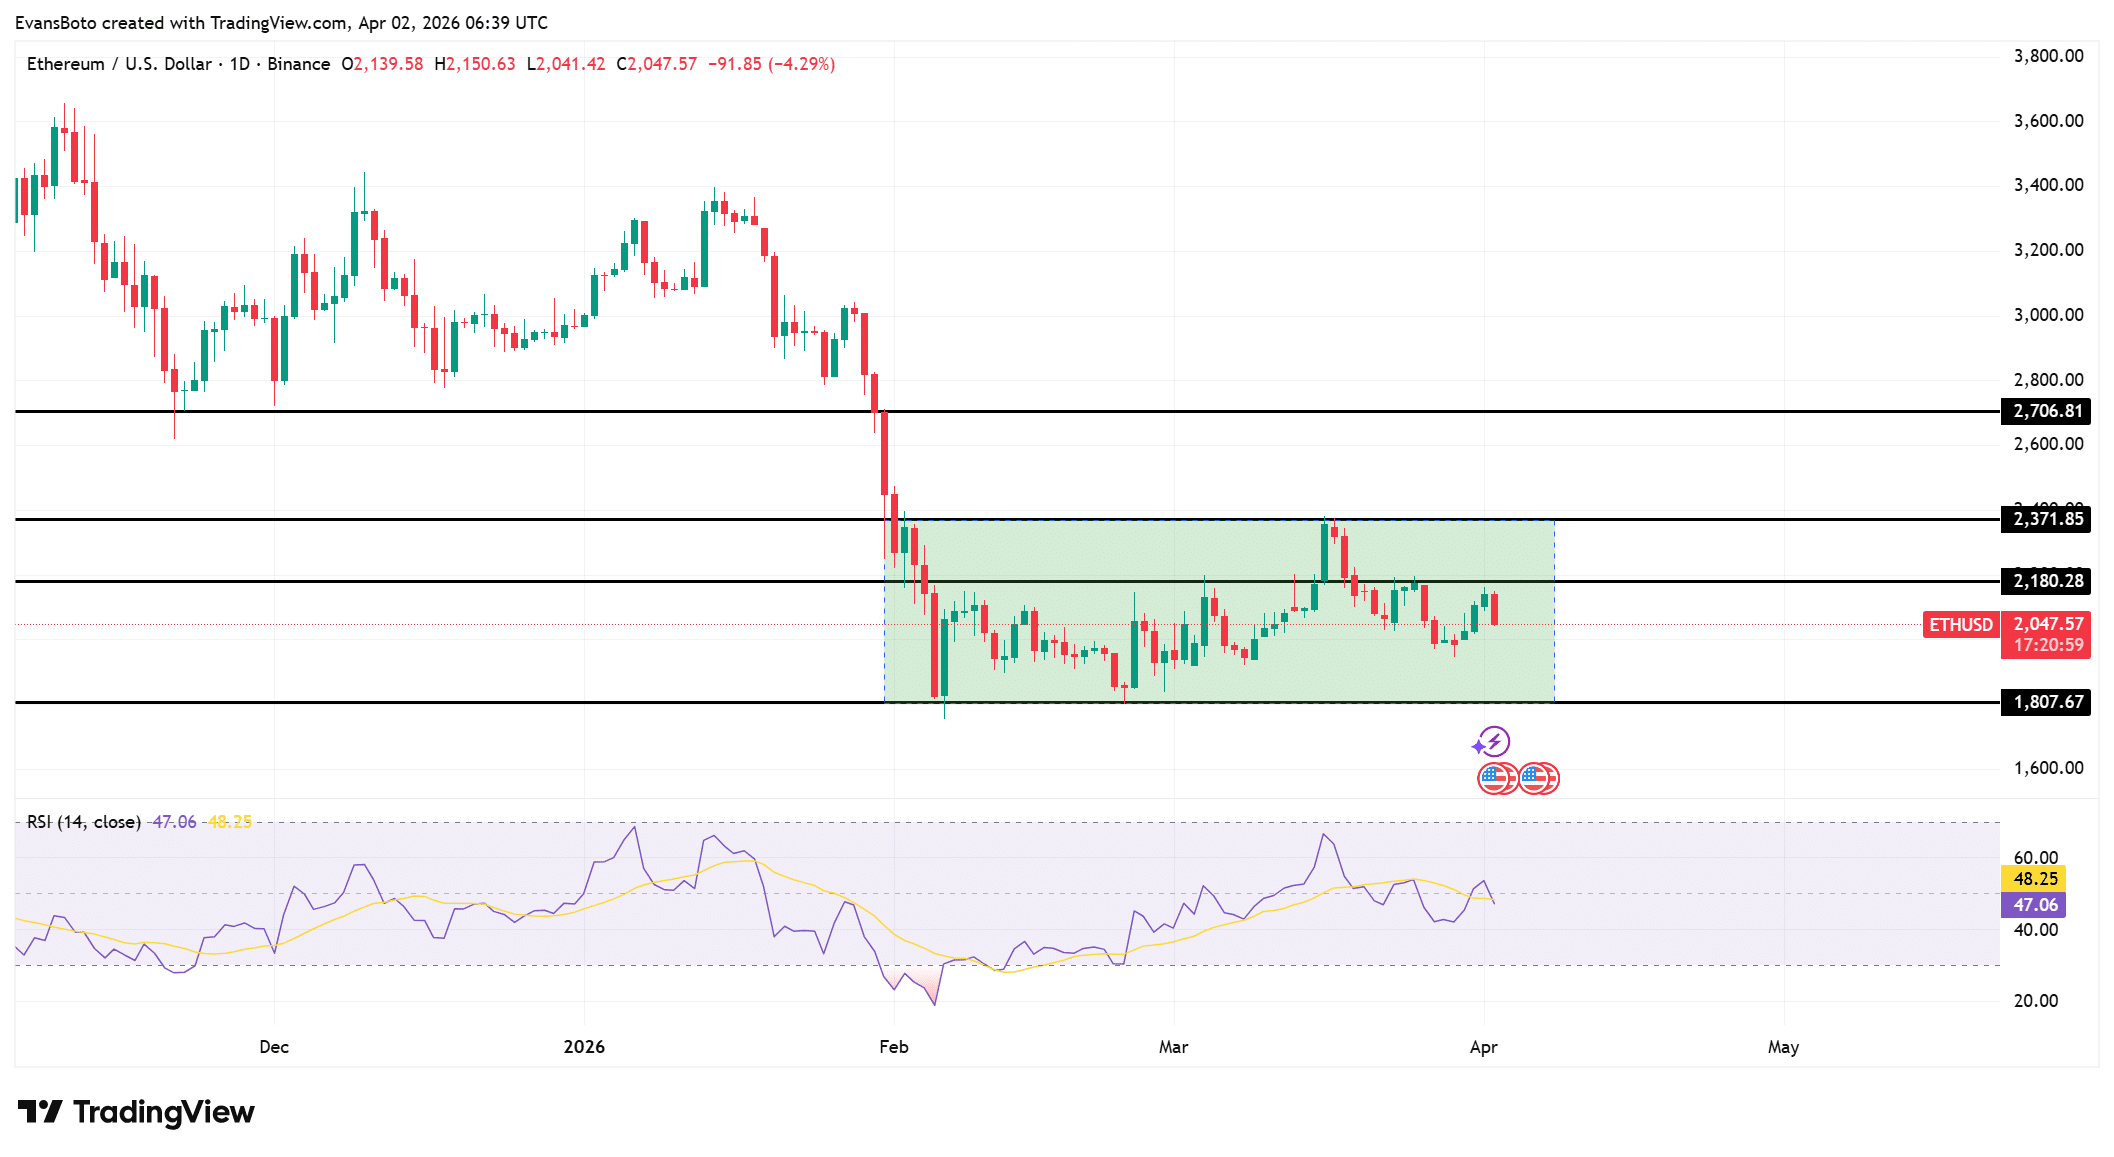
Despite strong on-chain growth, Ethereum [ETH] traded within a defined range between $1,807 support and $2,371 resistance.

Price repeatedly tested the $2,371 resistance but failed to sustain a breakout. This kept the structure compressed and limited upward expansion.

RSI stabilized near 47.06, reflecting neutral momentum without clear directional bias.

Although RSI recovered from oversold levels, it failed to break above 60. That indicated bullish strength remained limited.

Meanwhile, resistance near $2,180 continued to reject upward moves.

Each rejection maintained a pattern of lower highs within the range. This pattern limited bullish continuation.

However, repeated defenses of $1,807 showed buyers remained active at lower levels. That balance reflected ongoing indecision between accumulation and distribution.

Source: TradingView

Outflows persist despite consolidation phase

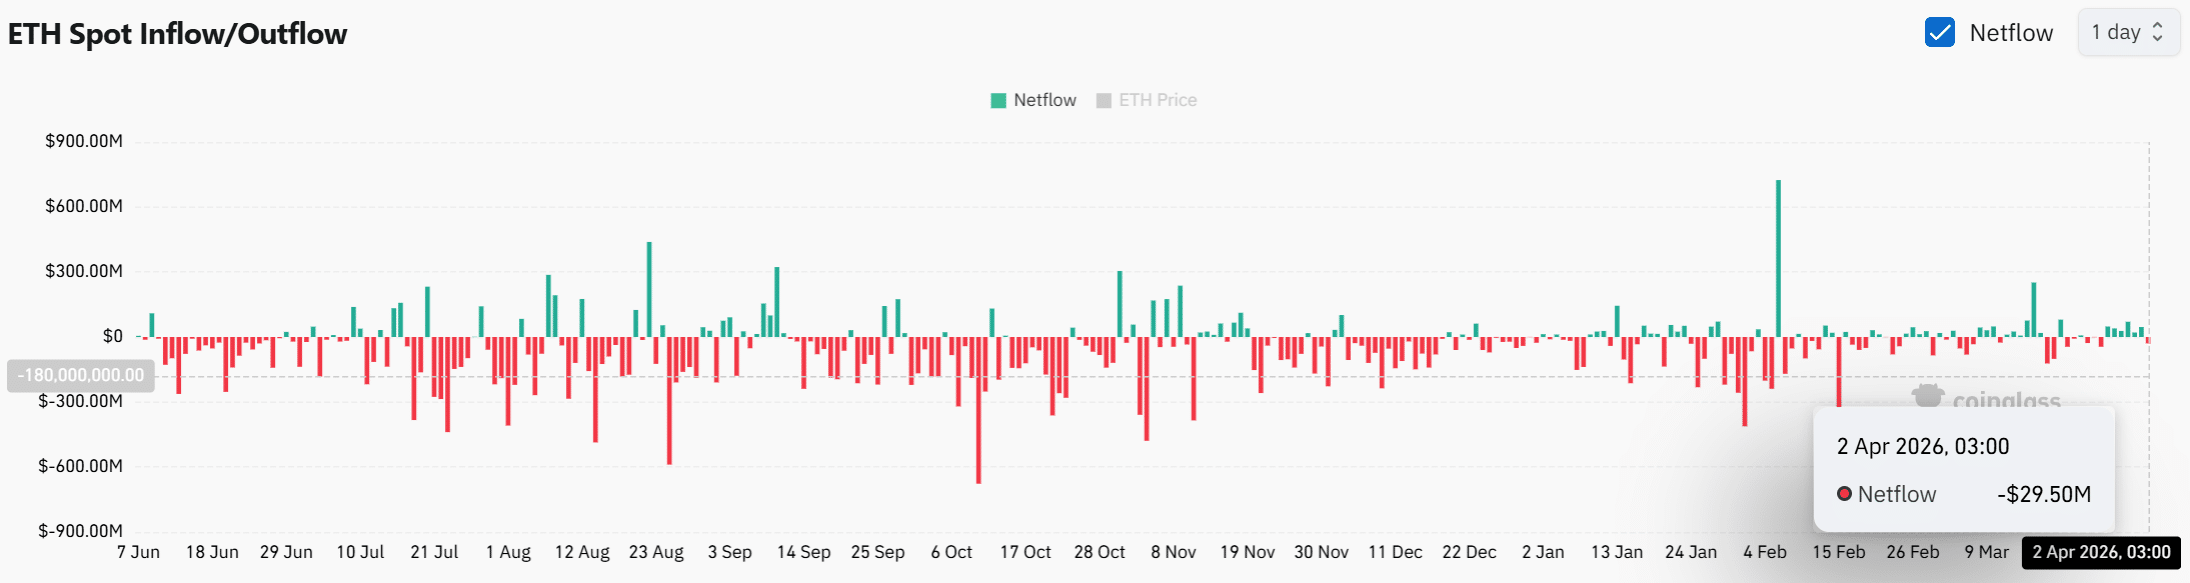
While price continues compressing, Spot Netflows remained negative, with recent data showing a $29.50M outflow.

This trend indicates that ETH continues leaving exchanges, which reduces immediately available supply for selling.

Such persistent outflows typically reflect accumulation behavior, as investors move assets into private wallets.

However, despite this supply tightening, price has not responded with upward expansion.

This suggests that although selling pressure may be decreasing, demand has not yet intensified enough to absorb resistance levels.

The continued outflow trend strengthens the underlying structure, yet price remains locked within the range as the market absorbs this shift gradually.

Source: CoinGlass

Ethereum leverage declines as shorts gain control

Beyond spot activity, derivatives data revealed a shift in positioning, as Open Interest [OI] dropped by 8.59% to $28.18B.

This decline showed that traders have reduced exposure, signaling lower participation in leveraged positions.

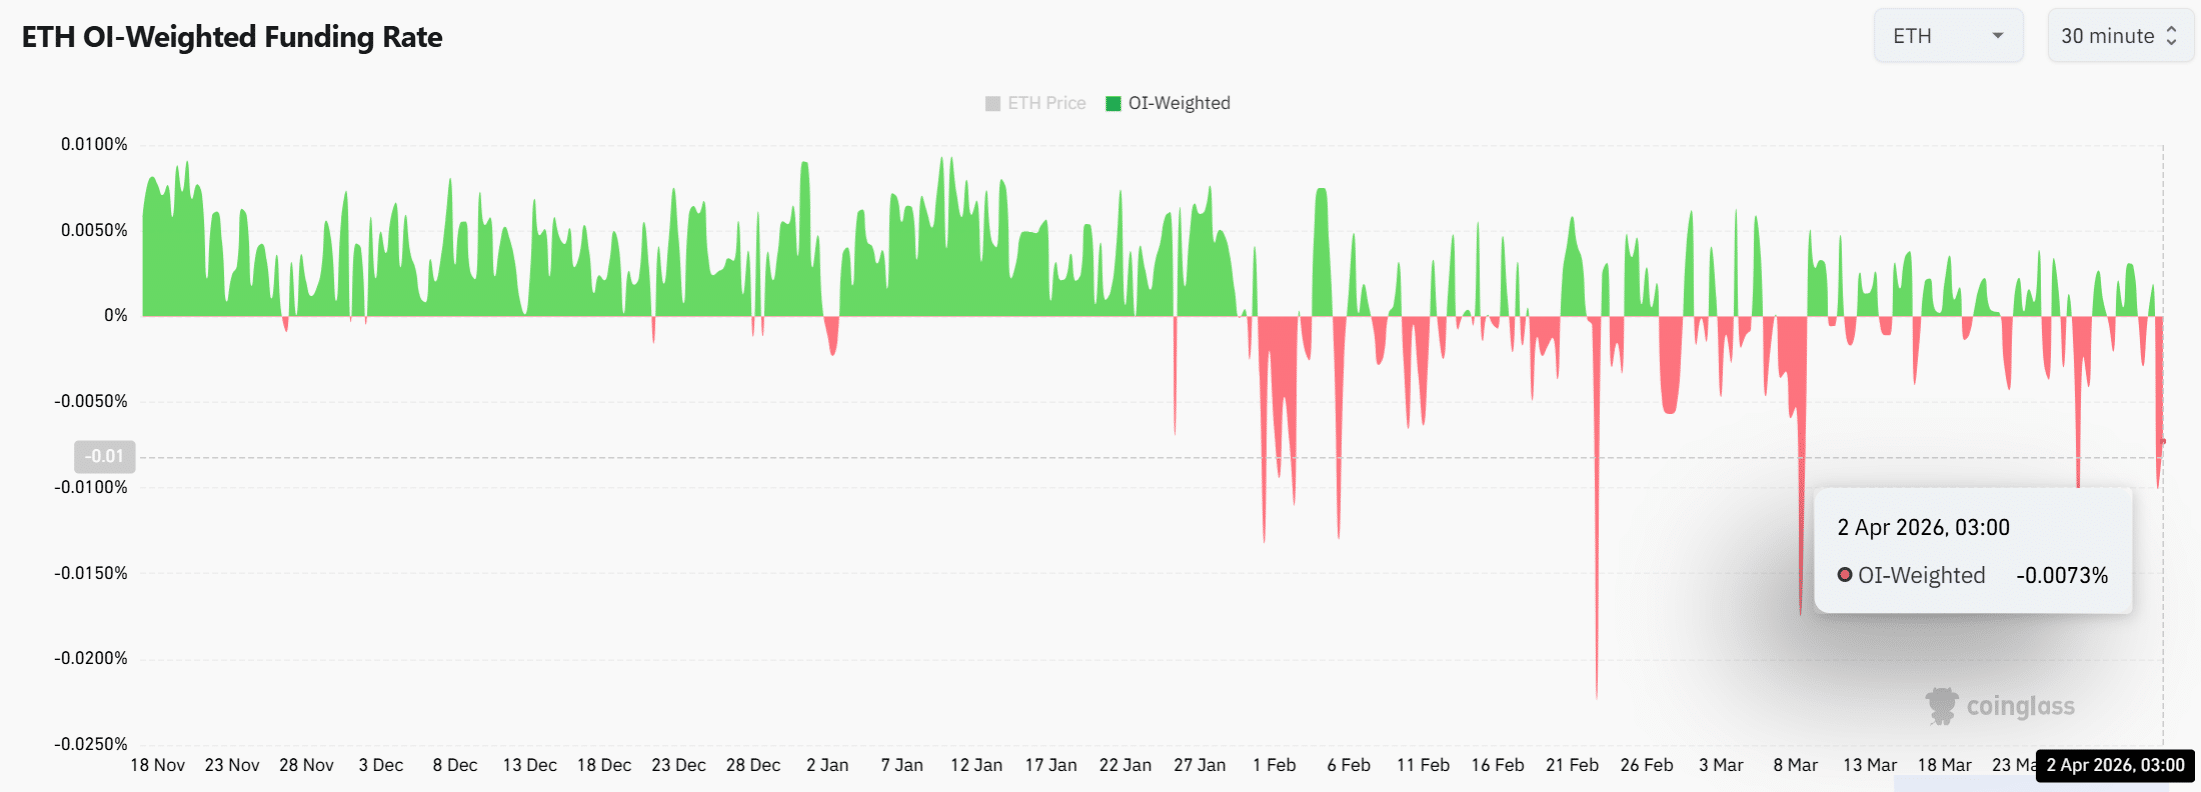
In addition, the OI-Weighted Funding Rate turned negative to -0.0073%, indicating that short positions now dominate.

This shift reflects growing bearish sentiment in the derivatives market, where traders increasingly position for downside or continued consolidation.

However, reduced leverage can also lower volatility, which reinforces the current range-bound behavior.

Therefore, as traders step back and shorts gain control, the price remains constrained, lacking the aggressive positioning needed to drive a breakout.

Source: CoinGlass

Can activity drive a breakout?

Ethereum’s network growth continues to strengthen its foundation, yet the price remains constrained within a defined range.

Reduced leverage and dominant short positioning limit upward expansion, despite ongoing accumulation signals.

This structure suggests that while underlying demand continues building, the market still requires stronger conviction to translate adoption into a sustained breakout.


Final Summary

  • Ethereum [ETH] network activity surged, with over 788K Daily Active Addresses and 255K new addresses created daily.
  • Rising participation signaled growing underlying demand, though price failed to reflect this strength.

Related Questions

QWhat is the current number of Daily Active Addresses on the Ethereum network mentioned in the article?

AOver 788,000 Daily Active Addresses.

QWhat are the key support and resistance levels for Ethereum's price as discussed in the article?

AThe key support level is $1,807 and the resistance level is $2,371.

QWhat does the negative Spot Netflows data indicate about Ethereum's market activity?

AIt indicates that ETH is leaving exchanges, which reduces immediately available supply and typically reflects accumulation behavior as investors move assets to private wallets.

QHow did the Open Interest (OI) and OI-Weighted Funding Rate change, and what does this signal?

AOpen Interest dropped by 8.59% to $28.18B, and the OI-Weighted Funding Rate turned negative to -0.0073%, signaling reduced trader exposure and that short positions now dominate, reflecting growing bearish sentiment.

QDespite strong on-chain growth, why has Ethereum price failed to break out according to the article?

AThe price has failed to break out due to reduced leverage, dominant short positioning in derivatives, and a lack of strong enough demand to absorb resistance levels, keeping the market range-bound.

Related Reads

You Bet on the News, the Pros Read the Rules: The True Cognitive Gap in Losing Money on Polymarket

The article explains that the key to profiting on Polymarket, a prediction market platform, lies not just predicting real-world events correctly, but in meticulously understanding the specific rules that govern how each market will be resolved. It illustrates this with examples, such as a market on Venezuela's 2026 leader, where the official rules defining "officially holds" the office overruled the intuitive answer of who was in practical control. Other examples include debates over the definition of a "token" or what constitutes an "agreement." The core argument is that a "reality vs. rules" gap creates pricing discrepancies that savvy traders ("车头" or "whales") exploit. The platform has a formal dispute resolution process managed by UMA token holders to settle ambiguous outcomes. This process involves proposal submission, a challenge window, a discussion period, and a final vote. However, the article highlights a critical flaw in this system compared to a traditional court: the lack of separation between the arbiters (UMA voters) and the interested parties (traders with financial stakes in the outcome). This conflict of interest undermines the discussion phase, leads to herd mentality, and results in opaque final decisions without explanatory rulings. Consequently, the system lacks a body of precedent, making it difficult for users to learn from past disputes. The ultimate takeaway is that success on Polymarket requires a lawyer-like scrutiny of the rules to identify and capitalize on the cognitive gap between how events appear and how they are contractually defined for settlement.

marsbit1h ago

You Bet on the News, the Pros Read the Rules: The True Cognitive Gap in Losing Money on Polymarket

marsbit1h ago

Trading

Spot
Futures

Hot Articles

Discussions

Welcome to the HTX Community. Here, you can stay informed about the latest platform developments and gain access to professional market insights. Users' opinions on the price of ETH (ETH) are presented below.

活动图片