DeXe slips 13% – But here’s why the pullback may be temporary

ambcryptoPublished on 2026-07-14Last updated on 2026-07-14

Abstract

DeXe (DEXE) has recently pulled back by approximately 13% after a significant rally, gaining over 1,000% in the past six months. This dip is largely attributed to profit-taking by buyers. Analysis of the price chart indicates the sell-off may be temporary. Key demand zones are seen as potential support levels, with the first zone being the most likely to hold. Technical indicators support this view: the Accumulation/Distribution line shows slight upward divergence despite falling prices, and the RSI remains in a neutral-bullish range near 52. Furthermore, spot market data reveals a sharp decline in net selling pressure, dropping more than tenfold from its recent peak. The evidence suggests the current weakness is a slowdown within a longer-term bullish trend rather than a decisive reversal.

DeXe [DEXE] has been printing fresh highs for weeks, gaining 45% in the past seven days alone and more than 1,000% across the past 180 days, as reflected on the chart.

Over the past 24 hours, capital has begun retreating as buyers step back and lock in profit, a shift that has dragged the asset down roughly 13% within the period.

The chart structure, however, points to a possible temporary pullback, with price still positioned to extend its upside over the longer term.

DeXe doji candles expose a standoff

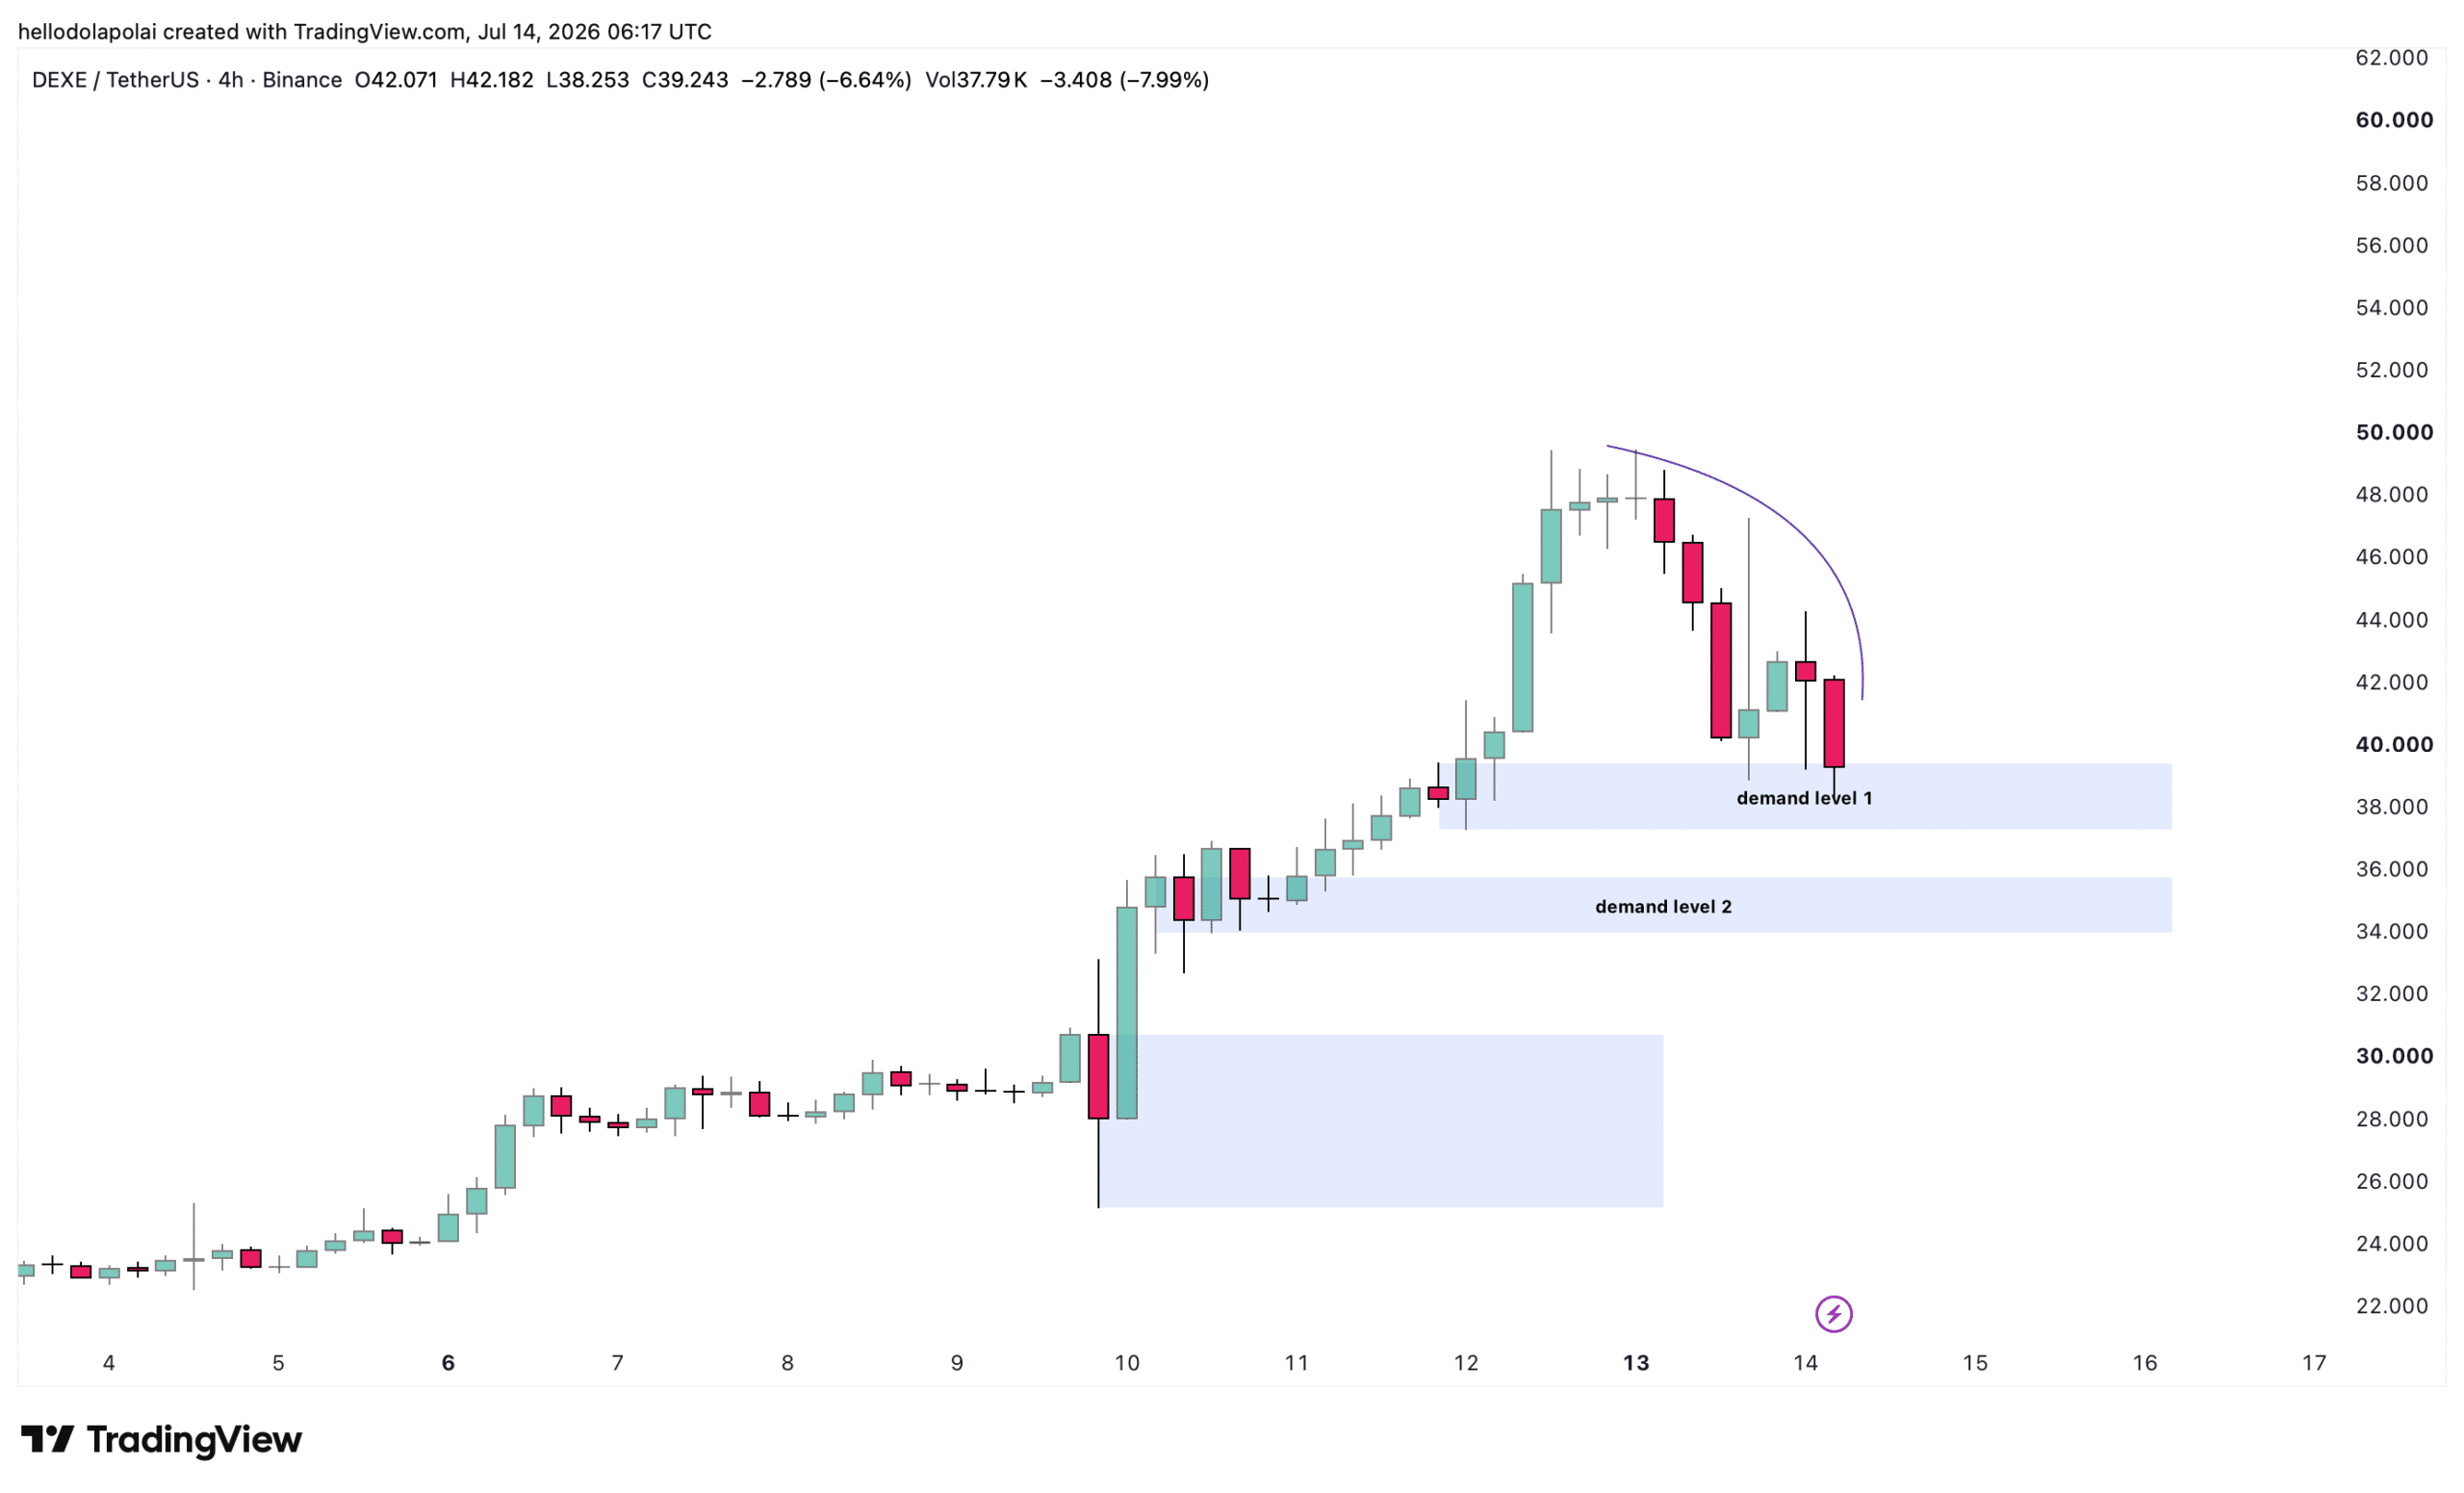
DeXe printed two telling doji candles in the early hours of the day.

The first, a gravestone doji, reflected intense sell pressure as price attempted to extend its upswing, while a dragonfly doji formed a few candles later and signaled bulls stepping back in.

Price currently sits decidedly bearish, and the near-term outcome hinges on the key demand zones mapped on the chart.
Source: TradingView

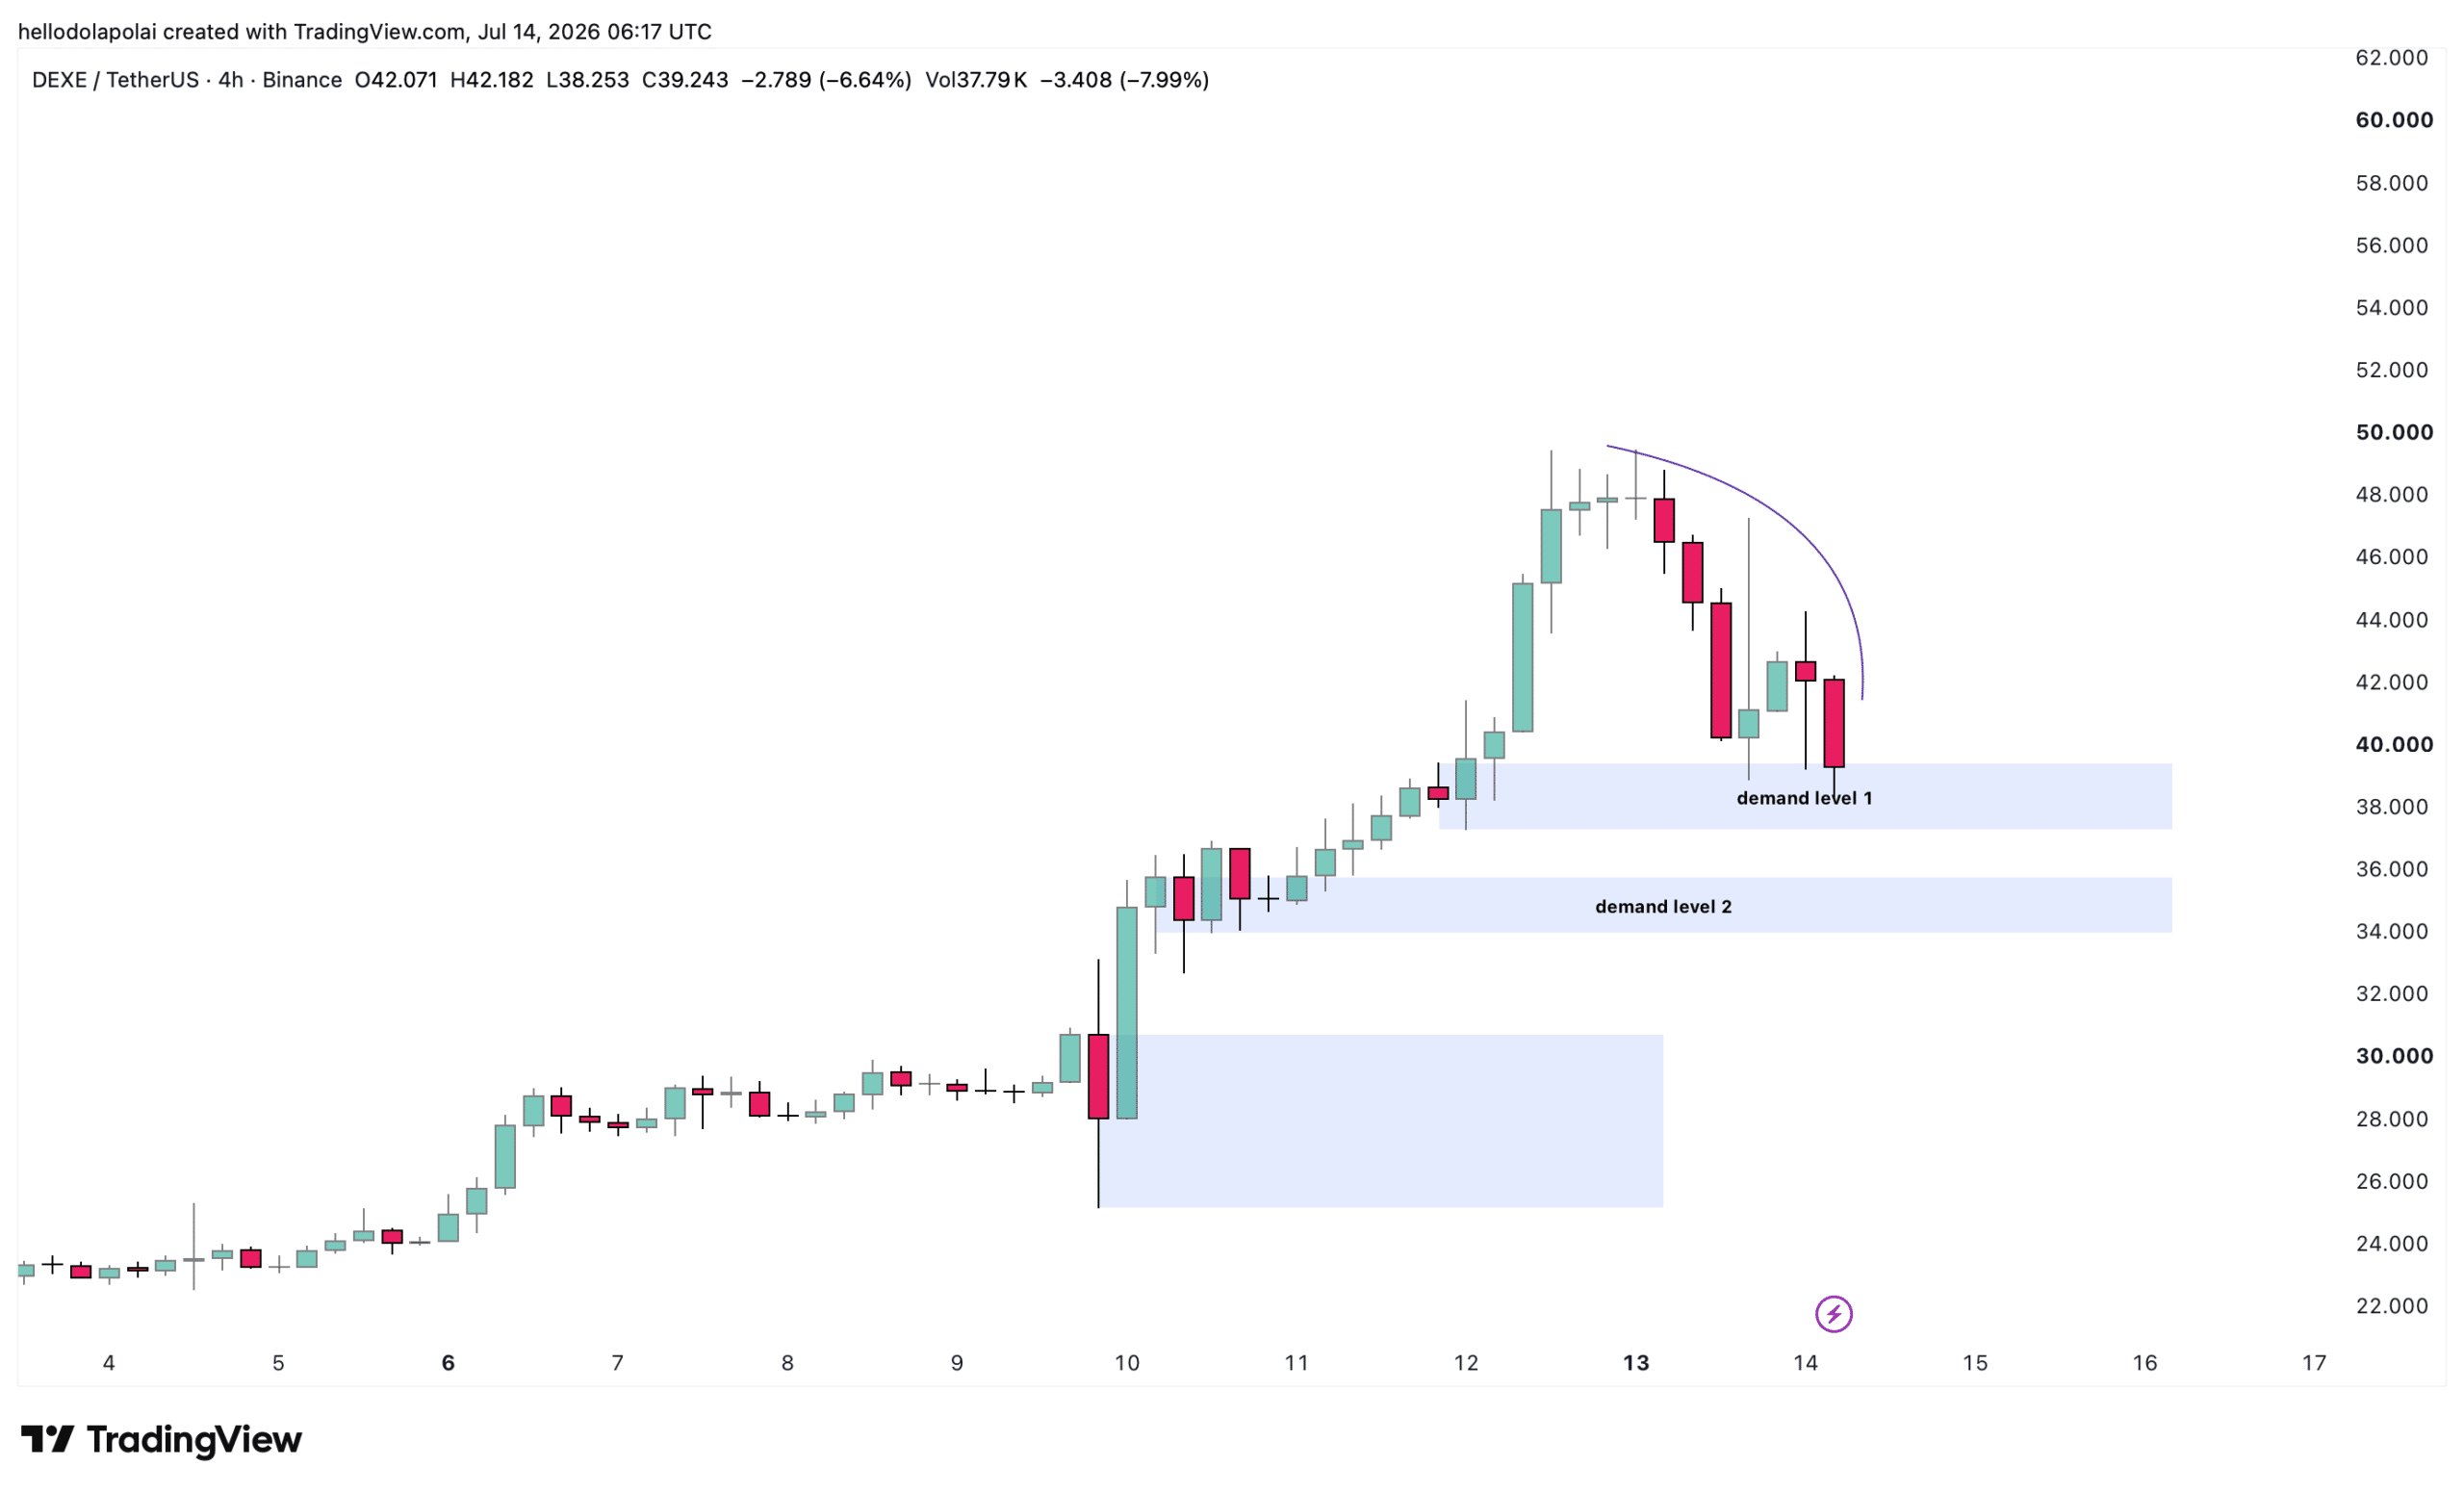
Demand zone 1 offers the first line of support, and a sufficient bounce there could send price swinging upward to clear the overhead liquidity marked by the curved line on the left.

Should selling pressure keep mounting and that level give way, demand zone 2 stands ready to cushion price and absorb the pressure that has weighed on the asset for most of the day.

Demand zone 1 holding remains the likelier scenario, and volume data supports that read, with volume down 36% over the period.

Declining volume alongside a falling price often signals that the momentum driving the move is weak, which opens room for buyers to take control.

Indicators point to a slowdown rather than a reversal

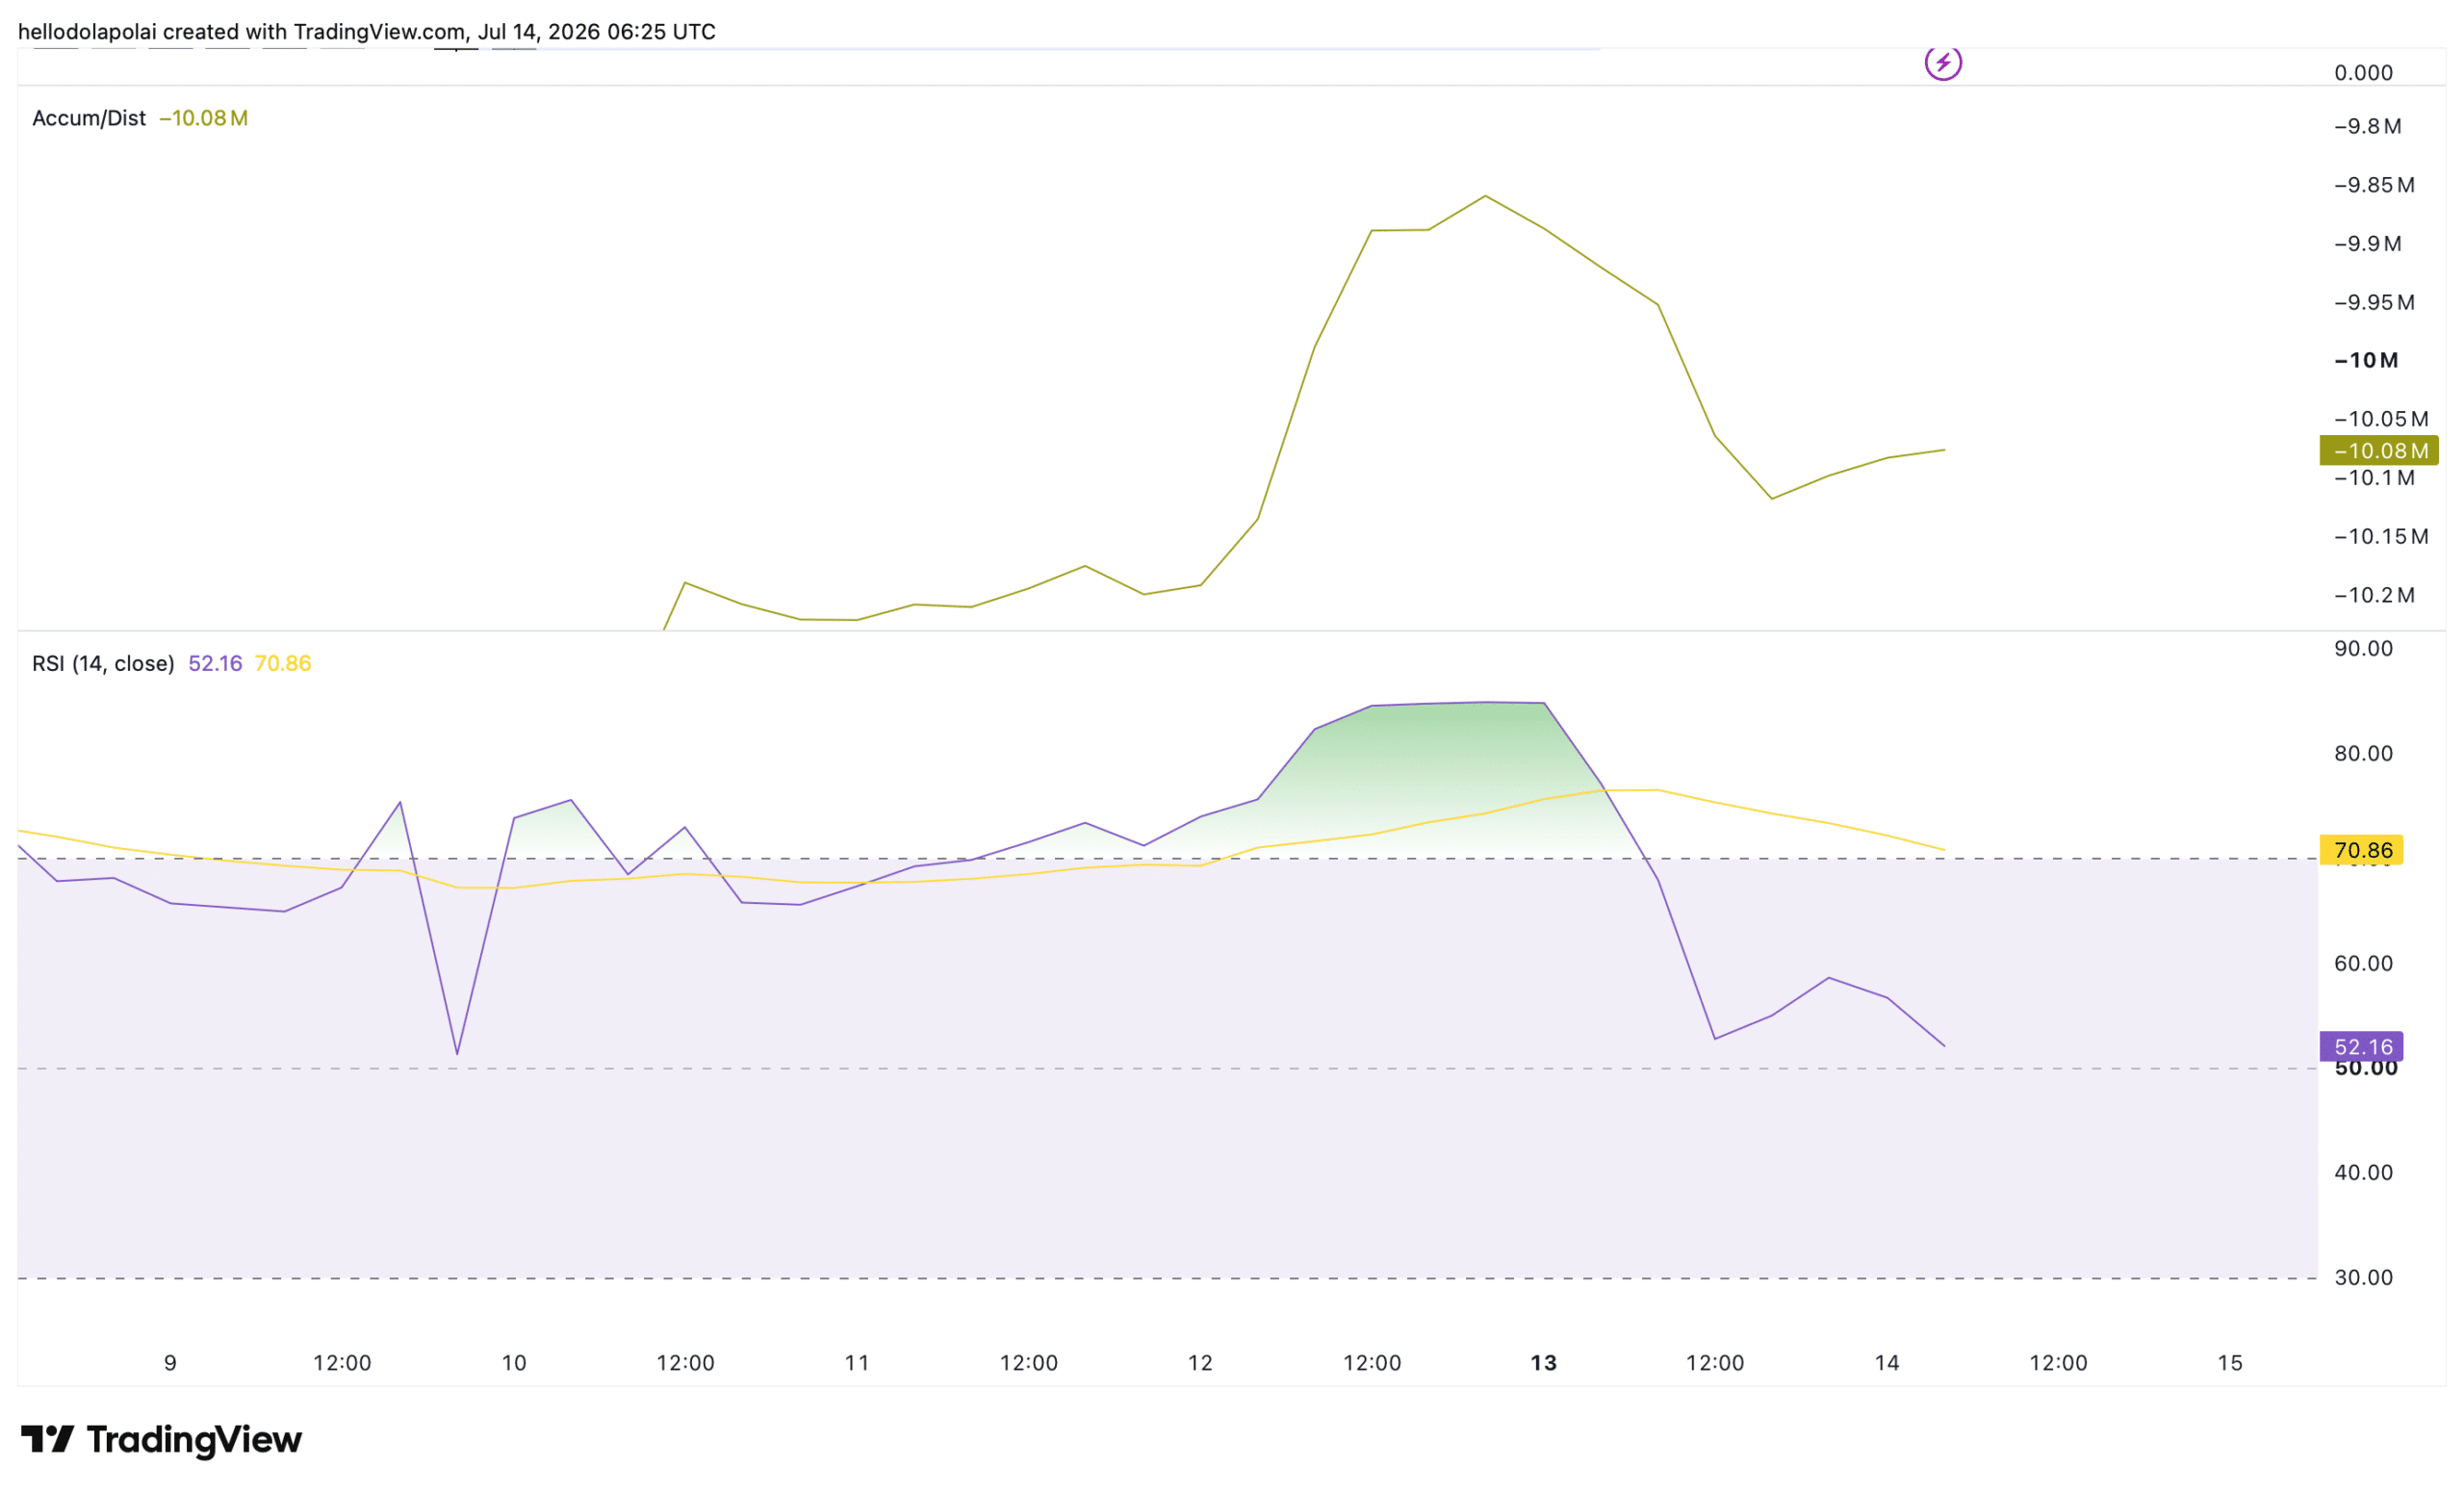
Momentum indicators aren’t fully aligned with the bearish price action, and the Accumulation/Distribution (A/D) indicator captures that tension.

The A/D line weights each period’s volume by where price closes within its range, serving as a proxy for whether an asset is being accumulated or distributed.

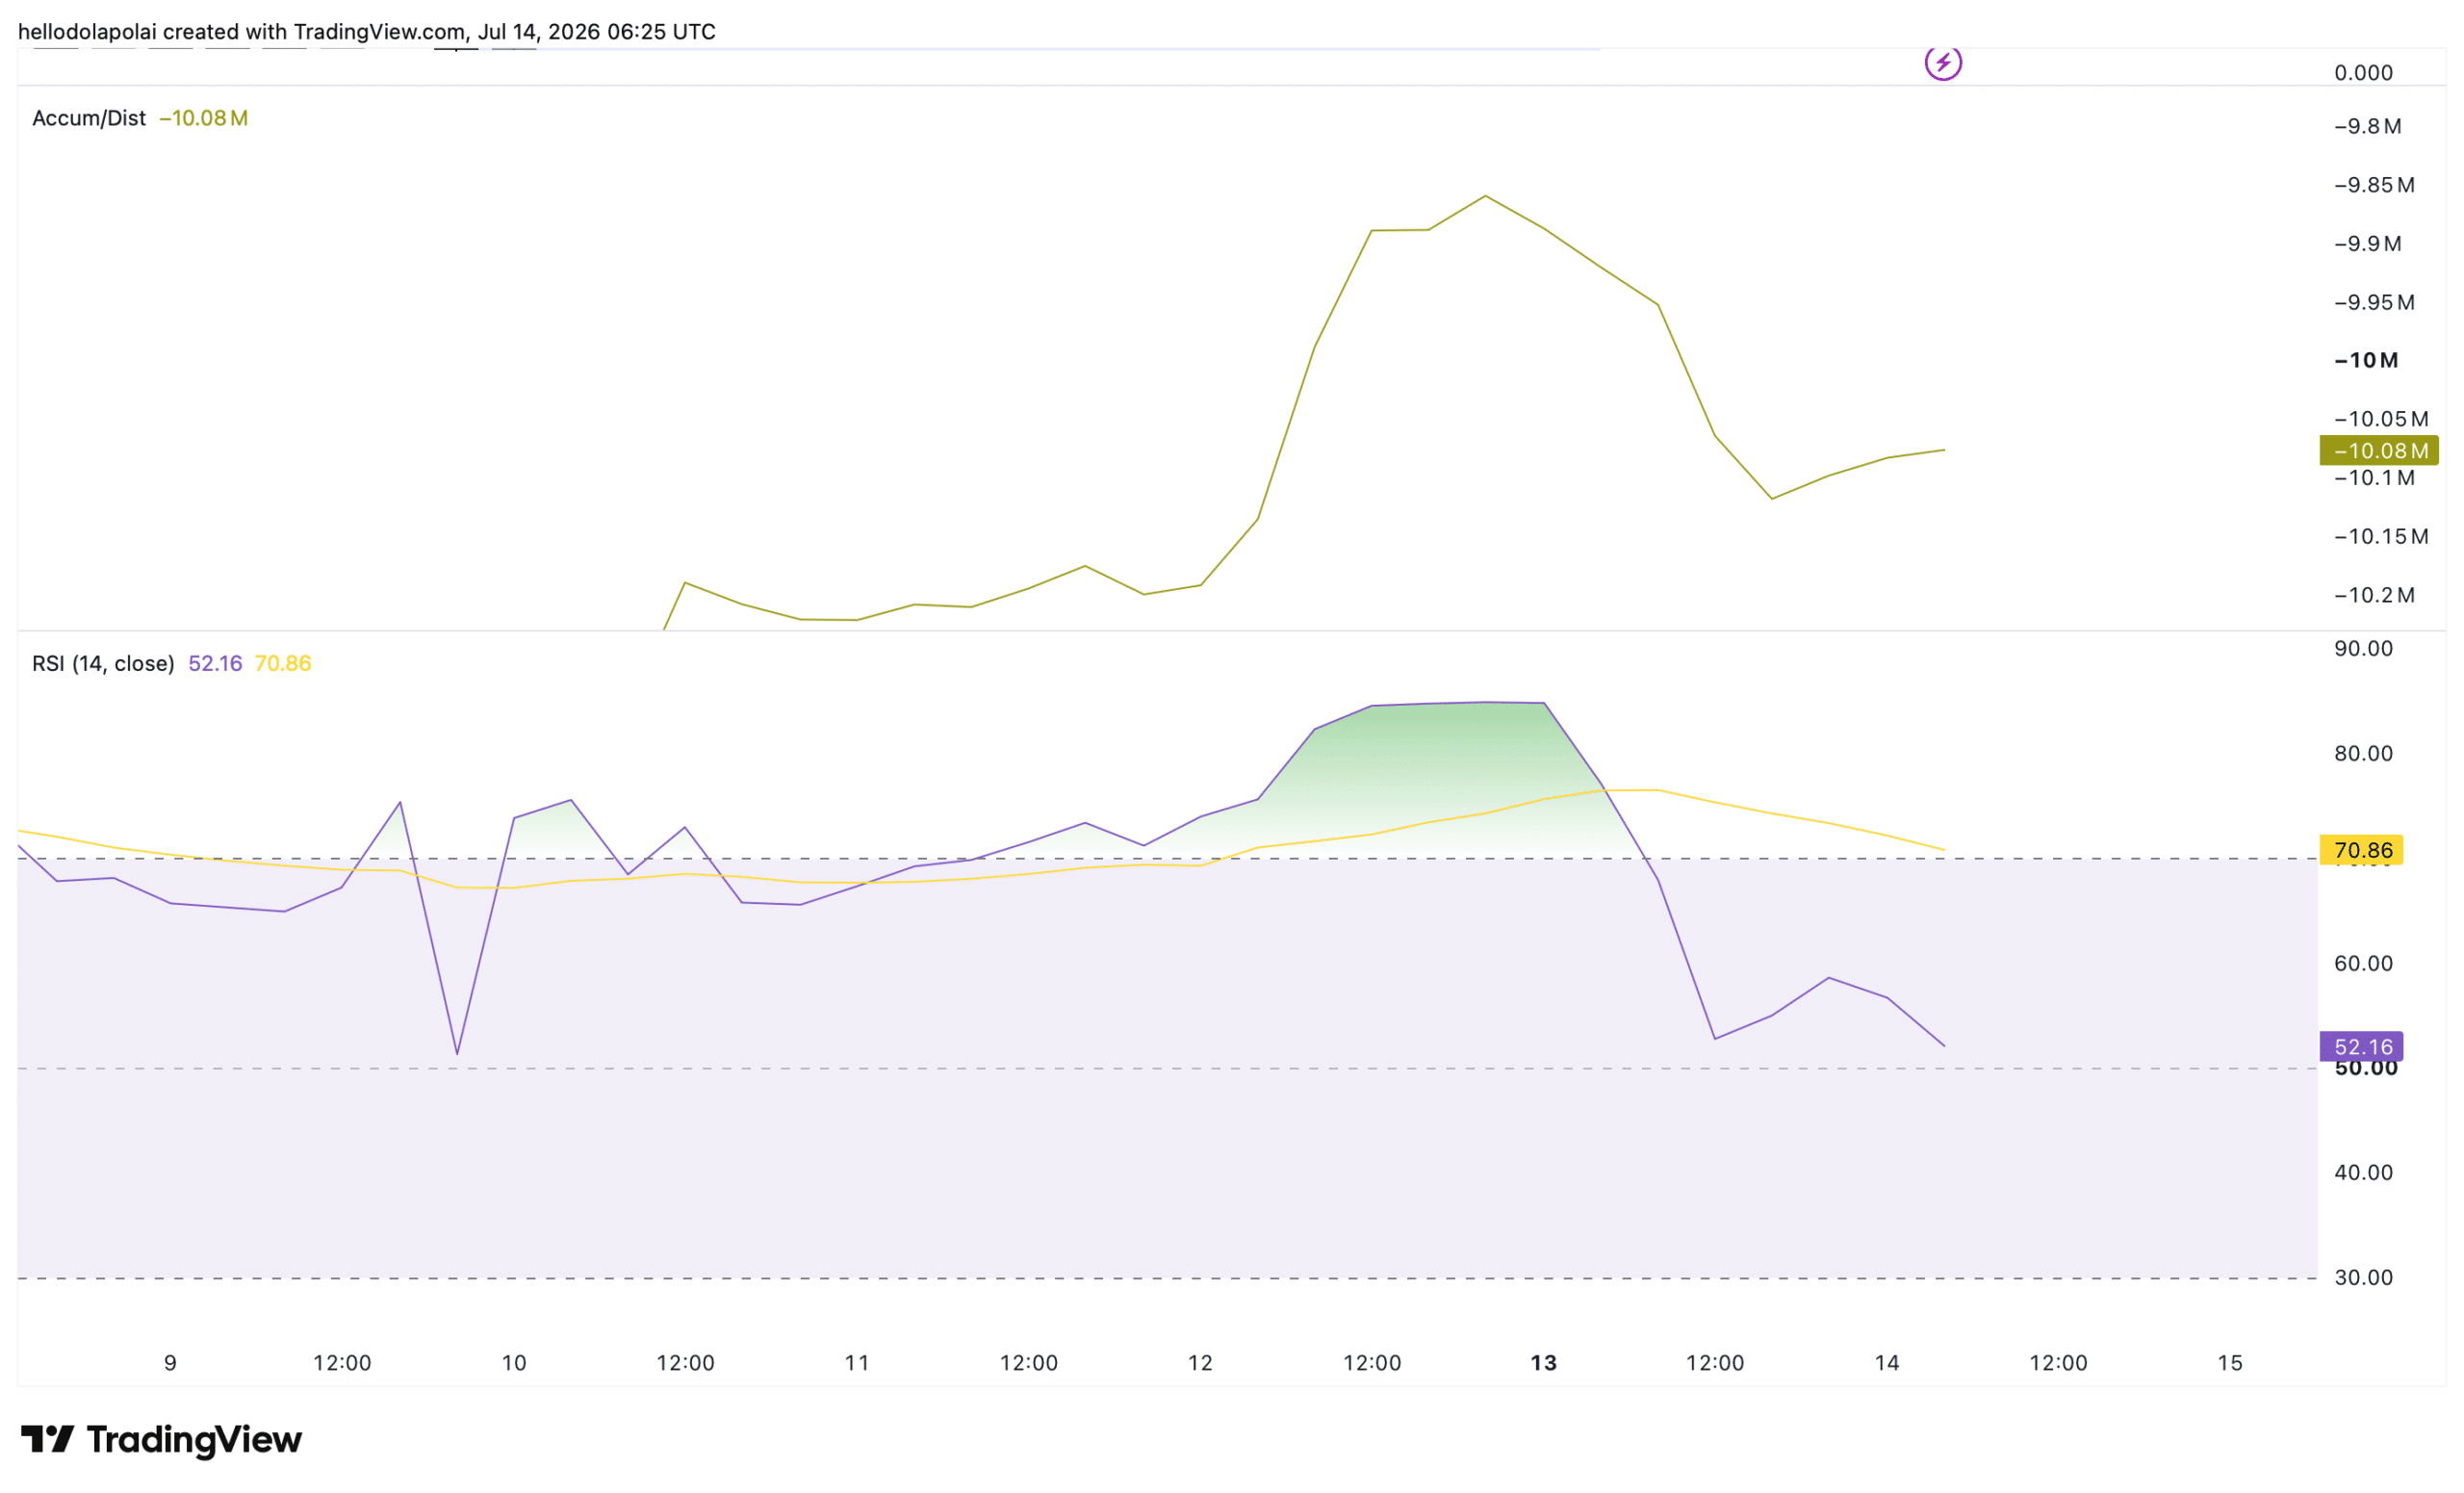
At the time of this report, it was trending slightly upward even as prices fell, a divergence that suggests a modest step-up in buyer activity within the period.
Source: TradingView

Likewise, the relative strength index (RSI) is holding within the bullish 50 to 70 band at a reading of 52.

The RSI measures the speed and magnitude of recent price moves, and a reading sitting right on the midline points to neutral, relaxed sentiment rather than a decisive bearish shift.

The balance suggests the price is likely to settle around this level, which coincides with the demand zone.

Sell pressure eases across the Spot market

Spot market data points to easing sell pressure so far. Spot netflow hit its highest net sales on the 12th of July as sellers dominated and net inflows reached $5.38 million.

Although sellers still hold the upper hand, the netflow has plunged to just $391,000, more than ten times below the earlier reading.
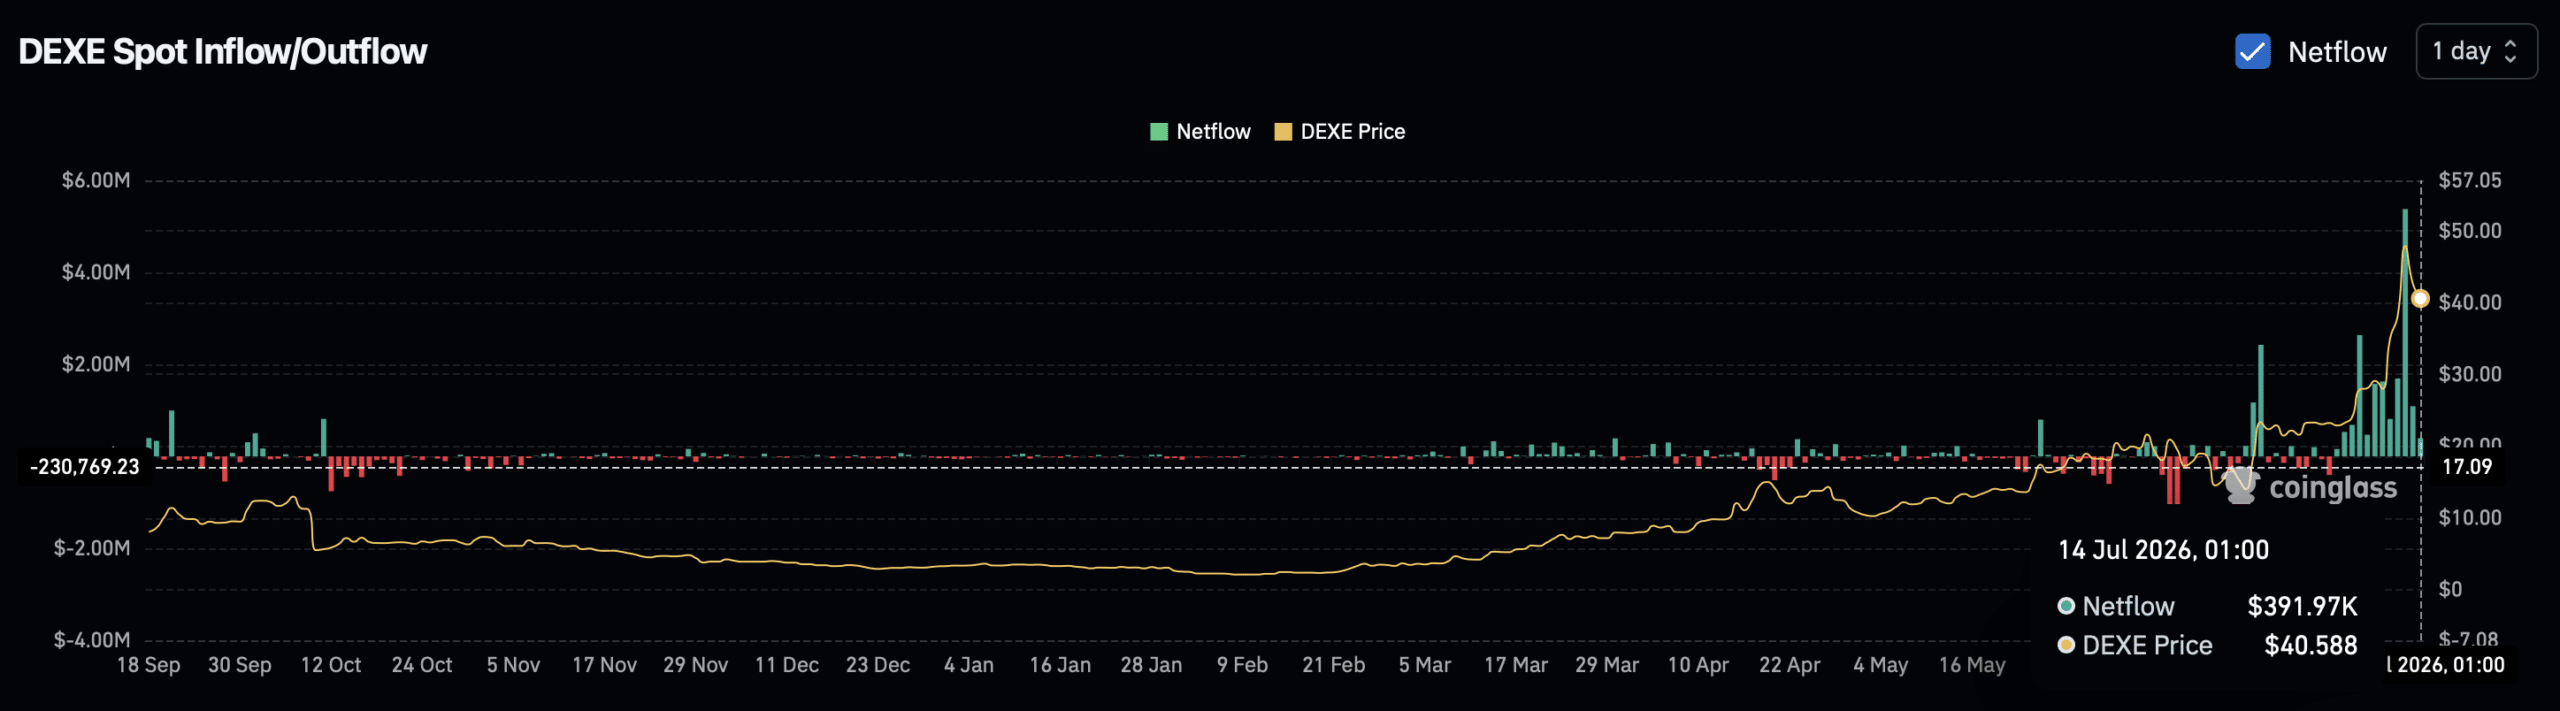
Source: CoinGlass

This matters because it shows seller strength has weakened sharply on a netflow basis while buyers step in.


Final Summary

  • DeXe has surged more than 1,000% over the past six months, and the current 13% dip looks more like profit-taking after a strong run than a shift in trend.
  • Selling has cooled sharply over the last day, with net sales down more than tenfold from the July 12 peak, a sign that buyers may be stepping back in.


Trending Cryptos

Related Questions

QWhat are the two key demand zones mentioned in the article that could influence DeXe's price?

AThe article mentions Demand zone 1 as the first line of support, and Demand zone 2 as a secondary cushion should selling pressure increase and break the first level.

QWhat do the doji candles (gravestone and dragonfly) observed on DeXe's chart indicate?

AThe gravestone doji indicated intense sell pressure as price attempted to rise, while the dragonfly doji signaled that bulls were stepping back in, exposing a standoff between buyers and sellers.

QWhy does the article suggest the current pullback might be temporary based on trading volume data?

AVolume decreased by 36% alongside the falling price, which often signals weak momentum behind the move and opens room for buyers to take control, suggesting a potential temporary pullback rather than a trend reversal.

QWhat is the significance of the divergence between the A/D (Accumulation/Distribution) line and the price action?

AThe A/D line was trending slightly upward even as prices fell, a divergence suggesting a modest increase in buyer activity (accumulation) during the period, indicating underlying strength.

QWhat key data point from the spot market suggests sell pressure is easing for DeXe?

ANet sales (netflow) have plunged dramatically, from $5.38 million on July 12th to just $391,000, a drop of more than tenfold, indicating seller strength has weakened sharply.

Related Reads

Why Didn't Oil Prices Stabilize Above $100 as Traffic Through the Strait of Hormuz Plunged Again?

Despite a significant drop in daily oil tanker traffic through the critical Strait of Hormuz in August, Brent crude oil prices have failed to stabilize above $100 per barrel, instead hovering around $90. This contrasts with traditional market logic, where a threat to a chokepoint handling roughly 20 million barrels per day (27% of global seaborne oil) should trigger a sustained supply risk premium. The article explains that the market is pricing in increased transit costs rather than an imminent, complete supply cutoff. Investors currently believe multiple buffers can absorb the shock: strategic and commercial inventories, the potential for coordinated stock releases, available OPEC+ spare capacity, and alternative export routes from the Gulf. Furthermore, workarounds like ship-to-ship transfers outside the Strait and route adjustments by buyers and shippers add resilience, though at a higher cost for insurance, financing, and longer voyages. The underlying U.S.-Iran tensions frame this reassessment as a problem of cost allocation across the supply chain. The price action suggests traders are awaiting clearer signals—such as a military escalation, sustained Iranian attacks, or stricter enforcement of secondary sanctions on buyers—before pricing in a worst-case, long-term disruption scenario. In the longer term, the episode is accelerating investments to reduce dependency on the Strait, such as expanded storage and pipeline infrastructure, which will embed higher costs into the energy system. While Brent may remain range-bound for now, the real-time impact of the Hormuz risk is likely appearing first in freight rates, insurance premiums, and regional product spreads like diesel crack margins. The stability of current prices depends on how much longer these existing buffers can effectively absorb the mounting transit costs and logistical friction.

marsbit7m ago

Why Didn't Oil Prices Stabilize Above $100 as Traffic Through the Strait of Hormuz Plunged Again?

marsbit7m ago

BONK Crypto Treasury Company Has Only $2.14 Million Cash Left, 70% of Revenue Comes from Founder's Own Platform

BONK Inc. (BNKK), the NASDAQ-listed company associated with the Solana meme coin BONK, reported stark financials for the first half of the year. While revenue skyrocketed 6,218% year-over-year to $5.5 million, the company posted a net loss of $7.88 million and its cash reserves plummeted to just $214,000. Its auditors issued a "going concern" warning, citing cumulative losses of $191.4 million, negative operating cash flow, and critically low liquidity. A critical detail is that $3.92 million, or 71%, of its revenue came from an "affiliate revenue share" with LetsBonk.fun, a meme coin launchpad. This platform is linked to founder Mitchell Rudy, whose entity, Lucky Dog Holdings, beneficially owns approximately 40.2% of common stock and all C Series preferred shares. These preferred shares grant the holder the right to elect half of the company's board. The company's financial structure is further intertwined with Rudy; it sold $50 million worth of stock to his entities, accepting payment in BONK tokens. Fluctuations in the value of these and other held digital assets led to an $8.17 million unrealized loss, the primary driver of the net loss. With operating cash outflows of $4.17 million for the half-year, the remaining cash covers roughly nine days of operations at the current burn rate, highlighting severe financial strain despite top-line growth.

marsbit39m ago

BONK Crypto Treasury Company Has Only $2.14 Million Cash Left, 70% of Revenue Comes from Founder's Own Platform

marsbit39m ago

CryptoQuant Noted a Signal of a Bitcoin Reversal

CryptoQuant has highlighted a potential reversal signal for Bitcoin, suggesting the bearish phase might be nearing its end as on-chain metrics show initial signs of spot demand recovery. Their analysis indicates that the 30-day spot demand metric has recovered from -206,000 BTC in late July to approximately -5,000, close to turning positive for the first time since February 2026. Historically, such a reversal has been followed by a median 60-day price gain of 18.1%, with a win rate of 78% (increasing to 87% when valuations are depressed). However, they caution that this is a favorable sign, not a guarantee. Analysts from Bitfinex Alpha note that two of three conditions for a sustainable Bitcoin recovery are already met: improved Federal Reserve rate expectations and relatively accommodative financial conditions, thanks to easing inflation and reduced odds of a near-term rate hike. The missing third catalyst is a capital rotation from traditional markets (like stocks and AI infrastructure) into cryptocurrencies. If this occurs, Bitcoin could reclaim $70,000. Conversely, continued negative flows might see support tested around $57,000. Current headwinds include significant weekly outflows from US spot Bitcoin ETFs (roughly $385 million) and reduced stablecoin supply. Wintermute offers a more cautious outlook, pointing to the same large ETF outflows and ongoing miner selling pressure. They note that Bitcoin has failed to rally despite the improved Fed outlook, which is typically bullish for risk assets. As an example, they cite miner Riot Platforms, which sold a substantial portion of its Bitcoin reserves in Q2 as its mining cost (~$91,000 per BTC) remains far above the current market price, forcing sales for liquidity. This combination of ETF outflows and miner selling is suppressing new demand.

cryptonews.ru41m ago

CryptoQuant Noted a Signal of a Bitcoin Reversal

cryptonews.ru41m ago

Is a Strong Ruble Good? Not for the Budget: Treasury Already Short 1.5 Trillion

The Russian budget has lost about 1.5 trillion rubles in revenue since the start of 2026 due to the ruble being stronger than the government's planned exchange rate. The budget was based on an average annual rate of 92.2 rubles per US dollar, but the actual average for the first seven and a half months was just 76.9 rubles. This discrepancy creates a significant shortfall, as every ruble of appreciation against the dollar reduces annual budget revenues by 140–160 billion rubles. When accounting for oil and gas revenues, the sensitivity is even higher, with potential annual losses reaching up to 2.5 trillion rubles. So far this year, the budget has already missed out on roughly 1.7 trillion rubles. The ruble's exchange rate has shown considerable volatility in 2026, ranging from a low near 71 rubles per dollar in May to over 85 rubles by mid-August. Despite this recent weakening, the year's average remains well below the budget target, creating a structural deficit in oil and gas revenues. Forecasts suggest the final average rate for 2026 will be around 80–82 rubles, which would result in a budget shortfall of about 1.6 trillion rubles. A strong ruble reduces import costs and inflation but also cuts the ruble earnings of exporters and threatens the funding of social obligations. The gap between the planned and actual rate is attributed not only to oil price dynamics but also to the fiscal rule mechanism, which can influence the currency's direction. The Ministry of Finance recently halted foreign currency sales under this rule, removing dollar supply from the market and contributing to pressure on the exchange rate. The budget policy is now forced to adapt to a stronger ruble than originally planned.

cryptonews.ru42m ago

Is a Strong Ruble Good? Not for the Budget: Treasury Already Short 1.5 Trillion

cryptonews.ru42m ago

Trading

Spot

Hot Articles

How to Buy DEXE

Welcome to HTX.com! We've made purchasing DeXe (DEXE) simple and convenient. Follow our step-by-step guide to embark on your crypto journey.Step 1: Create Your HTX AccountUse your email or phone number to sign up for a free account on HTX. Experience a hassle-free registration journey and unlock all features.Get My AccountStep 2: Go to Buy Crypto and Choose Your Payment MethodCredit/Debit Card: Use your Visa or Mastercard to buy DeXe (DEXE) instantly.Balance: Use funds from your HTX account balance to trade seamlessly.Third Parties: We've added popular payment methods such as Google Pay and Apple Pay to enhance convenience.P2P: Trade directly with other users on HTX.Over-the-Counter (OTC): We offer tailor-made services and competitive exchange rates for traders.Step 3: Store Your DeXe (DEXE)After purchasing your DeXe (DEXE), store it in your HTX account. Alternatively, you can send it elsewhere via blockchain transfer or use it to trade other cryptocurrencies.Step 4: Trade DeXe (DEXE)Easily trade DeXe (DEXE) on HTX's spot market. Simply access your account, select your trading pair, execute your trades, and monitor in real-time. We offer a user-friendly experience for both beginners and seasoned traders.

4.5k Total ViewsPublished 2024.03.29Updated 2026.06.02

How to Buy DEXE

Discussions

Welcome to the HTX Community. Here, you can stay informed about the latest platform developments and gain access to professional market insights. Users' opinions on the price of DEXE (DEXE) are presented below.

活动图片