Auteur : Dune
Compilation : Felix, PANews
Récemment, Dune a collaboré avec Steakhouse Financial pour lancer un ensemble de données sur les stablecoins. Cet ensemble couvre des dimensions telles que la composition des détenteurs, les flux de capitaux, la classification des comportements on-chain et la vitesse de circulation, fournissant une base pour l'analyse institutionnelle, les rapports de recherche, la surveillance de la conformité et la prise de décision de haut niveau. En interprétant cet ensemble de données, Dune a publié un article révélant une partie de la réalité du marché des stablecoins. Voici les détails.
Tout le monde cite les données d'offre de stablecoins. Elles sont partout : dans chaque rapport, chaque conférence téléphonique sur les résultats, chaque audition politique. Mais au-delà du chiffre "plus de 3000 milliards de dollars en circulation", que savons-nous vraiment des stablecoins ?
Qui les détient ? Quelle est la concentration de leur propriété ? À quelle vitesse circulent-elles ? Sur quelles blockchains fonctionnent-elles ? À quoi servent-elles réellement ? S'agit-il de liquidités DeFi, de paiements, ou simplement de capitaux inactifs ?
Alors que Meta annonce son intention d'intégrer des paiements en stablecoins tiers sur sa plateforme ; que Bridge obtient l'approbation de l'OCC (Office of the Comptroller of the Currency) pour créer une banque nationale fiduciaire ; que Payoneer active la fonctionnalité stablecoin pour 2 millions de commerçants ; qu'Anchorage Digital lance un service de stablecoin conforme pour les banques non américaines. Les institutions et les régulateurs entrent en scène de manière significative, et ils ont besoin de réponses bien plus profondes qu'un simple chiffre d'offre.
Nous utilisons le nouvel ensemble de données sur les stablecoins publié par Dune pour répondre à ces questions. Voici ce que les données montrent :
Aperçu de l'offre
En janvier 2026, l'offre totalement diluée des 15 plus grands stablecoins sur les chaînes compatibles EVM, Solana et Tron a atteint 3040 milliards de dollars, soit une augmentation de 49 % en glissement annuel. L'USDT de Tether (1970 milliards de dollars) et l'USDC de Circle (730 milliards de dollars) détiennent toujours 89 % de parts de marché.
Par chaîne, Ethereum représente 1760 milliards de dollars (58 %) ; Tron 840 milliards de dollars (28 %) ; Solana 150 milliards de dollars (5 %) ; BNB Chain 130 milliards de dollars (4 %). Bien que l'offre totale ait presque doublé, la répartition par chaîne n'a guère changé au cours de l'année écoulée.
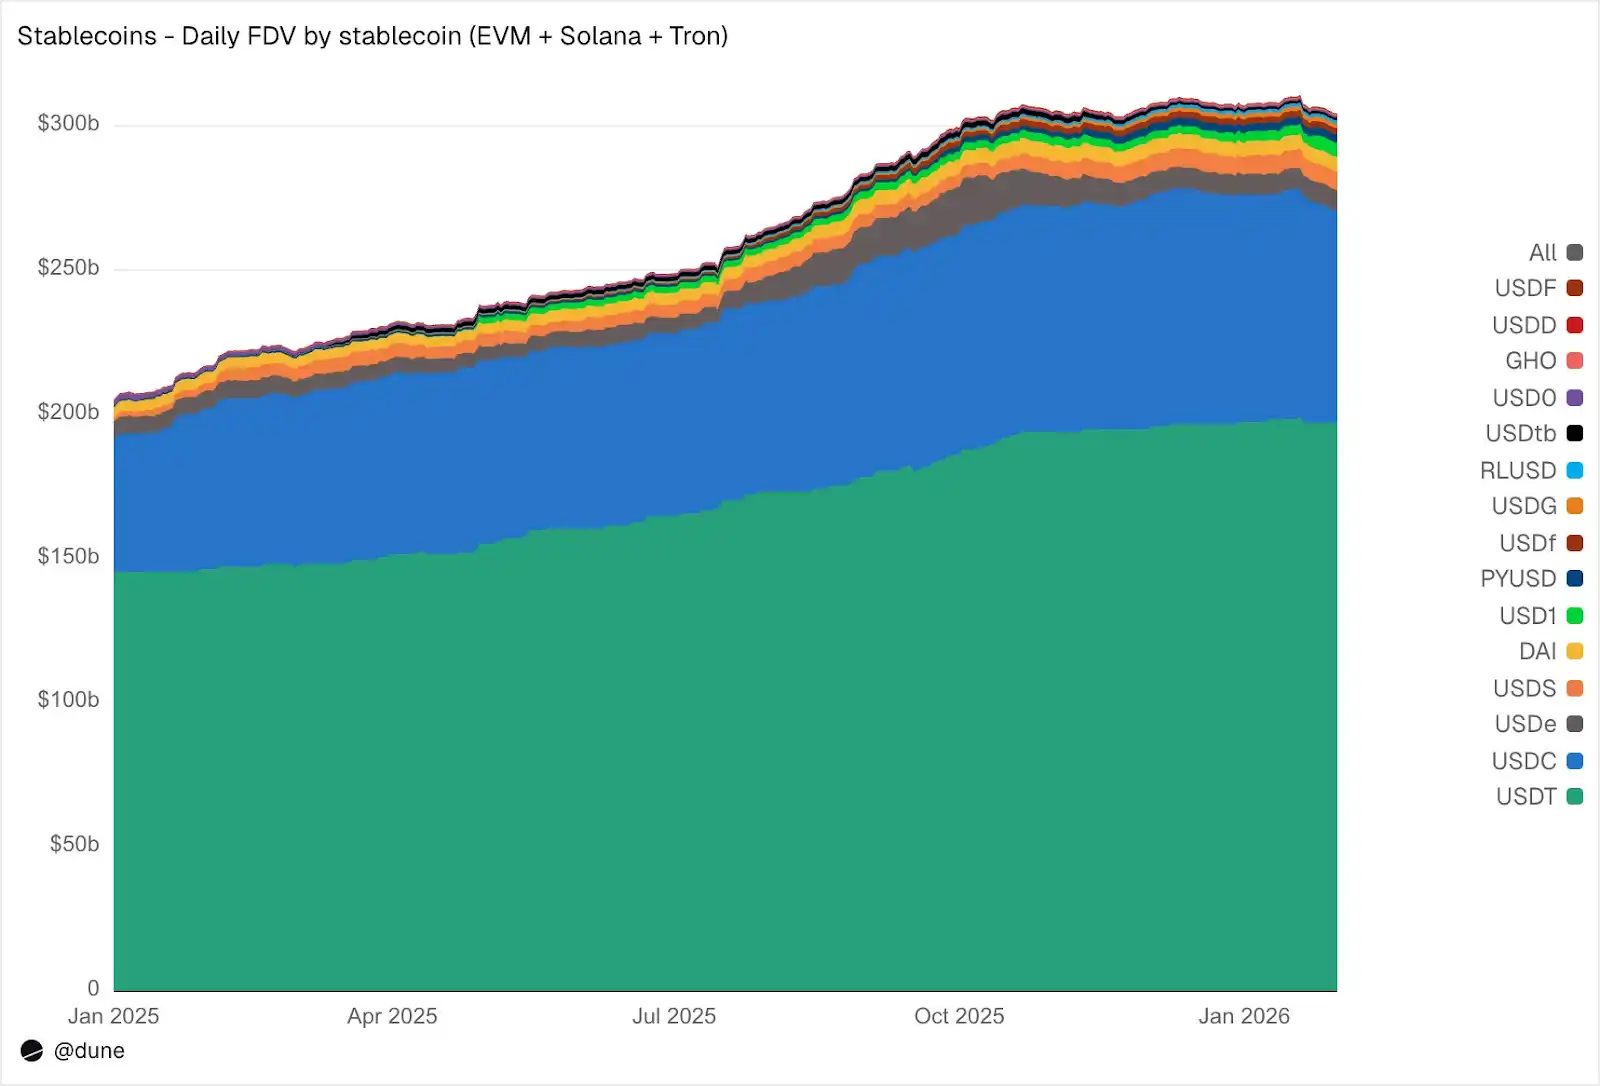
Source : Dune
Mais au-delà des deux principaux stablecoins, 2025 a été "l'année des challengers". La capitalisation boursière de l'USDS (Sky Ecosystem) a augmenté de 376 %, pour atteindre 6,3 milliards de dollars. Celle du PYUSD (PayPal) a augmenté de 753 %, pour atteindre 2,8 milliards de dollars. La capitalisation du RLUSD (Ripple) est passée de 58 millions de dollars à 1,1 milliard de dollars, soit une hausse de 1803 %. L'USDG a vu sa capitalisation multipliée par 52. Et l'USD1 est passé de zéro à 5,1 milliards de dollars.
Mais tous les challengers n'ont pas connu la croissance. L'USD0 a chuté de 66 %, et l'USDe d'Ethena, après avoir atteint son pic en octobre (presque triplé), a clôturé l'année avec une hausse de 23 %. Malgré tout, le groupe des compétiteurs sous l'USDT et l'USDC s'est considérablement élargi.
Qui détient les stablecoins
La plupart des ensembles de données sur les stablecoins ne peuvent vous donner que l'offre totale. Comme notre ensemble de données suit les soldes au niveau du portefeuille ainsi que les labels d'adresses, il peut vous dire qui détient ces stablecoins.
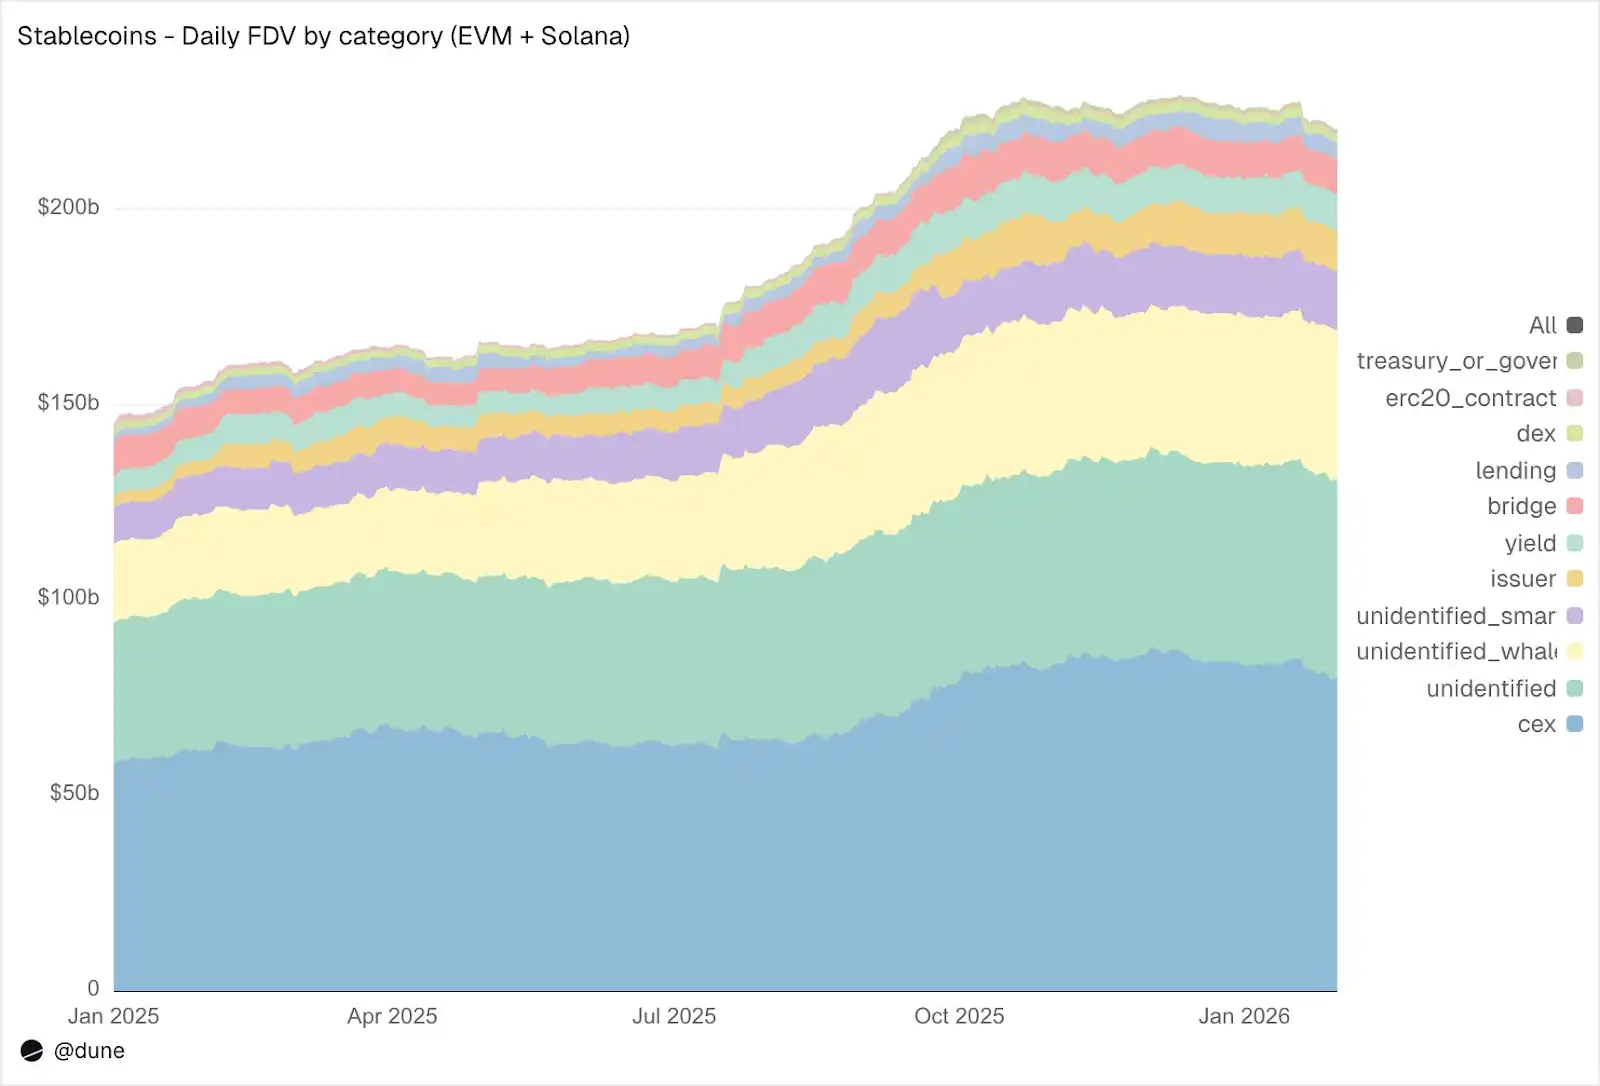
Source : Dune
Sur EVM et Solana, les CEX (Bourses Centralisées) sont la plus grande catégorie de détenteurs connus, avec 80 milliards de dollars (contre 58 milliards l'année dernière). La fonction première des stablecoins reste l'infrastructure de trading et de règlement sur les plateformes d'échange. Les portefeuilles de baleines détiennent 39 milliards de dollars. Les avoirs dans les protocoles de rendement ont presque doublé, atteignant 9,3 milliards de dollars, reflétant la croissance des stratégies de rendement on-chain. Les adresses des émetteurs (trésorerie et contrats de minting/burning) sont passées de 2,2 milliards de dollars à 10,2 milliards de dollars, soit une multiplication par 4,6, reflétant directement le volume de nouvelle offre entrant sur le marché.
Concernant la qualité du labelling : seulement 23 % de l'offre se trouve dans des adresses totalement non identifiées. Pour des données on-chain, il s'agit d'un taux d'identification extrêmement élevé. Et cela est crucial pour comprendre les sources réelles de risque des stablecoins.
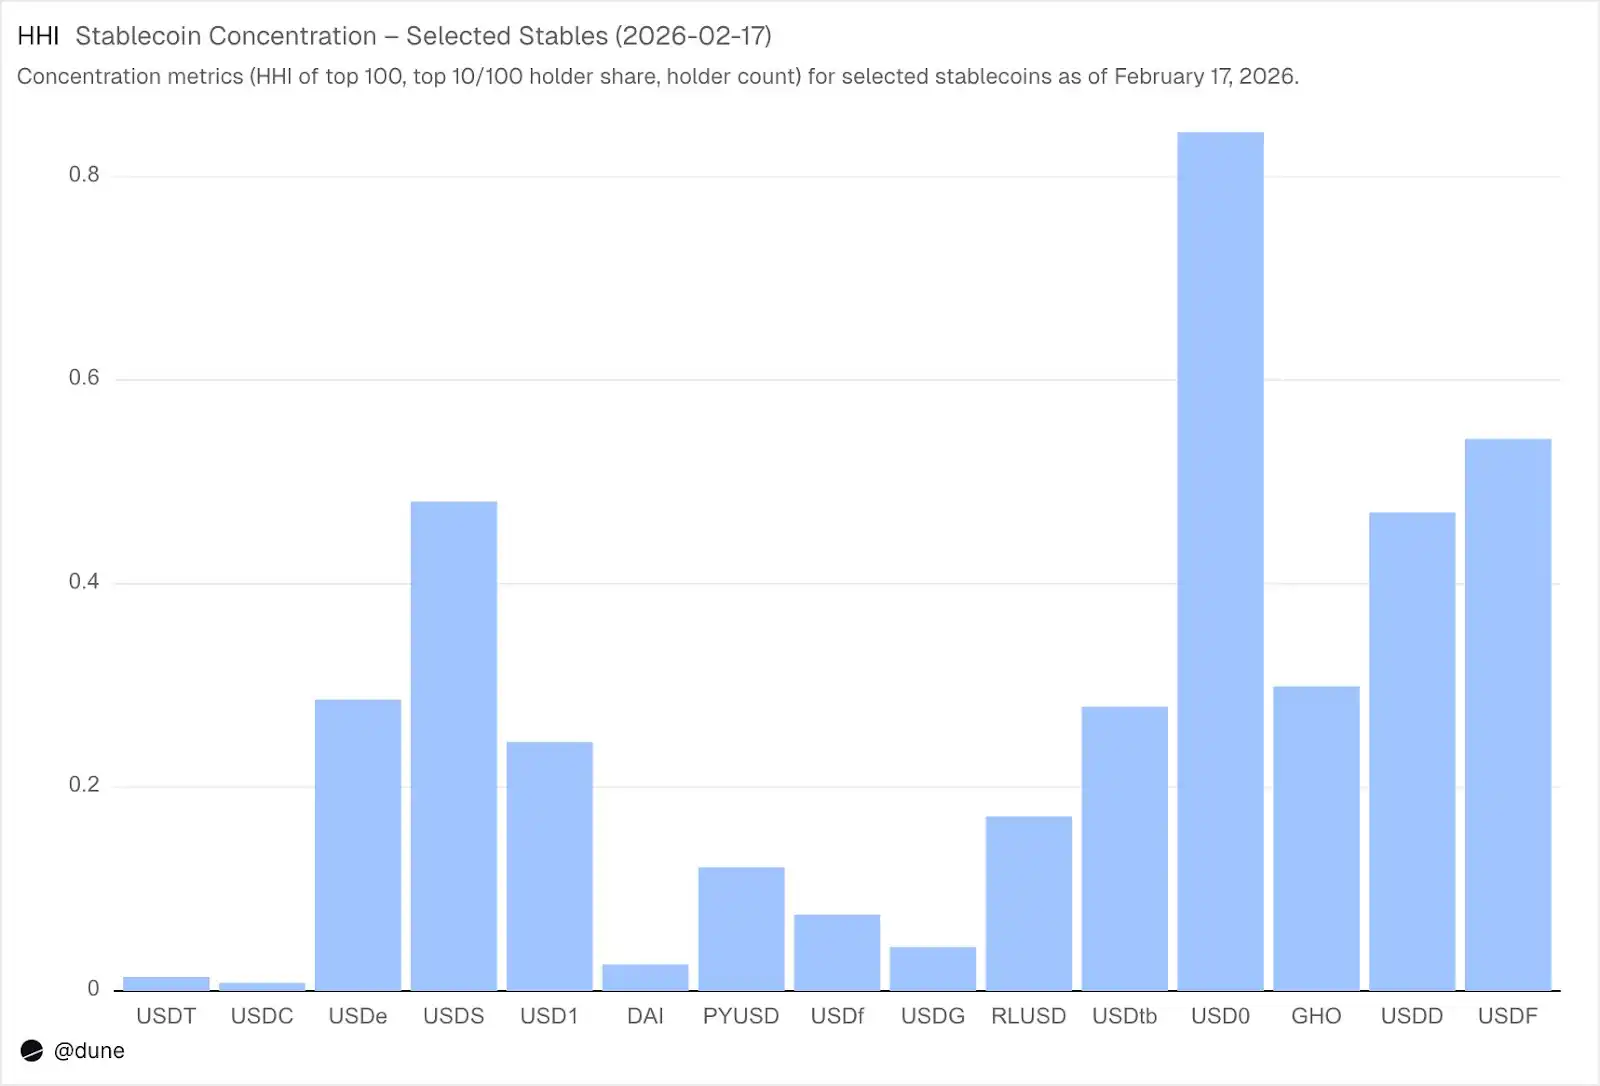
1,72 milliard de détenteurs, mais une concentration extrême
En février 2026, 172 millions d'adresses indépendantes détenaient au moins l'un de ces 15 stablecoins. L'USDT en compte 136 millions, l'USDC 36 millions et le DAI 4,7 millions. La distribution de ces trois stablecoins est très large : leurs 10 premiers portefeuilles ne détiennent que 23 à 26 % de l'offre, avec un HHI (Indice Herfindahl-Hirschman, indicateur standard de concentration économique, 0 signifiant parfaitement dispersé, 1,0 un seul détenteur) inférieur à 0,03.
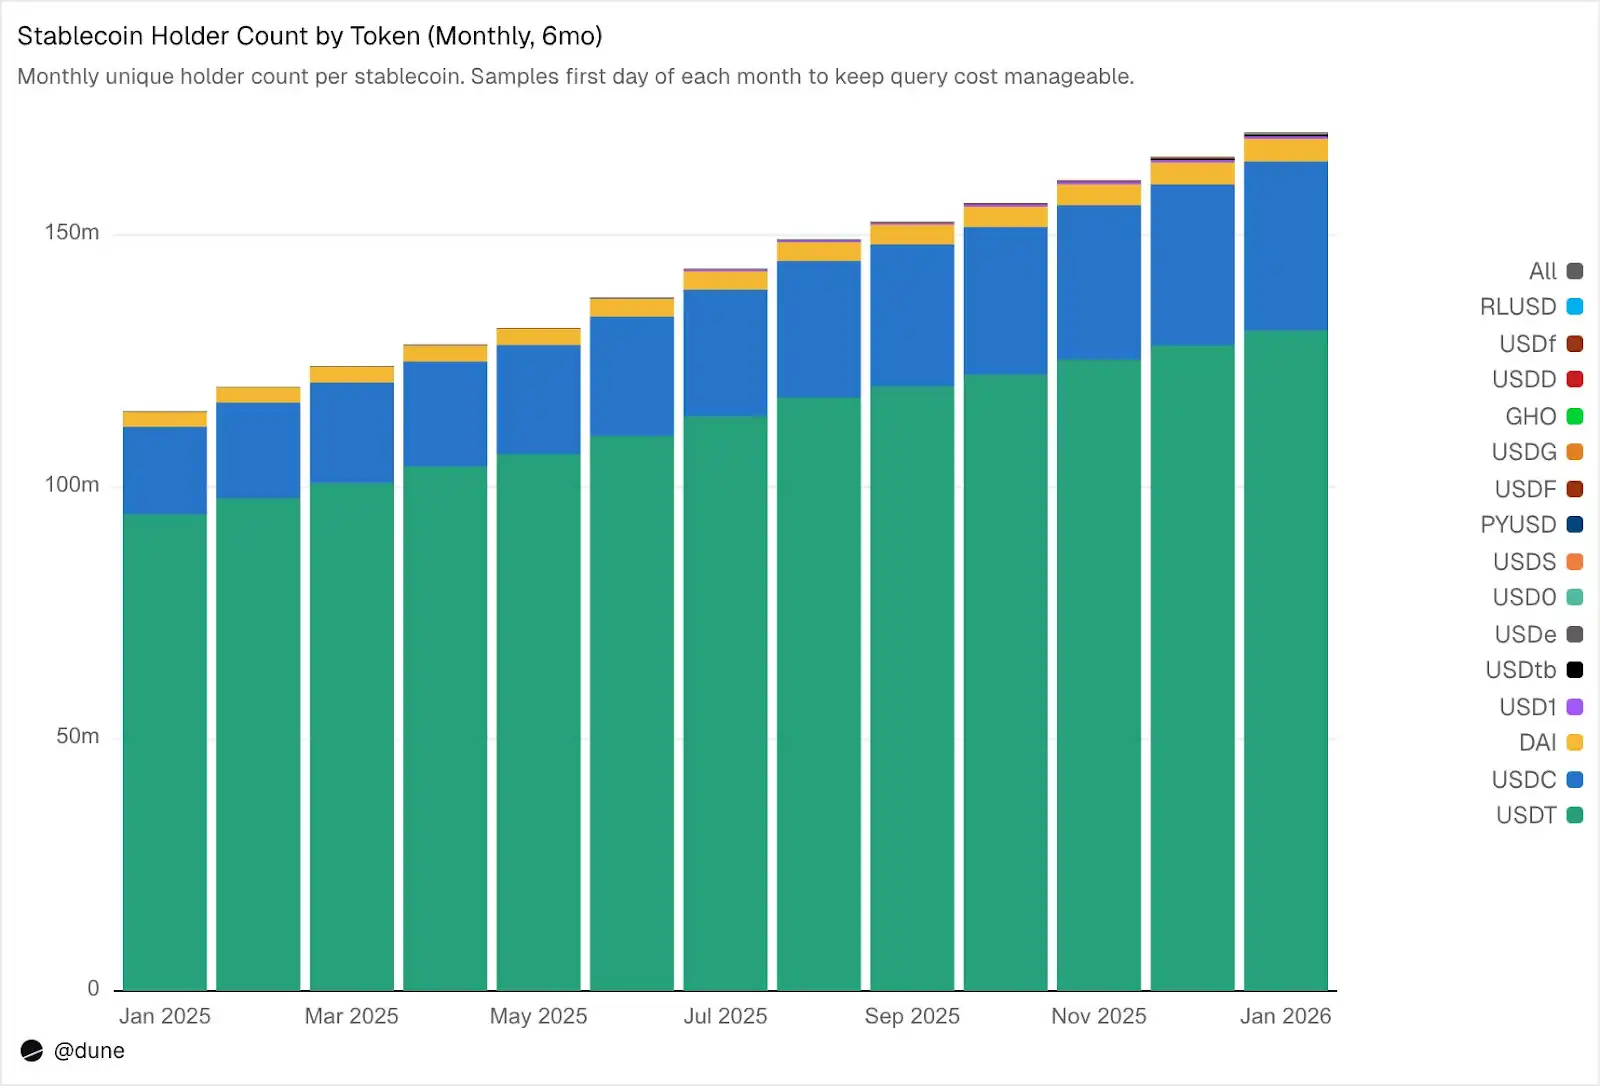
Source : Dune
Cependant, la situation est totalement différente pour les autres stablecoins. Les 10 premiers portefeuilles détiennent 60 à 99 % de l'offre. L'USDS, bien qu'ayant une circulation de 6,9 milliards de dollars, est concentré à 90 % dans 10 portefeuilles (HHI 0,48) ; L'USDF est concentré à 99 % dans les 10 premiers (HHI 0,54) ; L'USD0 est le plus extrême, 99 % concentré dans les 10 premiers (HHI 0,84), ce qui signifie que même parmi ces gros détenteurs, l'offre est dominée par un ou deux portefeuilles.
Source : Dune
Cela ne signifie pas que ces stablecoins sont problématiques, certains sont nouveaux, d'autres le sont intentionnellement pour des raisons institutionnelles. Mais cela signifie que leurs données d'offre doivent être traitées différemment de celles de l'USDT ou de l'USDC. La concentration affecte le risque de dé-peg, la profondeur de liquidité, et si l'offre reflète une demande naturelle ou celle de quelques grands participants. Ce type d'analyse n'est possible que lorsque l'on dispose des soldes de tous les détenteurs, et non pas seulement des données agrégées d'événements de minting/burning.
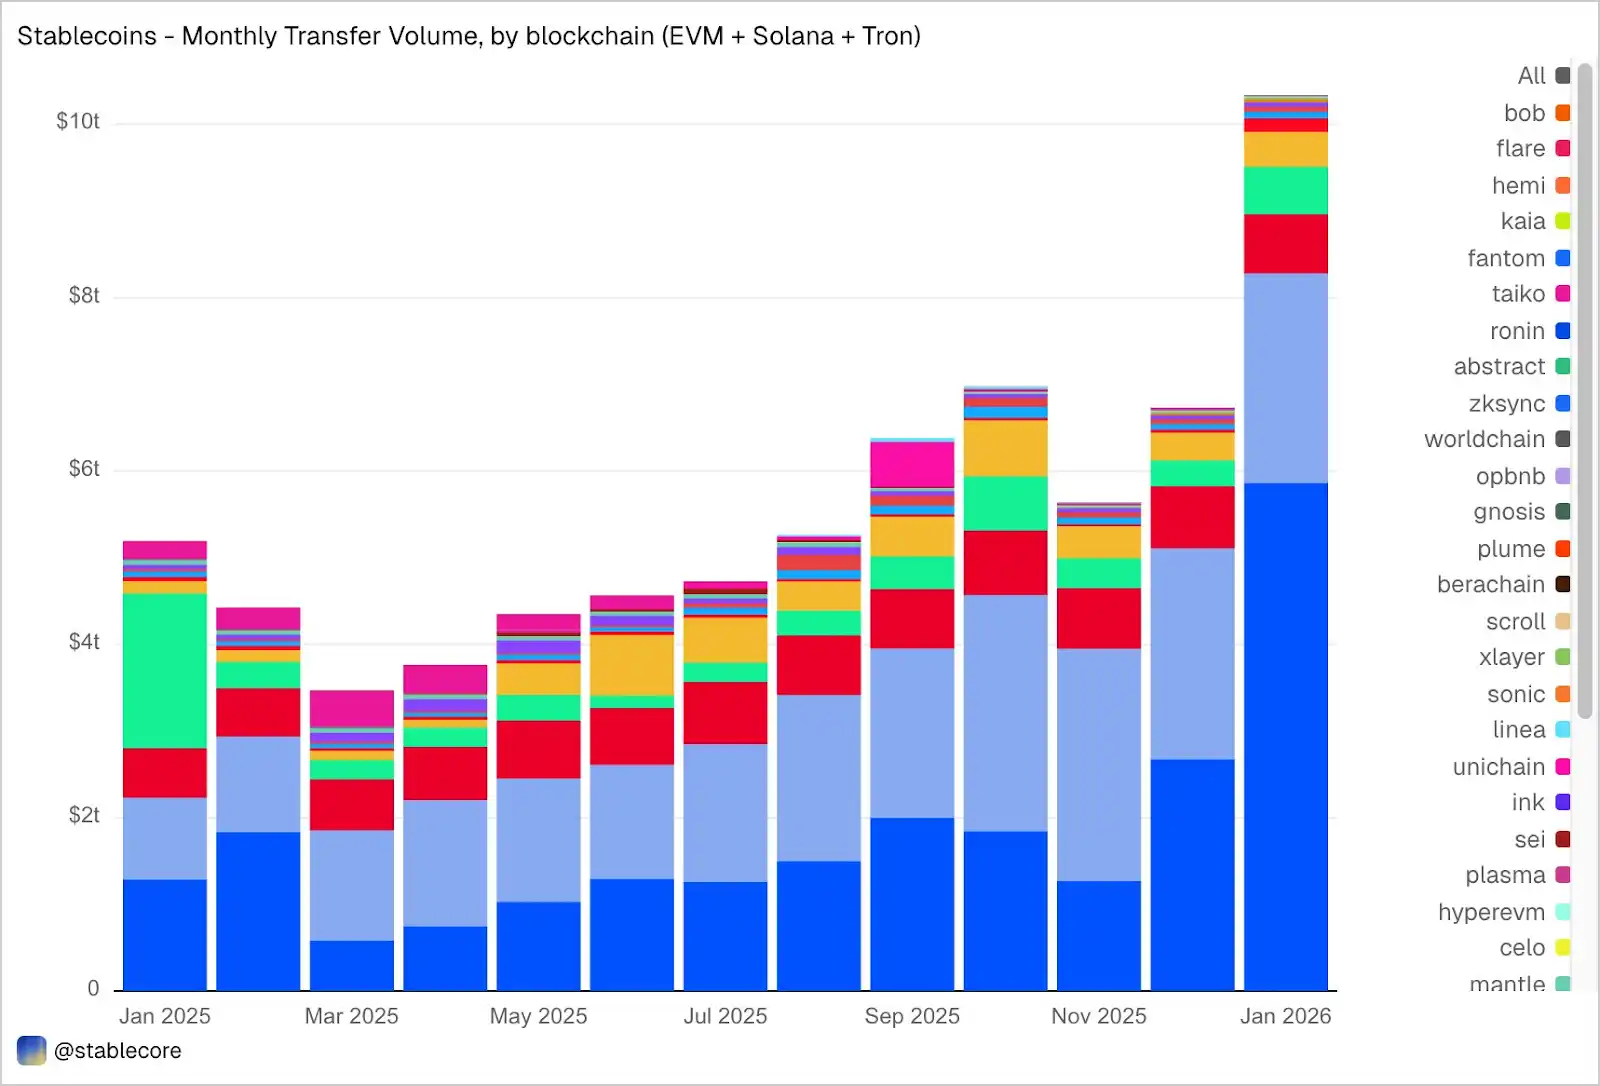
Volume des transferts en janvier : 10,3 billions de dollars
Le volume des transactions de stablecoins sur EVM, Solana et Tron a atteint 10,3 billions de dollars en janvier, plus du double de janvier 2025. La répartition du volume on-chain est frappante et radicalement différente de la répartition de l'offre : Base, avec une offre de seulement 4,4 milliards de dollars, arrive en tête avec 5,9 billions de dollars de volume ; Ethereum a un volume de 2,4 billions de dollars ; Tron 682 milliards de dollars ; Solana 544 milliards de dollars ; BNB Chain 406 milliards de dollars.
Source : Dune
Par jeton, l'USDC domine avec 8,3 billions de dollars, presque 5 fois plus que l'USDT (1,7 billion de dollars), bien que son offre soit 2,7 fois plus petite que l'USDT. La vitesse et la fréquence des transferts de l'USDC sont clairement beaucoup plus élevées que celles de l'USDT. Le volume du DAI est de 138 milliards de dollars, celui de l'USDS de 92 milliards de dollars et celui de l'USD1 de 43 milliards de dollars.
Il est important de noter que ces données sont objectives et neutres. L'ensemble de données ne pré-filtre pas les transferts en fonction d'une interprétation fixe de l'activité économique "réelle", donc le total peut inclure des flux liés à l'arbitrage, aux robots, au routage interne ou à d'autres comportements automatisés. Notre objectif est de présenter une image objective complète de l'activité on-chain, permettant aux utilisateurs d'appliquer leurs propres critères de filtrage de manière flexible. Par exemple, supprimer le volume de transactions généré par des robots, séparer l'utilisation naturelle, ou définir des mesures d'activité transactionnelle plus conformes à la réalité.
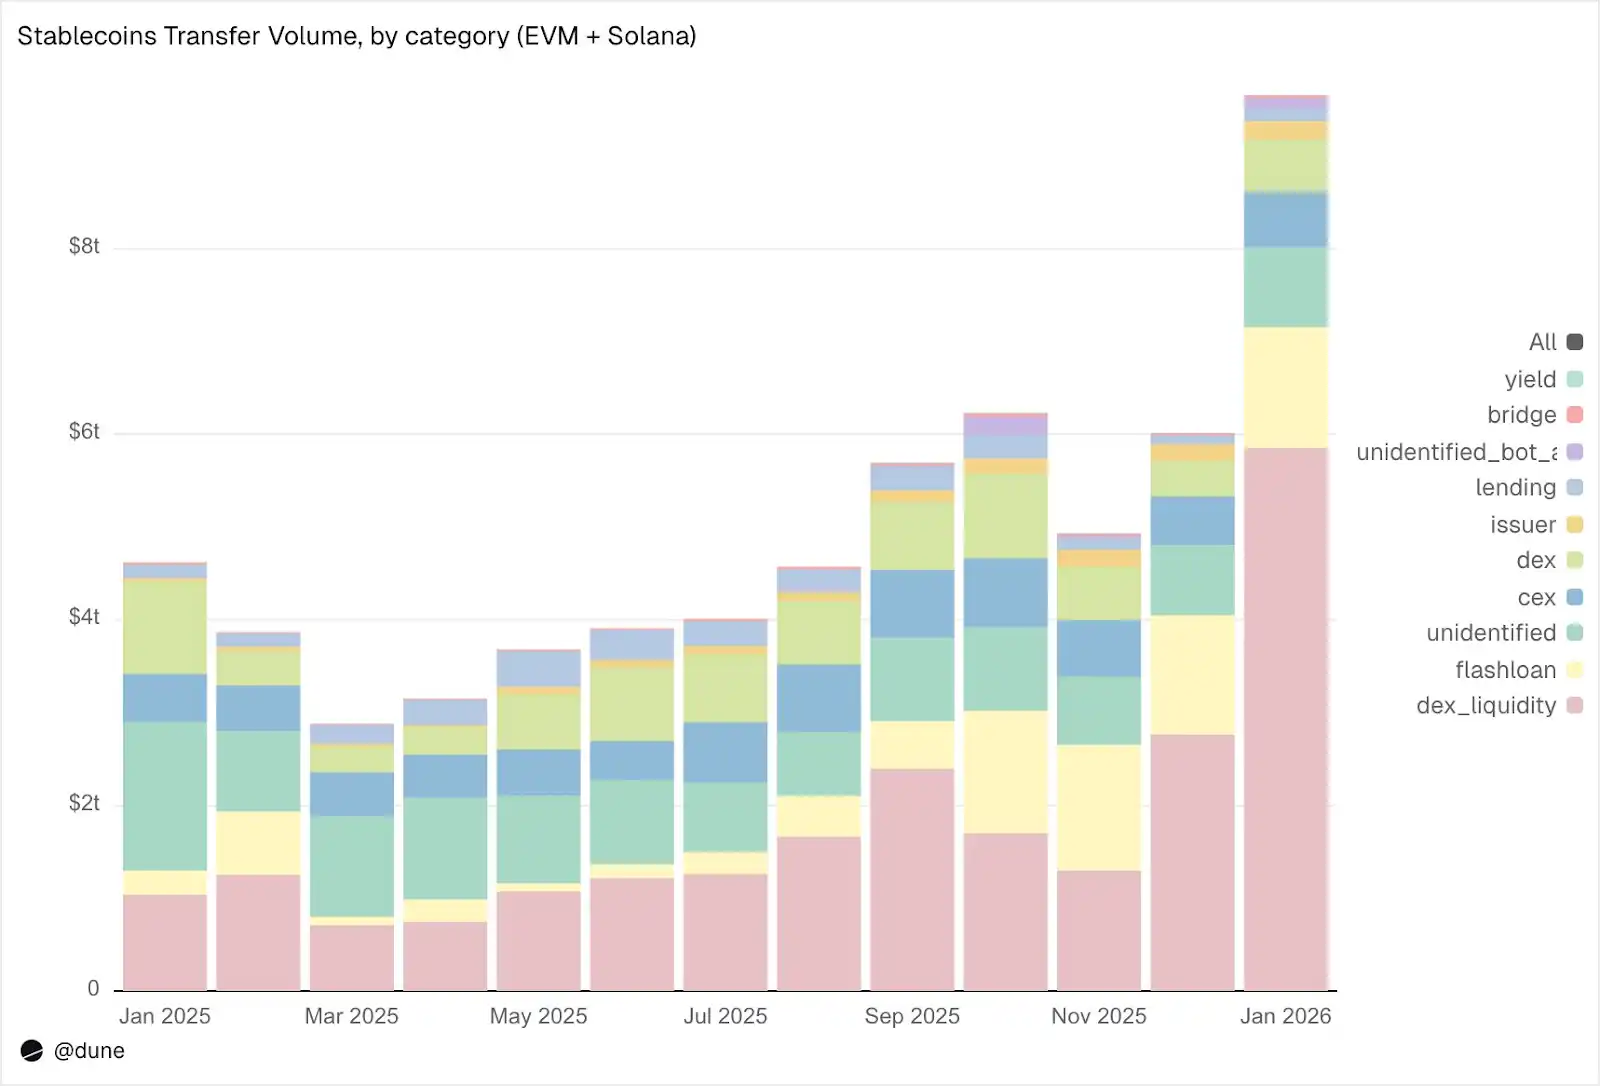
Que font réellement les stablecoins ?
Les transferts de cet ensemble de données ne sont pas seulement étiquetés comme "volume", mais sont également classés par activité on-chain spécifique :
Détail pour janvier :
1. Infrastructure de marché (Trading DEX et Liquidité) :
Fourniture et retrait de liquidités sur DEX : 5,9 billions de dollars. C'est le plus grand cas d'usage unique, reflétant le rôle des stablecoins comme actif de base pour le market-making on-chain.
Échanges sur DEX (Swaps) : 376 milliards de dollars. Activité de trading directe via les automated market makers.
Ces deux catégories indiquent ensemble que les stablecoins servent principalement de collatéral de trading et d'infrastructure de liquidité. Il est à noter que le volume est concentré sur des activités incitatives (comme le yield farming et l'optimisation active du capital) plutôt que sur une pure demande de trading.
2. Effet de levier et efficacité du capital (Emprunt + Flash Loans)
Flash loans (emprunt et remboursement) : 1,3 billion de dollars. Boucles automatisées d'arbitrage et de liquidation.
Activité de prêt : fourniture, emprunt, remboursement, retrait, 137 milliards de dollars. Représente l'efficacité du capital à court terme et le crédit structuré on-chain.
3. Canaux d'accès (CEX et Ponts)
Flux CEX : dépôt (224 milliards de dollars), retrait (224 milliards de dollars), transfert interne (151 milliards de dollars), total 599 milliards de dollars.
Dépôts et retraits via des ponts cross-chain : 28 milliards de dollars. Ces flux indiquent que les stablecoins jouent un rôle important dans les règlements entre CEX et cross-chain.
4. Couche d'émission (Opérations monétaires)
Opérations des émetteurs : minting (28 milliards de dollars), burning (20 milliards de dollars), régulation du peg (23 milliards de dollars), autres activités, total 106 milliards de dollars. Presque 5 fois plus que les 42 milliards de dollars de la même période l'année dernière.
5. Protocoles de rendement
Activité des protocoles de rendement : 2,7 milliards de dollars. Il s'agit d'une partie plus petite mais structurellement importante, étroitement liée aux stratégies structurées et à la gestion d'actifs on-chain.
Globalement, 90 % du volume des transferts transitent par des catégories d'activité identifiées, offrant une vue détaillée de la circulation des stablecoins à chaque niveau de la stack technique on-chain.
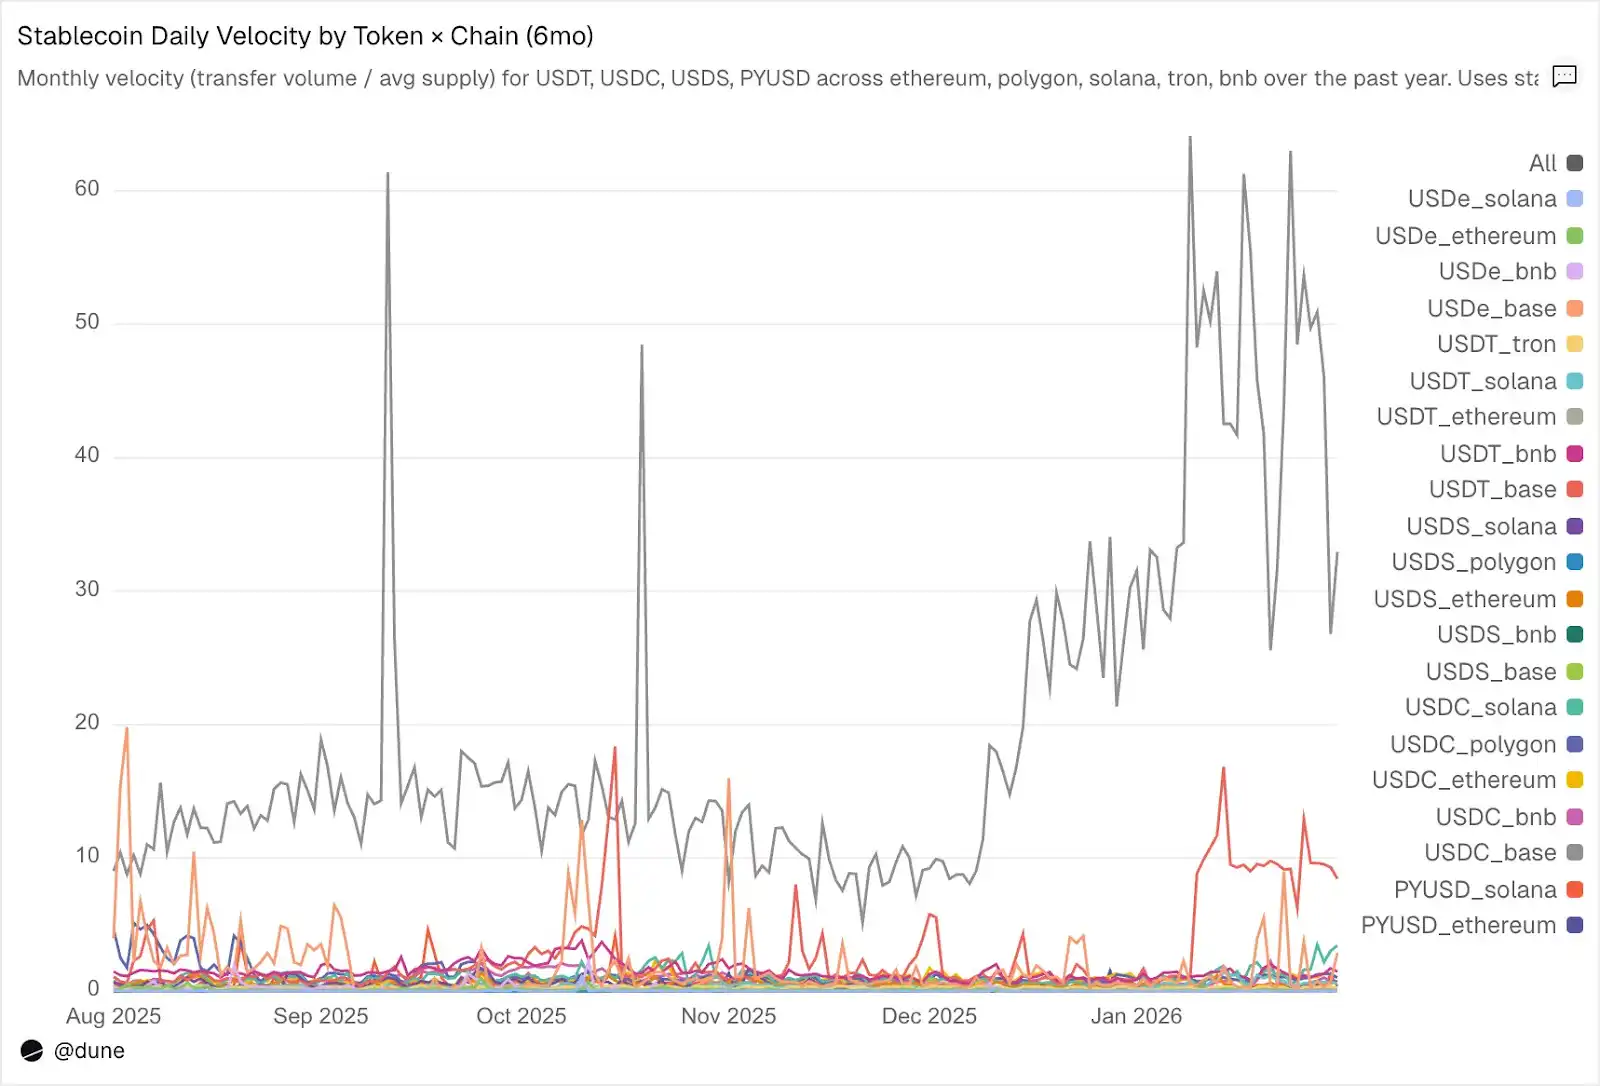
Vitesse de circulation : Un même jeton, des mondes différents
Le taux de rotation quotidien (volume des transferts divisé par l'offre) est peut-être l'indicateur le plus sous-estimé de l'analyse des stablecoins. Il reflète à quel point un stablecoin est actif en tant que moyen d'échange, au-delà du simple fait d'être détenu.
Parmi les jetons analysés, l'USDC et l'USDT se distinguent à nouveau, bien qu'il existe des différences entre eux.
Source : Dune
L'USDC sur les L2 et Solana a la vitesse de circulation la plus rapide. Sur Base, la vitesse de circulation quotidienne moyenne de l'USDC atteint 14x, un chiffre principalement dû à l'activité de trading haute fréquence dans le DeFi. Sur Solana et Polygon, elle est d'environ 1x ; sur Ethereum, elle atteint également 0,9x, ce qui signifie que presque la totalité de son offre est échangée quotidiennement.
L'USDT est le plus rapide sur BNB et Tron. La vitesse de circulation quotidienne moyenne sur BNB Chain est de 1,4x, reflétant son activité de trading active ; sur Tron, elle est de 0,3x, le volume est plus faible, mais remarquablement stable, ce qui correspond à son rôle de canal principal pour les paiements transfrontaliers. Sur Ethereum, la vitesse de circulation quotidienne de l'USDT n'est que de 0,2x, plus de 1000 milliards de dollars d'offre restant largement inactive.
L'USDe et l'USDS ont des vitesses de transaction plus lentes, ce qui est intentionnel. La vitesse de circulation quotidienne de l'USDe sur Ethereum n'est que de 0,09x, tandis que celle de l'USDS est de 0,5x. Tous deux sont conçus comme des stablecoins à rendement : l'USDe est généralement staké en sUSDe pour capturer le rendement de la stratégie delta-neutre d'Ethena ; tandis que l'USDS est déposé dans le Sky Savings Rate pour obtenir un rendement financé par le protocole. Ainsi, une grande partie de l'offre reste inactive dans des contrats d'épargne, des marchés de prêt comme Aave, ou des boucles de rendement structurées. Une faible vitesse de circulation n'est pas un désavantage, mais un avantage : ces actifs sont conçus pour accumuler des rendements, et non pour circuler.
La chaîne est plus importante que le jeton. Le PYUSD sur Solana a une vitesse de circulation quotidienne de 0,6x, soit quatre fois celle sur Ethereum (0,1x). Le même jeton, mais des modèles d'utilisation radicalement différents selon l'écosystème.
L'offre et le volume de transactions racontent chacun une partie de l'histoire. La vitesse de circulation les relie, mesurant en un seul indicateur si un stablecoin sur une chaîne spécifique fonctionne comme une infrastructure active ou existe en tant que capital inactif.
Au-delà du dollar
Cette analyse se concentre sur 15 stablecoins adossés au dollar, mais l'ensemble de données complet est plus vaste. Il suit plus de 200 stablecoins, représentant plus de 20 devises : l'euro (17 jetons, offre de 990 millions de dollars), le real brésilien (141 millions de dollars), le yen (13 millions de dollars), ainsi que des jetons libellés en naira nigérian, shilling kényan, rand sud-africain, livre turque, roupie indonésienne, dollar singapourien, etc.
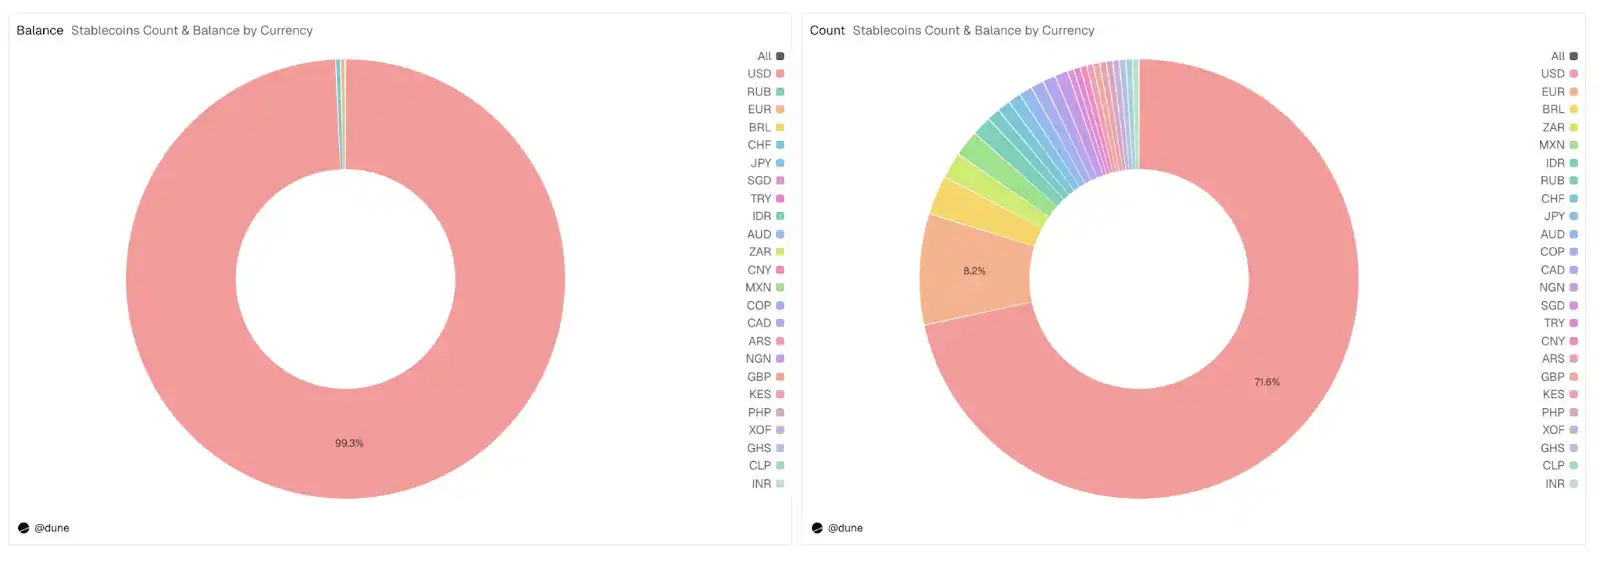
Source : Dune
L'offre de stablecoins non adossés au dollar n'est actuellement que de 1,2 milliard de dollars, mais 59 jetons sont déjà répartis sur six continents, représentant près de 30 % du total des jetons dans l'ensemble de données. L'infrastructure des stablecoins en monnaie locale se construit on-chain, et les données pour suivre son développement sont prêtes.
Lecture connexe : La guerre cachée derrière les stablecoins : Émetteurs, applications et utilisateurs, qui deviendra le "grand gagnant" ?