BofA Issues "Sell" Warning: Everyone Is Fully Invested, Everyone Is Optimistic

marsbitPublished on 2026-06-02Last updated on 2026-06-02

Abstract

Bank of America issues a "sell" warning, highlighting a market where "everyone is all-in, everyone is optimistic." The bank's analysis compares current conditions to past market bubbles, noting alarming parallels with the peak of the 2000 dot-com bubble: while the S&P 500 hits new highs, only 4% of its stocks are simultaneously at record levels. The core strategy is to "long humiliation, short hubris." Historical analysis shows that after a bubble bursts, bonds typically rally, and the worst-performing sectors during the boom often outperform post-bubble. Currently, these "humiliated" sectors are Consumer Staples, Financials, and Healthcare. The report suggests a shift in AI investment leadership from big tech "builders" (e.g., semiconductor companies) to small-cap growth "users" of AI. Fund flow data supports caution, with global equities seeing their first outflow in nine weeks, while bonds attract continuous inflows. The bank's Bull & Bear Indicator has triggered a sell signal. June presents a cluster of event risks (CPI, central bank meetings, G7 summit) that could spark a sell-off in an overextended market. Year-to-date, Bitcoin is the worst-performing major asset, implying it may not be a safe haven if the "post-bubble" scenario unfolds.

Author: Tide Research

The latest issue of BofA's Flow Show has a title that stings with every word: Post-bubble.
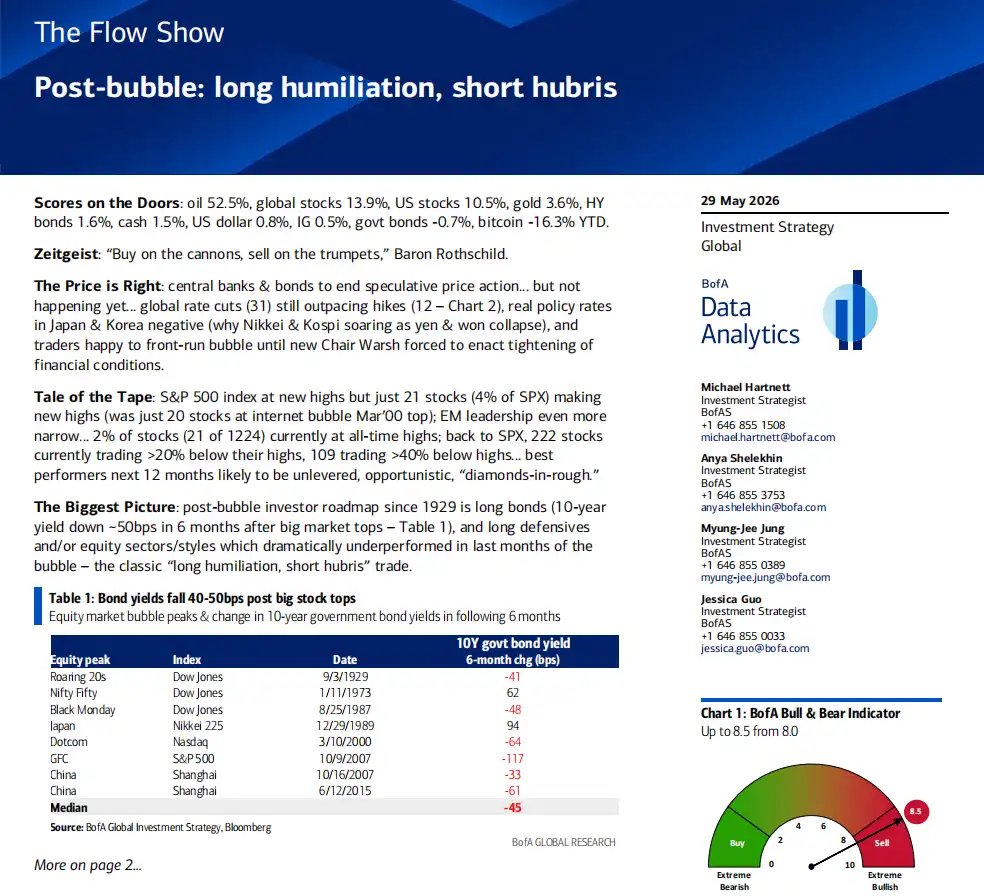
Analyst Hartnett didn't use questions or buffer words like "might" or "perhaps." In his view, the current U.S. stock market is not a "suspected bubble," but has already entered the historical script that follows a bubble's burst. He traced back from 1929 to 2015, digging out the patterns of asset performance after every major bubble peaked, then drew a roadmap for today's market.

He compressed the core trading strategy of this roadmap into one sentence: Long humiliation, short hubris.

A Set of Unsettling Data

First, look at the current "abnormalities."

The S&P 500 index is at an all-time high. This fact itself is not a problem; the problem lies in the number of stocks participating in this party: Only 21 stocks (4%) among all S&P 500 constituents are simultaneously making new highs. 222 stocks are down more than 20% from their respective highs, and 109 are down more than 40%.

Hartnett highlighted a historical comparison for this 4% figure: In March 2000, at the peak of the dot-com bubble, only 20 stocks in the S&P 500 were making new highs. In other words, today's market concentration has returned to the level seen at the peak of the dot-com bubble.

Emerging markets are even more extreme. Among 1,224 EM stocks, only 21 (less than 2%) are at their historical highs.

The index is celebrating, while the vast majority of stocks are silent.

The Historical Script After a Bubble

Hartnett systematically reviewed the market performance after every major bubble peak since 1929, concluding with two main themes.

First: After a bubble bursts, bonds almost always rise. He calculated the change in 10-year Treasury yields within six months after eight major stock market peaks, with a median decline of 45 basis points. The logic is straightforward: A bubble burst reduces risk appetite, capital floods into safe-haven assets, Treasury prices rise, and yields fall. Yields fell in six out of the eight instances, with only 1973 and 1989 being exceptions (influenced by stagflation and Japan's special environment, respectively).

Second: The sectors that suffered most during the bubble perform best after it bursts. Every bubble has its "darlings" and "orphans." After the bubble ends, the roles reverse.

Looking at a few cycles: In the Roaring Twenties of 1929, the bubble's protagonists were utilities, telecommunications, industrials, and banks. After the bubble burst, these sectors underperformed significantly, while the previously neglected energy stocks became winners. During the 2000 dot-com bubble, the Nasdaq doubled in the six months before the peak, while the S&P 500 Equal Weight Index actually fell in the final 12 months of the bubble; after the bubble burst, the Nasdaq fell 60% within a year, while the humiliated defensive sectors rebounded strongly (utilities up 25%, consumer staples up 24%), and the equal-weight S&P 500 actually rose in 2000. In the 2006-2007 China bull market, materials and industrials tripled in 12 months, only to fall 65% to 85% in the year after the bubble burst, while the previously underperforming consumer staples, utilities, and technology sectors gained strength against the trend.

Who are the "humiliated" sectors today? Hartnett gives a clear direction: Since the Nasdaq surged 80% from its low in April 2026, the worst-performing sectors have been consumer staples, financials, and healthcare. According to the historical script, they are the sectors most likely to outperform after the bubble ends.

The Next Phase of AI Investment: From "Builders" to "Users"

This is the section most enlightening for crypto and tech investors in the entire report.

Hartnett notes that technology companies' penetration in the credit market has reached a staggering level: The tech sector accounts for 10% of the U.S. investment-grade bond market and 8% of the high-yield bond market. This means tech companies are not only highly concentrated in the stock market but are also leveraging massively in the bond market.

His judgment: The leadership in AI investment is shifting. From the "spenders" (capex of large tech companies) and the "builders" (semiconductors) to the "users of AI" (the application layer). The best way to participate is through small-cap growth stocks, not by continuing to bet on large-cap tech.

The historical anchor for this analogy is the period after the "Nifty Fifty" bubble in the 1970s: From December 1974 to May 1981, small-cap growth stocks outperformed the S&P 500 by over 1,000%. Hartnett suggests a similar structural rotation may be brewing.

Fund Flows: Smart Money Quietly Turns Around

This week's fund flow data contains several notable signals.

Global equities saw a net outflow of $7 billion, the first in 9 weeks. Japanese stocks saw an outflow of $8.2 billion, the largest weekly outflow since May 2025. China funds saw an outflow of $14 billion, with cumulative outflows since January 2026 reaching $218 billion. Europe saw net outflows for seven consecutive weeks.

Meanwhile, bonds saw net inflows for the 57th consecutive week (this week: $23.6 billion). Investment-grade bonds saw inflows for eight consecutive weeks, and emerging market bonds for seven consecutive weeks. Notably, BofA's private clients made a record withdrawal from cash and a record purchase of long-term Treasury ETFs (TLT, JAAA, VGIT).

Translating this data: Institutional money is migrating from stocks to bonds, especially by extending duration. Private clients' cash allocation is at a historical low (9.6%), while their stock allocation is at a historical high (66%). Everyone is fully invested, everyone is optimistic.

This is precisely the reason for Hartnett's alarm.

Bull & Bear Indicator Triggers "Sell" Signal

BofA's Bull & Bear indicator rose from 8.0 to 8.5, moving further into the contrarian "sell" zone. This indicator triggers a sell signal when it exceeds 8.0.

Among the six components of this indicator, fund manager positioning is at the 98th percentile (extremely bullish), bond fund flows are at the 85th percentile (extremely bullish), hedge fund positioning is at the 72nd percentile (bullish), and credit market technicals are at the 77th percentile (bullish). None of the six components show pessimism.

Since 2002, this indicator has triggered 17 sell signals. Subsequently, global equities fell an average of 2% to 3% over the next two to three months, with a hit rate of about 60% and maximum drawdowns reaching 15% to 20%.

June: Event Risks Converge

Hartnett used a word: chockablock.

June 10th US CPI (expected around 4%), 11th ECB rate hike, 15th G7 summit, 16th Bank of Japan rate hike, 17th Warsh's first FOMC press conference, 18th UK by-election, plus a large window for equity issuance.

Against a backdrop where everyone is fully invested and all indicators are extremely optimistic, any "surprise" from these events could become the trigger for profit-taking. Hartnett's advice is direct: Take profits, act inversely when yields are falling and stocks are rising.

The political backdrop he provides is also noteworthy: Trump's economic approval rating has fallen to 35%, and inflation approval to 28%, both hitting new lows. The political cost of the Iran conflict is backfiring on the White House.

2026's Winners and Losers

Performance ranking year-to-date as of May 27th:

The biggest winners are Oil (+54.4%) and South Korean stocks (+111.6%). The worst performers are Bitcoin (-16.3%) and Indian stocks (-10.4%). Chinese stocks fell 7.9%, with China funds seeing cumulative outflows of $218 billion. Gold rose only 2.5%, trading flat after the war premium faded.

A counterintuitive fact: Among all major asset classes, Bitcoin is the worst-performing asset of 2026, and by a significant margin. The second-worst performer, Indian stocks, fell only about two-thirds as much as Bitcoin.

For crypto investors, this report carries an uncomfortable implication: Bitcoin is at the bottom year-to-date among all assets, still seeing weekly net outflows (this week: $1.2 billion), and within BofA's framework, the high correlation of crypto with risk assets suggests that if the "post-bubble" script truly plays out, Bitcoin may not be spared.

Disclaimer: This article is Tide Research's collation and interpretation of a third-party brokerage research report. The ratings, target prices, earnings forecasts, and related judgments cited in the article are the views of that brokerage's analyst, representing only the stance of their affiliated institution. They do not represent the views of Tide Research, nor do they constitute any investment advice.

The market carries risks, and decisions should be made independently. This article should not be used as a basis for buying or selling any securities.


Trending Cryptos

Related Questions

QAccording to the Bank of America report, what is the core trading strategy for navigating the post-bubble market?

AThe core trading strategy is 'long humiliation, short hubris,' meaning to buy assets that have been underperforming ('humiliated') and short or avoid the leading, overvalued ('arrogant') assets that were the bubble's darlings.

QWhat historical parallel does the report draw regarding the concentration of the S&P 500 index?

AThe report notes that only 4% of S&P 500 stocks are making new highs alongside the index, a level of market concentration last seen at the peak of the dot-com bubble in March 2000.

QWhich sectors are identified as the current 'humiliated' ones, likely to outperform after a bubble, according to the analyst Hartnett?

AThe 'humiliated' sectors, which have performed the worst since the Nasdaq's April 2026 low, are Consumer Staples, Financials, and Healthcare. History suggests these could be the outperformers post-bubble.

QWhat key shift in AI investment leadership does the report predict, and what is the suggested way to participate?

AThe report predicts a shift in AI investment leadership from the 'builders' (big tech capex and semiconductors) to the 'users' (application layer). The suggested best way to participate is through small-cap growth stocks, not by continuing to bet solely on large-cap tech.

QWhat signal did Bank of America's Bull & Bear Indicator trigger, and what is its historical performance after such a signal?

AThe Bull & Bear Indicator triggered a 'sell' signal after rising to 8.5. Historically, since 2002, such signals have been followed by an average 2-3% decline in global stocks over the next 2-3 months, with a hit rate of about 60% and maximum drawdowns reaching 15-20%.

Related Reads

Bitcoin Mining Farms Are Becoming AI Factories

Bitcoin mines are transforming into AI factories. This shift is driven by the convergence of three key assets from the previous crypto cycle: infrastructure, talent, and capital. Crypto mining companies like Crusoe, CoreWeave, and Bitdeer are repurposing their core competency—securing power, land, and grid connections in remote locations—to build data centers for AI clients. These firms are signing multi-billion dollar, long-term contracts with companies like Anthropic, AWS, and Microsoft, as AI's demand for reliable, high-capacity compute surpasses the profitability of Bitcoin mining. Simultaneously, crypto entrepreneurs and engineers are applying their skills to new AI ventures. Examples include OpenSea's co-founder launching OpenRouter (an AI model aggregator), and former Coinbase engineers building Fal.ai (a generative media infrastructure platform). Their experience in building scalable, global software networks translates effectively to the AI space. Furthermore, capital accumulated during the crypto boom is now fueling AI. Figures like Jed McCaleb (co-founder of Ripple) funded Voltage Park, a large-scale GPU cloud provider. Notably, some crypto investments, like FTX's early bets on Anthropic and Cursor, have generated astronomical paper returns, demonstrating how high-risk crypto capital flowed into AI before it became mainstream. The transition is not just about repurposing hardware, but about redirecting critical resources—power infrastructure, distributed systems expertise, and venture funding—to the next technological frontier: artificial intelligence.

链捕手16m ago

Bitcoin Mining Farms Are Becoming AI Factories

链捕手16m ago

Morpho Launches Fixed-Rate Product Midnight: Lenders and Borrowers Set Their Own Rates, Ending the Era of Interest Rate Models

Morpho Launches Fixed-Rate Product Midnight: Lenders and Borrowers Set Their Own Rates, Ending the Era of Algorithmic Interest Models On-chain lending has grown to $60 billion but remains minuscule compared to traditional finance's $200 trillion annual credit volume. Morpho identifies the lack of fixed rates and maturity dates as key bottlenecks. Institutions need predictability, not the passive floating rates set by algorithmic models. Midnight allows lenders and borrowers to directly quote rates, set terms, and become price makers, not takers. Fixed-rate lending is now viable due to cheaper, faster blockchains and the entry of institutions demanding control and certainty over returns, costs, and duration. Morpho Blue previously gave users control over risk; Midnight adds control over interest rates. Past attempts at on-chain fixed-rate lending failed primarily because they were built on top of floating-rate pools (creating unpredictability) or lacked sufficient active participants. Midnight avoids these pitfalls as a standalone primitive with fixed rates at its core, built upon Morpho Blue's existing large and active user base. Midnight offers distinct value: institutions gain predictable term structures and full control; fintech companies can offer tailored fixed-rate products; lenders/borrowers achieve predictability and efficiency; and curators can now differentiate by configuring both risk and interest rates. Morpho Midnight is not a replacement for Morpho Blue. The Morpho network will now feature two complementary market structures: floating-rate/open-term (Blue) for flexibility and fixed-rate/fixed-term (Midnight) for predictability. Liquidity can flow between them. The launch will be gradual, prioritizing security. Initially, it will support direct lending on Base network with one trading pair (cbBTC/USDC) and limited maturity dates. Advanced features like auto-rollovers will be introduced later.

marsbit16m ago

Morpho Launches Fixed-Rate Product Midnight: Lenders and Borrowers Set Their Own Rates, Ending the Era of Interest Rate Models

marsbit16m ago

human.tech Launches Clean SDK for Privacy-First Web3 Apps

human.tech has launched the Clean SDK, a toolkit enabling developers to build privacy-first Web3 applications with transparent accountability. Released alongside Aztec's version 5, the SDK provides components for integrating zero-knowledge identity verification, sanctions screening, and private transactions, without developers handling sensitive user data or building compliance infrastructure from scratch. It uses zero-knowledge proofs and programmable verification to allow apps to confirm user legitimacy and sanctions compliance while keeping identities confidential. The first application built on the SDK, Shield, a privacy bridge to Aztec, also launched. It allows users to transfer assets privately while proving a unique human is behind each transfer and that funds have passed sanctions checks, as verified by a May 2026 audit. The SDK offers three core verification techniques: Proof of Innocence (sanctions screening against 23 sources), Proof of Personhood (simpler verification via Human Passport), and Proof of Clean Hands (higher-assurance zero-knowledge government ID checks). This allows apps to authenticate users and transactions without exposing personal data. Designed for Aztec builders, the SDK lets developers add programmable privacy to decentralized apps, eliminating the need to create their own verification and ZK infrastructure. Shield demonstrates its practical use for private bridges, but the SDK aims to enable a wider ecosystem of private, accountable financial apps and services. The launch addresses growing demand for infrastructure that balances privacy and accountability. The SDK avoids traditional identity databases, storing encrypted data off-chain, screening at both entry and exit points, and including a gated disclosure mechanism for legal requests. human.tech's products, including the Clean SDK, focus on using zero-knowledge technology to enable verifiable personhood and privacy in digital systems.

TheNewsCrypto53m ago

human.tech Launches Clean SDK for Privacy-First Web3 Apps

TheNewsCrypto53m ago

Trading

Spot

Hot Articles

Discussions

Welcome to the HTX Community. Here, you can stay informed about the latest platform developments and gain access to professional market insights. Users' opinions on the price of S (S) are presented below.

活动图片