The two giants of analog chips, TI (Texas Instruments) and ADI (Analog Devices), both recently delivered strong quarterly results.
TI announced its Q2 2026 financial results, with revenue reaching $5.463 billion, a year-on-year increase of 23%. ADI announced its Q3 fiscal 2026 results for the period ending August 1, with revenue reaching $4.022 billion, a year-on-year increase of 40%, setting a new single-quarter historical high. Both companies benefited from rising demand in areas such as industrial and data centers, but their growth paths differ.
This article will compare TI and ADI side by side to see what different signals lie behind the strong growth of these two giants.
01
What Can We See in the Earnings Reports?
Both Accelerating, But with Different Details
First, let's look at the latest fundamentals of both companies.
ADI achieved revenue of $4.022 billion in Q3 fiscal 2026 ending August 1, up 40% year-on-year and 11% quarter-on-quarter. This marks the company's first single quarter surpassing $4 billion in history. TI achieved revenue of $5.463 billion in Q2 ending June 30, up 23% year-on-year and 13% quarter-on-quarter.
Year-on-year, ADI's growth rate was faster. Quarter-on-quarter, the growth rates of the two were similar. Overall, TI's scale is still larger, about 1.36 times that of ADI.
Taking a longer-term view, the shape of their recovery from the trough is also different.
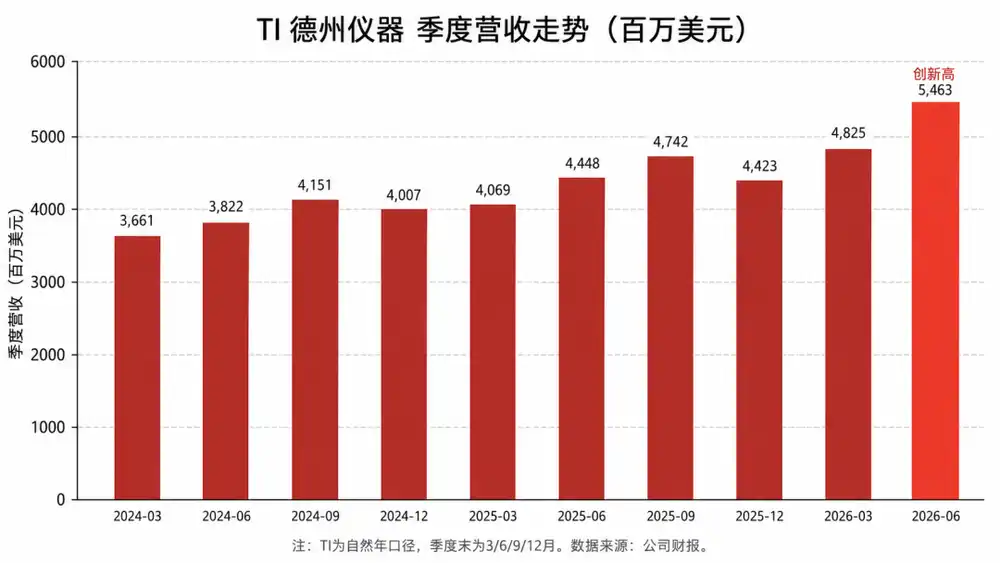
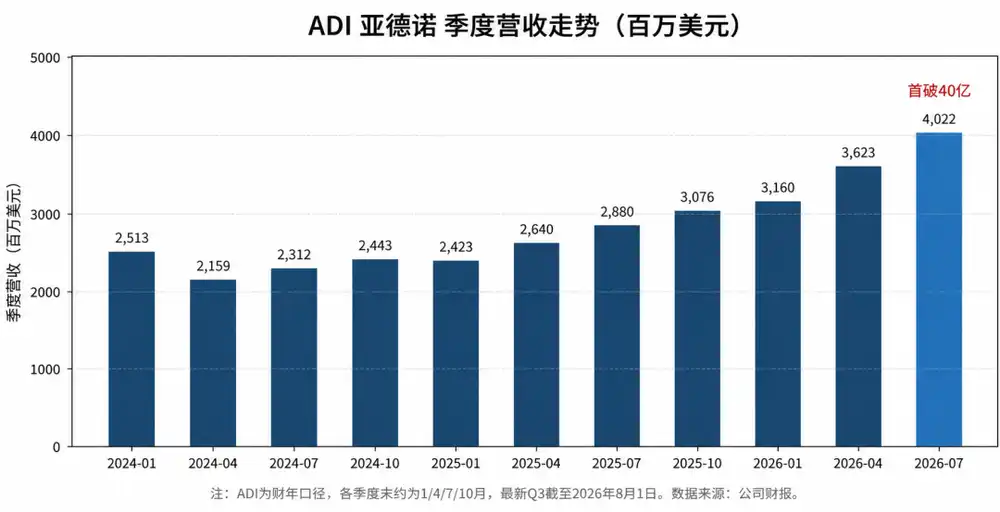
Both companies' quarterly revenues fell to recent lows in early 2024: TI 'bottomed out' in Q1 2024 (ending March 31, $3.661 billion), and ADI 'bottomed out' in fiscal Q2 (ending April 30, $2.159 billion). They have since recovered, but at different paces: TI saw ups and downs over the past two years and only showed significant consecutive quarter-on-quarter growth starting this year; ADI hovered at low levels for about a year before beginning significant growth, maintaining a relatively stable upward trend after entering 2025, gradually reaching over $4 billion.
Looking at business segments, TI described this quarter as "across-the-board strength": Industrial (33% of total revenue in 2025) grew approximately 30% year-on-year; Data Center (9% share) revenue doubled year-on-year; Automotive (33% share) grew by double-digit percentage points year-on-year, showing clear recovery within the quarter; Personal Electronics (21% share) was flat; Communications Equipment (3% share) grew both year-on-year and quarter-on-quarter. Multiple segments were running simultaneously.
ADI also achieved year-on-year growth across all four of its end markets, with Industrial and Communications performing strongly: Industrial accounted for 49% of this quarter's revenue, surging 53% year-on-year. Communications accounted for 16%, skyrocketing 84% year-on-year, with Data Center business currently making up 80% of that segment's revenue. Automotive accounted for 25%, growing 16% year-on-year. Consumer accounted for 10%, growing 6% year-on-year.
The common growth highlights for both are Industrial and Data Centers. However, TI emphasizes the simultaneous improvement across multiple end markets, with Automotive showing a new turn from weakness to strength this quarter. ADI, on the other hand, saw the most outstanding performance from its Industrial and Communications businesses.
Regarding gross margin, ADI more commonly uses adjusted (Non-GAAP) figures, with the latest quarter's gross margin at 72.5%. TI consistently uses GAAP-based figures. Comparing using the same GAAP basis, ADI's latest gross margin was 67.3%, while TI's was 61%, with ADI still significantly higher.
ADI's gross margin has been steadily improving since Q4 fiscal 2024. TI's gross margin fell below 60% in Q4 2023 and has fluctuated since, only returning above 60% this quarter.
Inventory, however, shows the opposite trend. TI's inventory at the end of Q2 was $4.6 billion, down $90 million from the previous quarter. Days of inventory outstanding (DIO) was 196 days, down 13 days quarter-on-quarter, having declined for two consecutive quarters. ADI's inventory continued to grow, reaching a new historical high of approximately $1.93 billion, but its DIO decreased to 156 days, and channel inventory weeks have already fallen below the target level of 6 to 7 weeks.
In terms of guidance, both are looking up. ADI expects next quarter revenue to be around $4.3 billion (±$100 million), which, if achieved, would set another new single-quarter record. TI expects Q3 revenue to be between $5.65 billion and $6.15 billion, representing a sequential increase of approximately 3% to 13%, and expects all markets to remain strong in Q3.
02
Where Do the Differences Come From?
At first glance, the two appear similar: performance is growing, driven by Industrial and Data Centers; gross margins are recovering; guidance is upward. But looking separately, the emphasis of their growth drivers differs.
TI attributed this quarter's strength mainly to Industrial and the broad-based recovery across several segments. Management believes the Industrial market is still in a recovery process, and although significant growth is already evident, there is still a gap compared to the peak levels of 2022. Meanwhile, data center construction is also driving related demand in energy infrastructure, test and measurement, etc.
Automotive was a new change this quarter. TI attributed its recovery to the Chinese market, especially driven by electric and hybrid vehicles, as well as automakers' inventory having previously dropped to low levels. As demand returns, restocking needs have also emerged.
In ADI's explanation, the weight of AI is significantly more pronounced. Management views Data Center and ATE (Automated Test Equipment related business) combined as the company's "AI exposure," which currently accounts for 20% of ADI's overall business. Within Data Center, ADI's optical and power products both achieved over 100% year-on-year growth. Additionally, it also mentioned growth opportunities from defense and long-term semiconductor content increase.
Unlike TI, ADI not only discussed the present but also gave a long-term outlook: ADI management revealed that its estimated serviceable available market (SAM) for the Data Center and Energy markets by 2030 has more than doubled compared to a year ago.
Putting the statements from both companies together, the common ground is clear: both are inseparable from Industrial recovery, Data Center/AI, and long-term market demand growth. Both also emphasize that this round is not simple inventory restocking but real demand. The difference lies in the focus: TI's growth is more diversified, while ADI relies more on the AI mainline.
On inventory, the two companies' actions also differ. ADI's inventory hit a new high this quarter, which management described as intentionally placed "strategic inventory" to support growing demand. At the same time, its channel inventory is already below the normal six to seven-week level. Low channel inventory suggests end-demand recovery is faster than inventory replenishment. Proactively increasing inventory also reflects ADI's relatively positive judgment on future demand.
TI's inventory remained essentially flat, with the amount slightly down by $90 million, still at the high level of $4.6 billion. Days of inventory outstanding (DIO) declined for two consecutive quarters to 196 days. However, its inventory amount hasn't significantly decreased. The decline in DIO is partly due to the inventory reduction and partly due to increased inventory turnover efficiency driven by revenue growth. It shouldn't be simply interpreted as TI actively destocking.
The differences in inventory strategy between the two also reflect differences in their underlying supply chain situations, including lead times, capacity, prices, etc.
First, supply. ADI has already begun to feel supply pressure. In July, ADI notified customers that lead times for some products have extended to up to six months and advised customers to place orders through channel partners at least six months in advance to ensure future supply. In the spot market, some chip distributors also reported that ADI's lead times have recently extended, with some orders placed months ago still not arriving.
TI appears much more at ease. In Q2, lead times remained below 13 weeks, just rising by a few weeks compared to earlier as demand grew. Management believes TI's current lead times remain among the most competitive in the industry. Regarding capacity, TI's factory utilization rates improved in Q2 compared to Q1 and continued to increase throughout the quarter. Management even stated that with the current capacity layout, TI will have "no issues" with capacity for the next three years.
Next, pricing. This year, both companies have issued price increase letters: TI issued two rounds, effective in April and July respectively; ADI's increases were effective in February and September this year.
Regarding the impact of price adjustments, the two companies' views also differ: TI management explicitly stated that in the next quarter's revenue growth expectation, the contribution from price is "almost negligible," with the vast majority of growth coming from increased shipment volumes. ADI, however, acknowledged that price increases are one of the factors driving gross margin improvement and indicated that the effect of price increases is not yet fully reflected and will continue to be released in subsequent quarters.
Reflected in the spot market, after ADI's price increase letter in December 2025, there was a wave of emotional price increases. Many said some customers stocked up in advance, but others reported the market was relatively flat. After the price increase officially took effect in February 2026, some distributors said customers maintained normal purchasing rhythms, but others saw increased ADI demand with slightly extended lead times. In July, after the new price increase letter was issued, according to quiksol, demand for popular and niche part numbers increased slightly, with prices for some models still rising.
For TI, after the price increase news spread in early March, quotes for some popular parts, especially general-purpose ones, rose rapidly, and the market also showed signs of tightening, but demand-side warming was not yet comprehensive. However, by mid-to-late March, the situation began to reverse, with those previously red-hot top-selling chips starting to drop in price. After the Qingming Festival, some models even saw their prices halved. After the new July price increase letter took effect, some model prices increased, but there was no widespread, significant rise. However, quiksol mentioned that TI's overall lead times have generally extended, from the original 8-12 weeks to 16-20 weeks.
03
Conclusion
In recent years, the analog chip industry experienced inventory adjustments and weak demand. Now, with the recovery in Industrial, Data Center, and AI infrastructure demand, signs of an industry recovery are emerging. However, this round of recovery is not a simple cyclical rebound; the demand structure is also changing.
Standing in the same analog chip recovery cycle, TI and ADI have taken two different paths: TI relies on broader market coverage and pre-prepared capacity to capture demand recovery; ADI, through "strategic inventory" deployment, is positioning itself ahead of future demand growth.
Looking ahead, as AI infrastructure continues to expand, it remains to be seen who can better translate demand into growth.
This article is from WeChat Official Account: Xin Shi Xiang , Author: San Fen Qian Tu, Original Title: "Analog Chip Giants TI and ADI Are Stepping Up!"